2899
Investigating the influences of spectral lineshape and linewidth in LCModel basis-sets on 1H MRS quantification at 7T1Animal imaging and technology (CIBM), EPFL, Lausanne, Switzerland, 2Laboratory for Functional and Metabolic Imaging (LIFMET), EPFL, Lausanne, Switzerland, 3Center for Magnetic Resonance Research, University of Minnesota, Minneapolis, MN, United States
Synopsis
In this study, we investigated the 1H MR spectra quantification accuracy using basis sets with different linewidths and lineshapes in LCModel. Simulation results showed that the estimated metabolite concentrations depend on the linewidths and lineshapes of the basis sets as well as the spectral lineshape. This effect was validated with in vivo MR results. We conclude that the spectral lineshape and linewidth of basis sets should be carefully considered for accurate metabolite concentration estimations from short-TE 1H MR spectra using LCModel.
Introduction
LCModel (Stephen Provencher Inc. Oakville, ON, Canada), is one of the frequently used software packages for metabolites quantification, which analyzes the in vivo 1H MR spectrum as a linear combination of individual metabolite spectra in the frequency domain.1 The basis sets can be simulated or measured in vitro. The accuracy and precision of metabolite quantification using LCModel can be affected by spectral quality including spectral linewidth, SNR, baseline, macromolecule spectra, etc. However, the effects of spectral lineshape and linewidth used in basis sets on spectral quantification have not been addressed2,3. Therefore, in this study, we aim to investigate the influence of basis-set spectral lineshape and linewidth on the accuracy of metabolite quantification. To do so, we simulated a series of short TE 1H MR spectra with Lorentzian, Gaussian, and Voigt lineshapes and fitted them with Lorentzian and Gaussian basis-sets with different linewidths. In vivo 1H MR spectra acquired by STEAM sequence at 7T were also used to validate the results.Methods
MR spectroscopyMR measurements were performed on a 7T human MR scanner (Siemens Medical Solutions, Erlangen, Germany) with a quadrature 1H surface coil. The ultra-short TE STEAM sequence was developed combined with VAPOR water suppression and interleaved Outer Volume Suppression (OVS)4. The MR spectra were acquired from a voxel (35×20×25mm3) in the occipital lobe of healthy volunteers (n=4) (TR/TE/TM = 5500/4.5/25ms, 64 averages, bandwidth = 4kHz, voxel size = 2048).
Simulations
The generation of the basis sets including 18 metabolites by the density matrix formalism was realized in MATLAB R2020a (The MathWorks Inc., Natick, MA, USA). The 1H chemical shifts, J-coupling constants, and the concentrations of metabolites used in simulations were taken from the literature5. The experimentally measured macromolecule spectra were included in basis sets6. The simulated 1H spectra were the linear addition of total 18 metabolites: ascorbate (Asc), alanine (Ala), aspartate (Asp), creatine (Cr), phosphocreatine (PCr), glucose (Glc), glutamine (Gln), glutamate (Glu), glutathione (GSH), glycerolphosphorylcholine (GPC), phosphorylcholine (PCho), myo-inositol (Ins), lactate (Lac), N-acetylaspartate (NAA), N-acetylaspartylglutamate (NAAG), phosphorylethanolamine (PE), scyllo-inositol (Scyllo), taurine (Tau), and macromolecules (MM) in the basis set. In this study, the linewidth of simulated spectra was set to 12Hz, which corresponds to the in vivo linewidth at 7T. Random noise was added for all simulated spectra (SNAA/RMSnoise = 300).
The time-domain function of a Voigt lineshape is the multiplication of the Lorentzian and the Gaussian. The simplified relationship of full width at half maximum (FWHM) in the frequency domain of these three profiles (fv for the Voigt, fl for the Lorentzian, and fg for the Gaussian) is given as 0.2166fl2+fg2=(fv-0.5346fl)2, which attains an accuracy of about 0.02%7. Three Voigt spectral lineshapes were studied (Voigt1: (fl, fg) = (10.8479Hz, 3.6000Hz); Voigt2: (fl, fg) = (8.8389Hz, 6.0000Hz); Voigt3: (fl, fg) = (5.9124Hz, 8.4000Hz)).
Spectral processing
FID-A was used for performing the coil combination, the frequency and zero-order phase corrections, and averaging for in vivo 1H MR spectra. The spectra were quantified by LCModel. Water-scaling was done for both in vivo and simulated spectra. The estimated error (EE) was calculated by (Cmeasured-Cground truth)/Cground truth×100%.
Results
Simulation results showed that the estimated metabolite concentrations are spectral-lineshape dependent as shown in Figure 1. The overestimation occurs in quantifying simulated spectra with Gaussian shape and the underestimation occurs in quantifying the spectra that are dominated by the Lorentzian shape function. Using the narrow linewidth (2Hz) in the basis sets, the estimated errors are independent of the lineshape of the basis-set spectra. However, EEs vary with the basis-set spectral linewidth when using the Lorentzian basis sets. For the Gaussian basis-set group, the variations of estimated concentrations with basis-set linewidth are less obvious. The effect of basis-set spectral lineshape and linewidth on the quantification bias is also validated with the quantification results of in vivo 1H MR spectra (Figure 2). Using Gaussian basis-sets, variations of measured concentrations of major metabolites with the basis-set spectral linewidth were less than 4% (normalized by the measured concentration using a 2Hz basis-set), which is much less than those using Lorentzian basis-sets (15-25% of normalized concentration variation).Discussions and Conclusions
When using the LCModel in 1H MR spectra quantification, the preparation of the basis-set is quite important for obtaining accurate concentrations of metabolites. The application of basis sets with different linewidths and lineshape affects quantification accuracy. When using the Lorentzian basis-sets, the estimated concentration is more dependent on the linewidth of the basis-sets, while this dependency is much less when using the Gaussian basis-set. The spectral lineshape also takes effects on the quantification accuracy. For 1H MR spectra which possess more Lorentzian lineshape, the concentrations are largely underestimated using either a Gaussian or Lorentzian basis-set with very narrow linewidth. In this case, using a Lorentzian basis set closer to the spectral linewidth can effectively reduce the bias. We conclude that the spectral lineshape and linewidth of basis sets should be carefully considered for accurate metabolite concentration estimations from short-TE 1H MR spectra using LCModel.Acknowledgements
This work was supported by the Swiss National Science Foundation (grants n° 320030_189064) and the US National Institutes of Health (grants P41 EB027061 and P30 NS076408). We acknowledge access to the facilities and expertise of the CIBM Center for Biomedical Imaging, a Swiss research center of excellence funded and supported by Lausanne University Hospital (CHUV), University of Lausanne (UNIL), Ecole Polytechnique Fédérale de Lausanne (EPFL), University of Geneva (UNIGE) and Geneva University Hospitals (HUG).
References
1. Provencher, S.W., 2001. Automatic quantitation of localized in vivo 1H spectra with LCModel. NMR in Biomedicine: An International Journal Devoted to the Development and Application of Magnetic Resonance In Vivo, 14(4), pp.260-264.
2. Near, J., Andersson, J., Maron, E., Mekle, R., Gruetter, R., Cowen, P. and Jezzard, P., 2013. Unedited in vivo detection and quantification of γ‐aminobutyric acid in the occipital cortex using short‐TE MRS at 3 T. NMR in Biomedicine, 26(11), pp.1353-1362.
3. Dehghani, M., Do, K.Q., Magistretti, P. and Xin, L., 2020. Lactate measurement by neurochemical profiling in the dorsolateral prefrontal cortex at 7T: accuracy, precision, and relaxation times. Magnetic resonance in medicine, 83(6), pp.1895-1908.
4. Tkáć, I. and Gruetter, R., 2005. Methodology of 1 H NMR spectroscopy of the human brain at very high magnetic fields. Applied magnetic resonance, 29(1), pp.139-157.
5. Govindaraju, V., Young, K. and Maudsley, A.A., 2000. Proton NMR chemical shifts and coupling constants for brain metabolites. NMR in Biomedicine: An International Journal Devoted to the Development and Application of Magnetic Resonance In Vivo, 13(3), pp.129-153.
6. Tkáč, I., Öz, G., Adriany, G., Uğurbil, K. and Gruetter, R., 2009. In vivo 1H NMR spectroscopy of the human brain at high magnetic fields: metabolite quantification at 4T vs. 7T. Magnetic Resonance in Medicine: An Official Journal of the International Society for Magnetic Resonance in Medicine, 62(4), pp.868-879.
7. Olivero, J.J. and Longbothum, R.L., 1977. Empirical fits to the Voigt line width: A brief review. Journal of Quantitative Spectroscopy and Radiative Transfer, 17(2), pp.233-236.
Figures
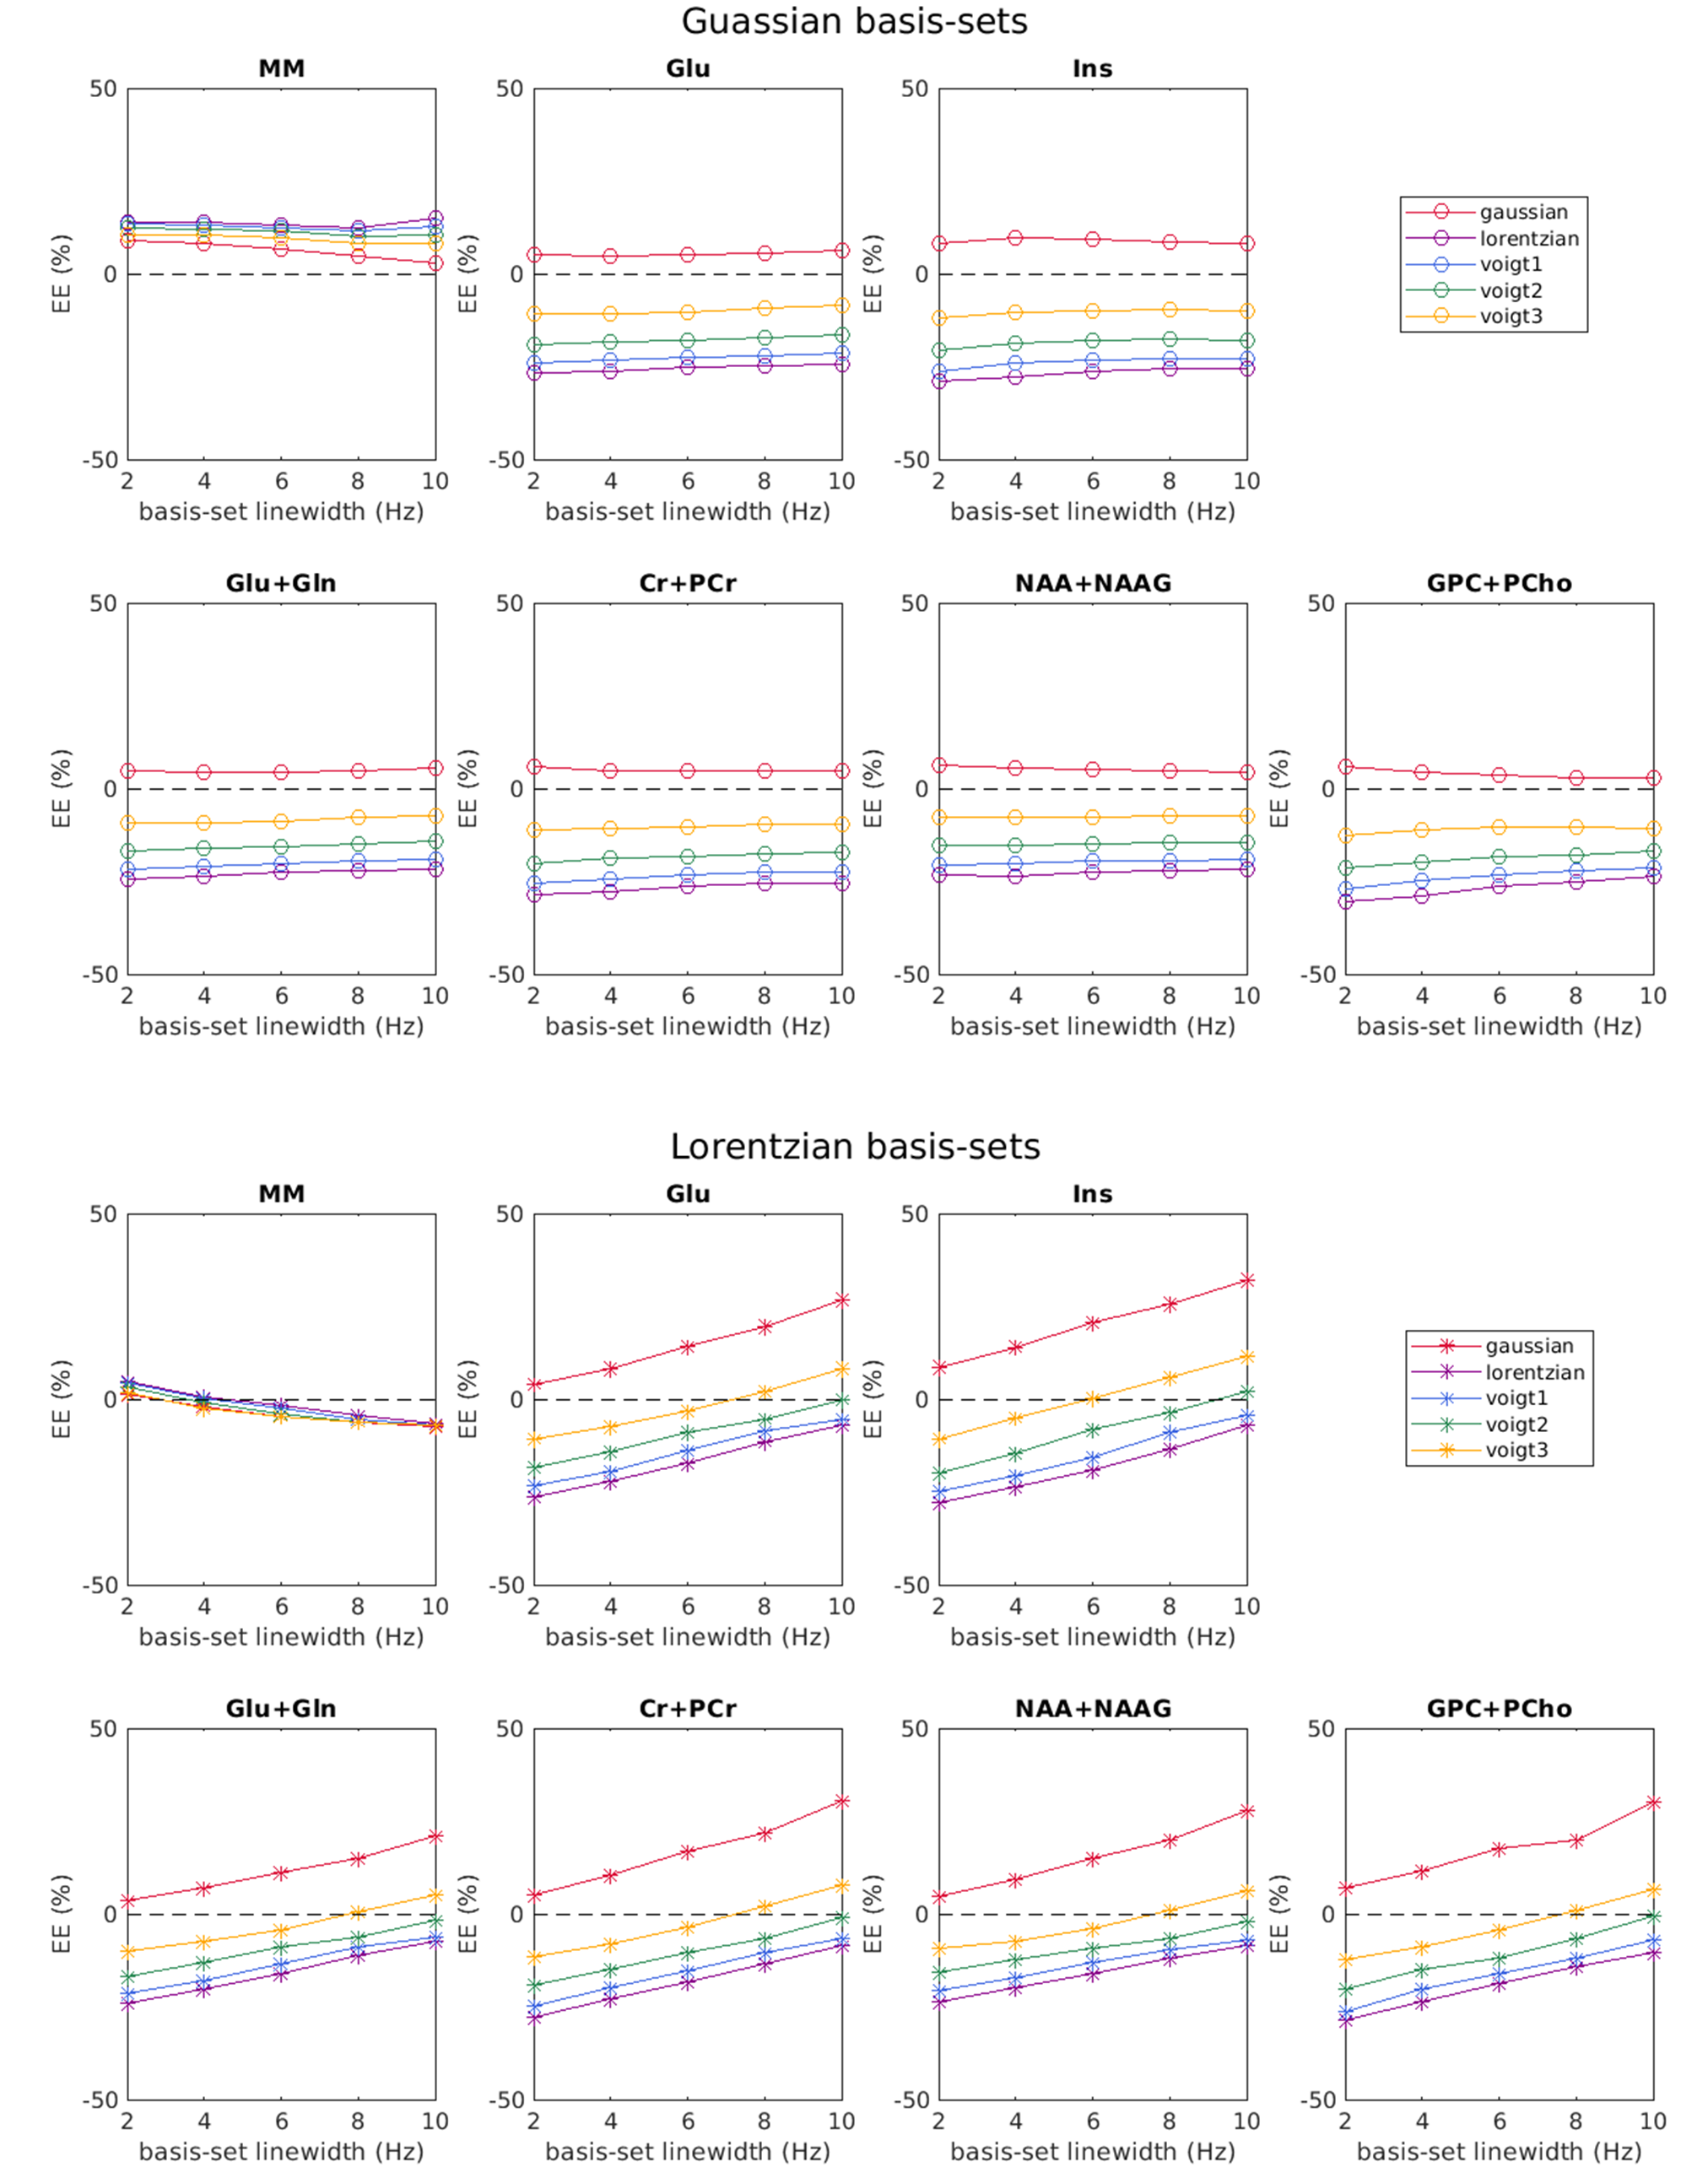
Figure 1: The estimated concentration errors (EE) of metabolites using simulated 1H MR spectra with Gaussian, Lorentzian, and Voigt lineshape and with a linewidth of 12Hz. The basis sets were simulated with Gaussian or Lorentzian lineshape with linewidths of 2, 4, 6, 8, 10 Hz. Each data point was the mean value of results from 100 spectra data sets.
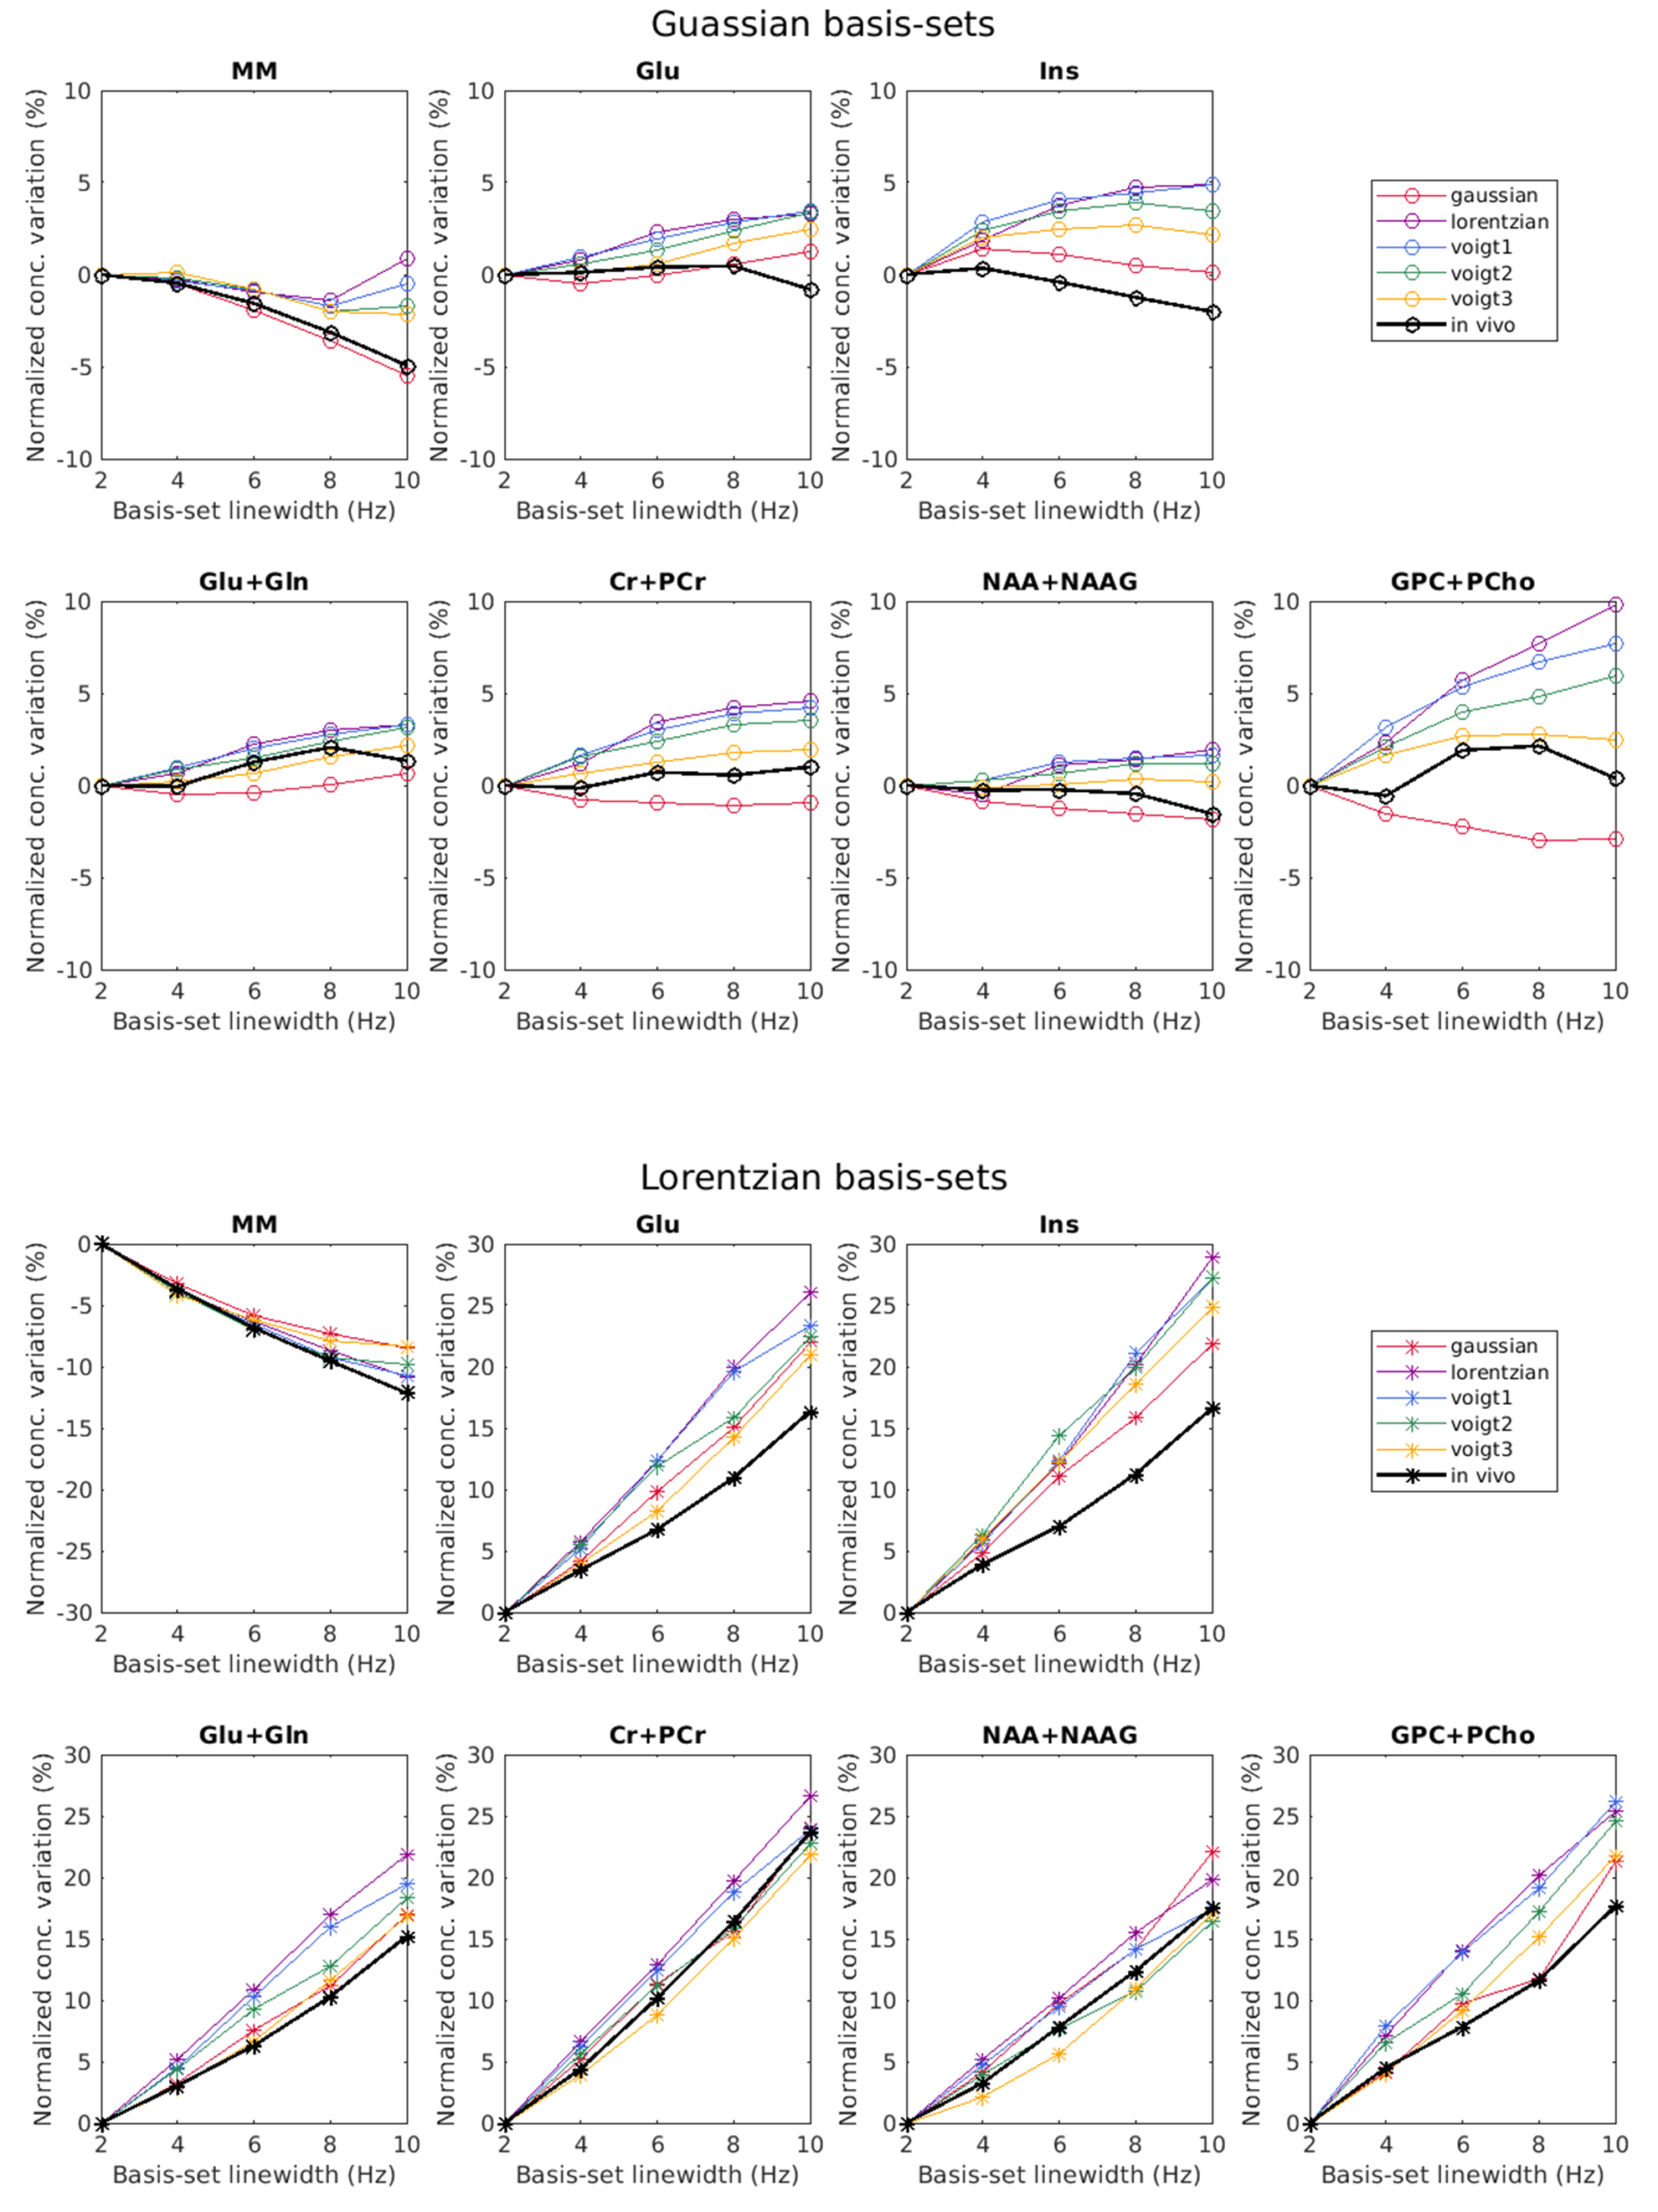
Figure 2: The variations of measured concentrations obtained from in vivo and simulated 1H MR spectra by using basis sets with different linewidths. To compare the effect with in vivo data, all values were normalized by the concentration quantified by the 2Hz basis-set (normalized concentration variation = (Cmeasured-Cmeasured with 2Hz basis-set)/Cmeasured with 2Hz basis-set×100%). The simulated data sets were described in figure 1. The in vivo data points were the mean metabolite concentrations from 4 subjects.