2898
Early response evaluation of neoadjuvant chemotherapy in locally advanced rectal cancer using T1 and T2 mapping1Departments of Radiology, West China Hospital, Sichuan University, Cheng du, China, 2Department of Clinical, West China Hospital, Sichuan University, Chengdu, China, 3Departments of Radiology, West China Hospital, Sichuan University, Chengdu, China, 4Philips Healthcare, China, Chengdu, China
Synopsis
Neoadjuvant chemotherapy can improve oncologic outcomes and overall survival rate. However, not all patients respond well during treatment, and continuous treatment will be painful, costly, and even increase risk of progression. Thus, early stratification of treatment response and screening of patients who may not be effective in treatment is very important. We investigated the value of T1 and T2 mapping MRI in response evaluation and found that T2 value showed a significant difference between groups of pre and 1-week post-treatment, while the T1 value had no statistical difference. T2 mapping may be a useful functional biomarker for early responses evaluation.
Introduction
Rectal Cancer is the 3rd most commonly diagnosed cancer in the United States (1). Neoadjuvant Chemotherapy (NCT) has been proven effective in the downstaging of locally advanced rectal cancers (LARCs) (2). However, not all patients respond well after the whole treatment, and continuous treatment will be futile,painful, costly, and even increase the risk of progression. Thus, it is critical to decide whether the treatment should be continued to maximize efficacy or switched to avoid toxicity in an early stage. In daily work, we usually judge the curative effect by the tumor volume change on conventional T2-weighted (T2W) combined with the signal change on diffusion-weighted imaging (DWI), which often takes several weeks or even more, and does not necessarily predict the final result. Parametric mapping including T1 and T2 mapping have recently emerged as a quantitative MRI technique that reflects the tumor microenvironment. In general, parametric mapping have several properties of a good diagnostic test, including a narrow normal range, high reproducibility, and more importantly, sensitivity to detecting changes in diseases. This study is to explore the feasibility of T1 mapping and T2 mapping in improving the early response assessment of neoadjuvant chemotherapy in LARCs.Materials and Methods
The study was approved by the West China Hospital of Sichuan University Biomedical Research Ethics Committee. 8 patients diagnosed with rectal adenocarcinomas pathologically, of moderate risk stage II / III(T3a-bN0-1, EMVI (±), MRF (-) (≥2mm) for low rectal cancer, or T3a-cN0-1, EMVI (±), MRF (-) (≥2mm) for medium and high rectal cancer) under magnetic resonance and endosonography, and with no distant metastases confirmed by comprehensive examinations were recruited. The neoadjuvant chemotherapy was carried out with capecitabine and oxaliplatin (CAPOX). All patients were scanned before treatment within 1week,7, 21, 42 days after the first medication, and before operation within 2 weeks. This study was performed on a 3.0 T MR scanner (Elition, Philips Healthcare, Netherlands). The detailed scan parameters were listed in Table 1. An experienced radiologist manually placed the ROIs on the same transversal slice of T2WI, DWI, T1 and T2 map which shows the largest lesion according to high-resolution T2W combined with DWI (Figure 1, 2). T1 and T2 values before and after the treatment were compared respectively.Result
Changes of T1 and T2 values have been shown in Figure1 and 2. T2 value showed a significant difference between groups of pre and 1-week post-treatment (88.2±4.3 ms VS 84.6±3.8 ms, P=0.032). Nevertheless, the T1 value of those two groups had no statistical difference (1385.2±386.8 ms VS 1582.1±133.8 ms, P=0.137).Discussion and conclusion
T1 and T2 can reveal altered microenvironment within tumors which is regarded as the foundation for response prediction. Decreased T2 value induced by successful NCT has been detected. Although the T1 value showed no statistical difference in an early stage, it may be valuable later for detection of fibrosis. Although our sample is small, the initial result has demonstrated that T2 mapping could be a promising marker for improving NCT response assessment. Further detection of changes in T1 and T2 mapping throughout the treatment is ongoing.Acknowledgements
No acknowledgement found.References
[1] Hyuna S, Jacques F, Rebecca L et al. Global Cancer Statistics 2020: GLOBOCAN Estimates of Incidence and Mortality Worldwide for 36 Cancers in 185 Countries. CA Cancer J Clin. 2021, 71(3): 209-249.
[2] Benson AB, Venook AP, Al-Hawary MM, et al. Rectal Cancer, Version 2.2018, NCCN Clinical Practice Guidelines in Oncology. Journal of the National Comprehensive Cancer Network, 2018, 16(7): 874–901.
[3] Christopher A. Hanson, Akshay Kamath, Matthew Gottbrecht, Sami Ibrahim, Michael Salerno. A T2 Relaxation Times at Cardiac MRI in Healthy Adults: A Systematic Review and Meta-Analysis. Radiology, 2020, 297(2): 344-351.
Figures
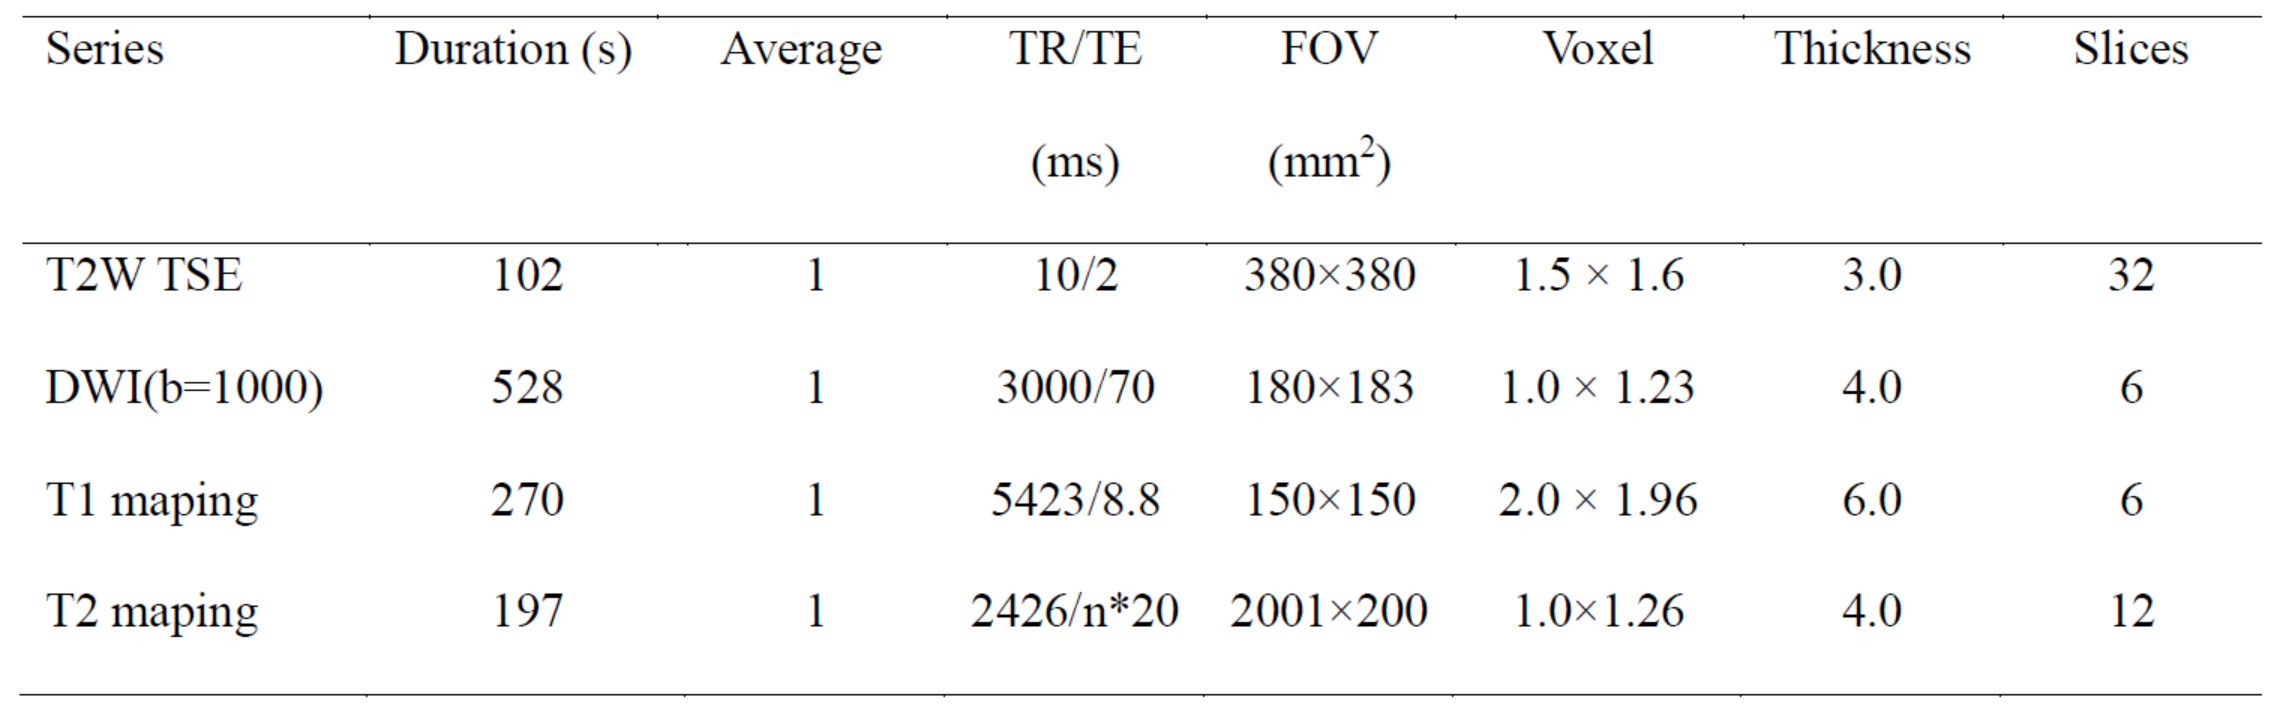
Table 1. Scan parameters of liver MR imaging protocols
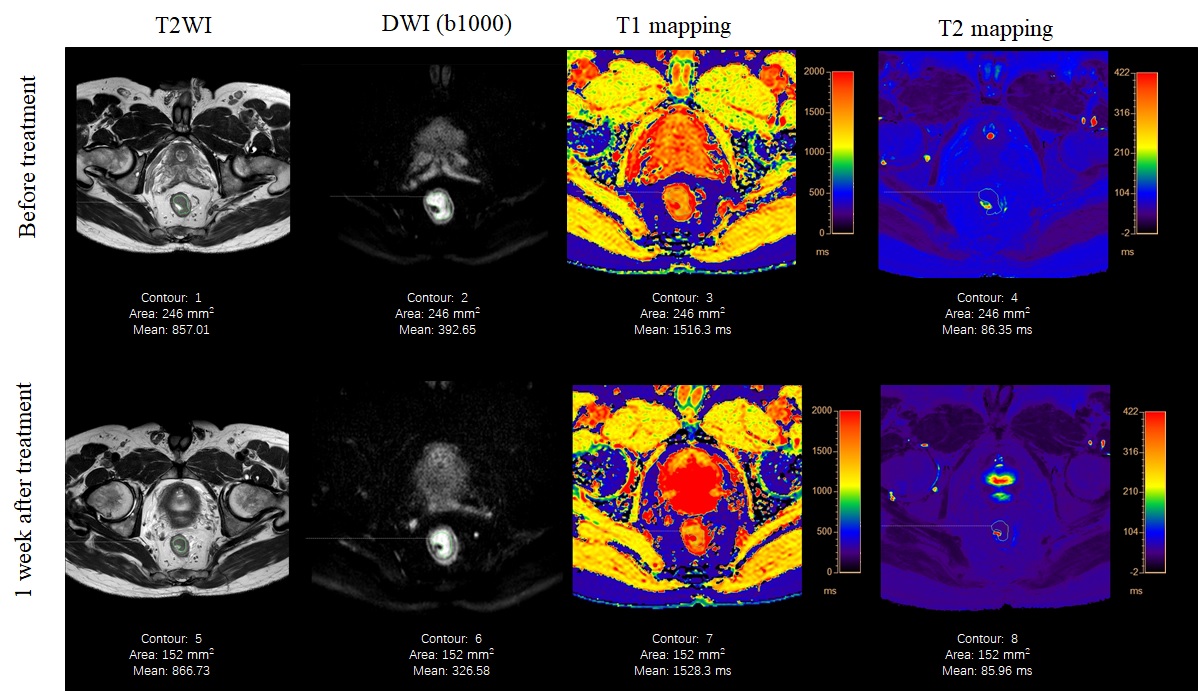
Figure 1. A 65-year-old male patient with LARC. T2WI, DWI(b=1000), T1mapping and T2 mapping at different time points (1 day before treatment, 1 week after treatment).
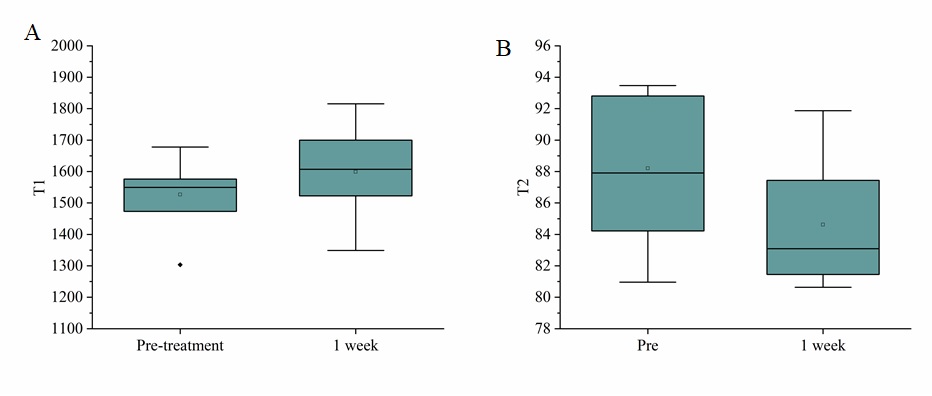
Figure 1. A 65-year-old male patient with LARC. T2WI, DWI(b=1000), T1mapping and T2 mapping at different time points (1 day before treatment, 1 week after treatment).