2897
The value of Intravoxel Incoherent Motion in Differentiating Renal Tumors with Low Signal Intensities on T2-weighted MR image
Jinghong Liu1 and Ailian Liu1
1The first hospital of Dalian medical university, Dalian, China
1The first hospital of Dalian medical university, Dalian, China
Synopsis
Clear cell carcinoma of kidney usually presents with high signal intensity on T2WI imaging, while some clear cell carcinoma presents with low signal intensity on T2WI imaging.Other rare renal tumors, such as papillary renal cell carcinoma and lipid-deficient angiomyolipoma, are characterized by low signal intensity on T2WI. Intravoxel incoherent motion (IVIM) is a model built on the basis of DWI, reflecting the structural changes and physiological state of cells from the microscopic level. Our objectivie si to evaluate the feasibility of the IVIM in differentiating renal tumors with low signal intensities on T2WI.
Synopsis
Clear cell carcinoma of kidney usually presents with high signal intensity on T2WI imaging, while some clear cell carcinoma presents with low signal intensity on T2WI imaging.Other rare renal tumors, such as papillary renal cell carcinoma and lipid-deficient angiomyolipoma, are characterized by low signal intensity on T2WI. Intravoxel incoherent motion (IVIM) is a model built on the basis of DWI, reflecting the structural changes and physiological state of cells from the microscopic level. Our objectivie si to evaluate the feasibility of the IVIM in differentiating renal tumors with low signal intensities on T2WI.Abstract
Objectives: To evaluate the feasibility of the intravoxel incoherent motion (IVIM) in differentiating renal tumors with low signal intensities on T2WI. Methods: Patients Our institutional review board approved this study and waived the requirement to obtain informed consent. We searched the data of patients who underwent renal MRI including eDWI examinations in our hospital through EMBPACS from Nov. 2015 to June 2021, and all patients were confirmed as renal tumor by surgical pathology. The author (15 years of experience) and a radiologist with 3 years of experience in abdominal imaging were used to screen the data of patients with T2WI low signal by independent review without clinical information. Finally, 31 cases were enrolled.There were 16 males and 15 females aged from 21 to 82 years, with an average of (54.8±15.6) years.There were 16 cases of clear cell renal cell carcinoma, 5 cases of angiomyolipoma, 6 cases of papillary renal cell carcinoma, 2 cases of chromophobe cell carcinoma, 1 case of unclassified renal cell carcinoma and 1 case of inflammation. Conventional T1WI and T2WI lipid-suppression scans and eDWI sequence scans were performed, followed by LAVA enhancement scans. According to the T2WI and LAVA enhanced images, the bleeding and necrosis were avoided. StandardADC value of single-index model, double-order single-index pure diffusion coefficient value (D-MONO), perfusion coefficient value (D* -MONO) and perfusion fraction (FMONO) of eDWI sequence of all patients were measured and recorded.Pure diffusion coefficient value (D-BI), perfusion coefficient value (D* -BI), perfusion fraction (fBi),Tensile index distribution model of diffusion coefficient values (distributed diffusion coefficient, DDC), tensile index value (the heterogeneity of intravoxel diffusion, alpha). Compare the Standard ADC value of eDWI sequence, parameters of dual index model (D-MONO, D* -Mono, FMONO, D-BI, D* -BI, fBi), and parameters of stretch index model (DDC, α) of benign and malignant groups.The corresponding ROC curve was drawn for the different parameters, and the diagnostic efficiency and threshold were analyzed.Results: Comparison of IVIM parameters between benign and malignant solid renal tumorsMalignant group (group A) consisted of 25 cases, including 16 cases of clear cell renal cell carcinoma, 6 cases of papillary renal cell carcinoma, 2 cases of chromophobe cell carcinoma and 1 case of unclassified renal cell carcinoma.There were 14 males and 10 females, with an average age of 57.9±14.5 years.Benign group (B) 6 cases, including 5 angiomyolipoma, inflammation 1 case;There were 1 male and 5 female with an average age of 42.2±14.2 years.There were significant differences in StandardADC, D-MONO, D* -Mono, FMONO, D-BI, D*-Bi and α values in benign and malignant groups (P < 0.05).There were no significant differences in F-BI and DDC between the two groups (P > 0.05).The results are shown in Table 1.2. ROC analysisROC curves of each parameter value of IVIM in the two groups are shown in Figure 3, and diagnostic boundary values are shown in Table 2.The area under ROC curve of all parameters was between 0.7 and 0.9.Conclusion
In conclusion, IVIM can identify renal tumors with low signal intensity on T2WI. Slow-adc value, fast-ADC value and α value of stretch index model have significant significance.Acknowledgements
No acknowledgement found.References
1. OlivaMR, GlickmanJN, ZouKH, et al. Renal cell carcinoma: T1 and T2 signal intensity characteristics of papillary and clear cell types correlated with pathology. AJR Am J Roentgeno, 2009, l192:1524.2. SchiedaN, vander Pol CB, MoosaviB, et al.Intracellular lipid in papillary renal cell carcinom a (pRCC): T2 weighted (T2W) MRI and pathologic correlation. EurRadiol, 2015, 25: 2134–2142.3. Chung MS, Choi HJ, KimMH, et al. Comparison of T2-weighted MRI with and without fat suppression for differentiating renal angiomyolipom as without visible fat from other renal tumors. AJR Am JRoentgenol, 2014, 202: 765–771.4. Sasiwimonphan K, Takahashi N, Leibovich BC, et al.Small (<4cm) renalmass: differentiation of angiomyolipom a without visible fat from renal cell carcinoma utilizing MR imaging. Radiology, 2012, 263: 160–168.5. ZhuQ, ZhuW, YeJ, etal. Value of intravoxel incoherent motion for differential diagnosis of renal tumors. Acta Radiol. 2019, 60(3):382-387.Figures
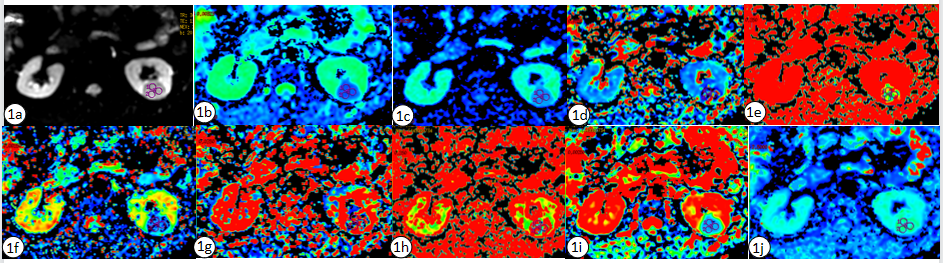
Fig. 1 A 37-year-old man affected by ccRCC of left kidney. A-j show the eDWI of the original map, Standard ADC map, D-mono map, D*-mono map, f mono map, D-Bi map, D*-Bi map, f Bi map, DDC map and α map.
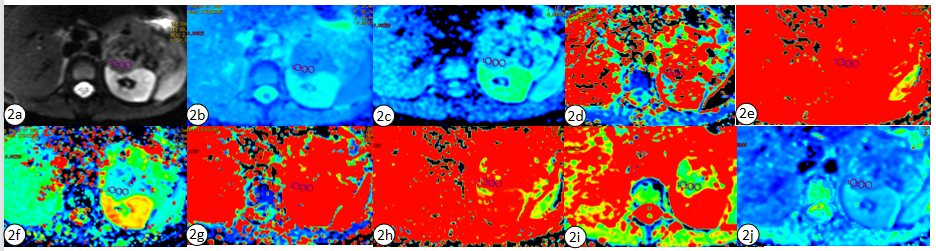
Fig. 2 A 30-year-old woman affected by AML of left kidney.A-j show the eDWI of the original map, Standard ADC map, D-mono map, D*-mono map, f mono map, D-Bi map, D*-Bi map, f Bi map, DDC map and α map.
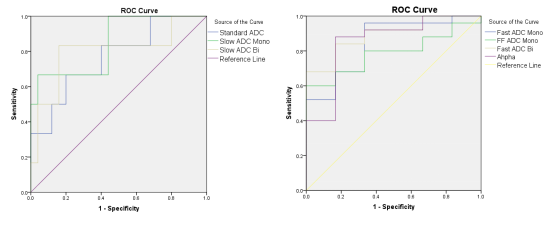
Fig. 3 They show the ROC maps of parameters of IVIM in differentiating malignant and benign renal tumors. A shows the ROC maps of Standard ADC, mono,and D-Bi.B shows the ROC maps of D*-mono, f mono, D*-Bi, f Bi and α.
DOI: https://doi.org/10.58530/2022/2897