2896
Anatomic changes during head and neck radiotherapy observed with automated MRI tracking1Medical Physics, Memorial Sloan Kettering Cancer Center, New York, NY, United States, 2Radiation Oncology, Memorial Sloan Kettering Cancer Center, New York, NY, United States
Synopsis
Longitudinal MRI is an ideal tool for tracking anatomic changes that occur during head and neck radiotherapy. We have implemented an image tracking system that monitors volumetric changes in gross tumor volumes (GTV) and parotid glands to identify and alert of major changes early in treatment. In a cohort of 91 patients, this system identified systematic shrinkage of GTVs (9.2±8.3% per week) and parotids (3.1±3.7% per week) during treatment. Importantly, GTV changes observed in the first week of treatment were strongly predictive of larger changes that would occur later in the course (P<1x10⁻⁵, two-tailed t-test).
Introduction
Anatomic changes are common during head and neck radiotherapy due, in part, to radiation-induced shrinkage of tumor volumes, lymph nodes, and parotid glands. These changes can bring critical structures into the irradiated field, increase treatment toxicity, and necessitate adaptive replanning [1,2]. Early-treatment changes may also have prognostic value as rapid tumor regression has been linked with positive outcomes [3–6]. For these reasons, actively tracking anatomic changes during radiotherapy would be clinically advantageous.Longitudinal MRI is an ideal technique for monitoring changes in head and neck anatomy. However, incorporating this into clinical practice can be logistically challenging because manually reviewing repeated scans is labor-intensive and infeasible at scale. To enable routine MRI tracking, we have implemented an automated system that collects and co-registers weekly scans and identifies changes in anatomy throughout treatment. The purpose of this study is to present tracking results captured by this system in an initial cohort of patients and assess the feasibility of identifying rapidly responding patients within the first week of treatment.
Methods
Weekly T2-weighted and fat-suppressed MRI scans were acquired on a 3-Tesla radiotherapy simulator (Philips Ingenia) for patients undergoing head and neck radiotherapy. Scans were 2D multi-slice and used repetition time TR=4645ms, echo time TE=80ms, and spatial resolution=0.9mmx0.9mmx3mm.Weekly scans were automatically flagged and processed using an in-house software package [7]. This system first deformably co-registered each scan to an initial baseline MRI and propagated nodal gross tumor volume (GTV) and parotid gland delineations that were used for treatment planning to the latest scan. Following contour propagation, a clinical team member was automatically e-mailed to review the latest deformed structures and make necessary adjustments. Structure changes were quantitatively assessed by computing the dice coefficient with respect to the initial deformed structure.
Weekly GTV and parotid volumes were then measured and normalized to baseline volumes to generate trends of relative volume change over time. Trends were interpolated to even one-week increments after the start of treatment, smoothed with a low-pass filter, and averaged at each week to identify population-wide trends.
We then assessed whether early changes in GTV volume could predict major changes later in the course. Volume trends were compared between GTVs with week-1 changes larger than the population median and GTVs with smaller initial changes. Weekly relative volumes and volume change-rates were compared between groups at each week of treatment using two-tailed t-tests. An optimal week-1 GTV change threshold was then determined to accurately predict large GTV changes at week-3 using receiver operator curve (ROC) analysis. To assess the feasibility of a fully automated pipeline, all analysis was repeated using deformed (non-edited) week-1 GTV volumes for prediction.
Results
MRIs were tracked for at least three weeks of radiotherapy for N=91 patients (Table 1). All treatments were delivered with 2 Gy per fraction to a total dose of either 30 Gy (N=67) or 70 Gy (N=24).An example time-series of longitudinal scans and GTV delineations is shown in Figure 1 and population trends are plotted in Figure 2. GTVs and parotids both shrunk considerably throughout treatment (Figure 2) with nodal GTVs shrinking by 9.2±8.3% per week and parotids shrinking by 3.1±3.7% per week. Ipsilateral parotids shrunk significantly faster than contralateral parotids (3.7±3.6% vs. 2.4±3.6% per week, P=0.02). Deformed structures were generally in good agreement with manually edited structures (Dice=0.80±0.15 for GTVs, 0.88±0.09 for parotids), though agreement degraded in later weeks (Table 2).
GTV changes measured at week-1 were predictive of significant subsequent changes (Figure 3) – GTVs with initial shrinkage greater than the median (11%) shrunk significantly more than other GTVs in subsequent weeks (total shrinkage=30.7±13.0% vs. 4.6±18.5% at week 2, 41.0±18.5% vs. 17.3±21.3% at week 3, P<1x10⁻⁵). Week-1 GTV volume change predicted large week-3 changes (>33.7%, median) with an area under the ROC curve (AUC) of 0.79. The optimal week-1 cutoff for predicting large changes at week-3 (8.3%) achieved 74% accuracy (sensitivity/specificity = 81%/66%). Using the median week-1 value (11.0%) as the cutoff slightly reduced accuracy to 72% (sensitivity/specificity = 72%/72%). Results were similar when unedited deformed week-1 GTV volumes were used for prediction: AUC=0.77, optimal threshold=11.1%, accuracy=73%, sensitivity/specificity = 77%/68% (Figure 3).
Discussion
Our image tracking system collected and processed longitudinal MRI data from 91 patients undergoing head and neck radiotherapy and observed systematic shrinkage of both GTVs and parotid glands. Observed changes were largely consistent with other reports in the literature [8–10]. Good agreement between automatically generated and manually revised contours indicates that fully automated tracking may also be viable. This would permit routine tracking at-scale without overburdening clinical resources.Changes in GTV volume observed after one week of treatment were predictive of large overall volumetric response. This indicates that patients responding well to treatment may be identified before large changes occur. This may help identify candidates for adaptive replanning earlier in treatment, potentially enabling more effective and efficient adaptation strategies. Furthermore, early volumetric trends may allow clinicians to refine patient-specific prognoses [3–6] and potentially personalize treatment strategies.
Conclusion
Our MRI tracking system identified longitudinal changes in GTV and parotid volumes during radiotherapy. Results suggest that this system may be useful for identifying responders as early as one week into treatment.Acknowledgements
No acknowledgement found.References
1. Wu Q, Chi Y, Chen PY, Krauss DJ, Yan D, Martinez A. Adaptive Replanning Strategies Accounting for Shrinkage in Head and Neck IMRT. Int J Radiat Oncol. 2009 Nov 1;75(3):924–32.
2. SA B, M D, K B, HA M, V H, Y B, et al. Weekly volume and dosimetric changes during chemoradiotherapy with intensity-modulated radiation therapy for head and neck cancer: a prospective observational study. Int J Radiat Oncol Biol Phys [Internet]. 2010 Apr [cited 2021 Sep 17];76(5):1360–8. Available from: https://pubmed.ncbi.nlm.nih.gov/20338474/
3. C J, B D, F B, J R, D P, B B, et al. Prognostic value of tumor regression during radiotherapy for head and neck cancer: a prospective study. Int J Radiat Oncol Biol Phys [Internet]. 1995 Sep 30 [cited 2021 Sep 17];33(2):271–9. Available from: https://pubmed.ncbi.nlm.nih.gov/7673014/
4. Lee H, Ahn YC, Oh D, Nam H, Noh JM, Park SY. Tumor Volume Reduction Rate during Adaptive Radiation Therapy as a Prognosticator for Nasopharyngeal Cancer. Cancer Res Treat [Internet]. 2016 Apr 1 [cited 2021 Sep 17];48(2):537. Available from: /pmc/articles/PMC4843740/
5. SN Y, CY L, SW C, JA L, MH T, CH H, et al. Clinical implications of the tumor volume reduction rate in head-and-neck cancer during definitive intensity-modulated radiotherapy for organ preservation. Int J Radiat Oncol Biol Phys [Internet]. 2011 Mar 15 [cited 2021 Sep 22];79(4):1096–103. Available from: https://pubmed.ncbi.nlm.nih.gov/20605362/
6. H L, YC A, D O, H N, YI K, SY P. Tumor volume reduction rate measured during adaptive definitive radiation therapy as a potential prognosticator of locoregional control in patients with oropharyngeal cancer. Head Neck [Internet]. 2014 [cited 2021 Sep 27];36(4):499–504. Available from: https://pubmed.ncbi.nlm.nih.gov/23780633/
7. Y. MH, S. F, N. T, J. M, P. Z, C. P, et al. Developing and validating an automatic system of tracking parotid shrinkage in weekly MRIs for adaptive radiotherapy. In: 60th Annual Meeting of the American Association of Physicists in Medicine (AAPM) [Internet]. Nashville, TN; 2018. Available from: https://w3.aapm.org/meetings/2018AM/programInfo/programAbs.php?sid=7634&aid=39341
8. Barker JL, Garden AS, Ang KK, O’Daniel JC, Wang H, Court LE, et al. Quantification of volumetric and geometric changes occurring during fractionated radiotherapy for head-and-neck cancer using an integrated CT/linear accelerator system. Int J Radiat Oncol Biol Phys. 2004 Jul 15;59(4):960–70.
9. D Y, S Y, Q W, X L, Z L, Y W. Predictors for replanning in loco-regionally advanced nasopharyngeal carcinoma patients undergoing intensity-modulated radiation therapy: a prospective observational study. BMC Cancer [Internet]. 2013 Nov 16 [cited 2021 Sep 17];13. Available from: https://pubmed.ncbi.nlm.nih.gov/24237861/
10. Surucu M, Shah KK, Mescioglu I, Roeske JC, William Small J, Choi M, et al. Decision Trees Predicting Tumor Shrinkage for Head and Neck Cancer: Implications for Adaptive Radiotherapy. https://doi.org/101177/1533034615572638 [Internet]. 2015 Mar 2 [cited 2021 Sep 17];15(1):139–45. Available from: https://journals.sagepub.com/doi/full/10.1177/1533034615572638
Figures
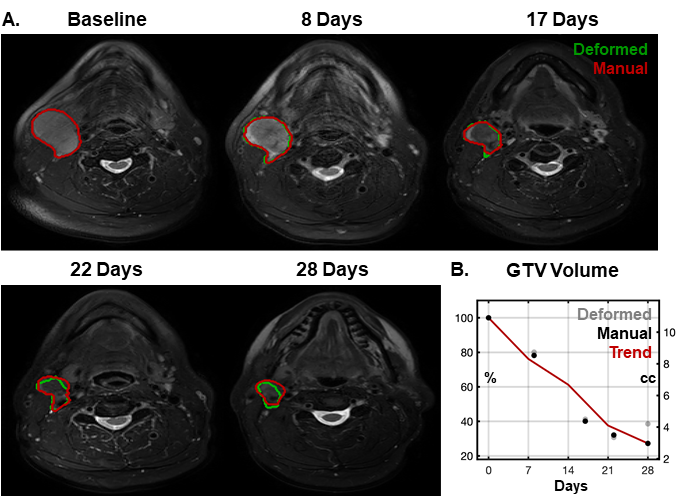
Figure 1 – Example images and propagated nodal GTV volumes from throughout a course of radiotherapy (A). Green contours indicate the deformed volumes directly output from automated image analysis and red contours indicate manually edited volumes. This GTV showed a clear trend of shrinkage over time with >20% regression at the first weekly scan and >60% regression by end of treatment (B).
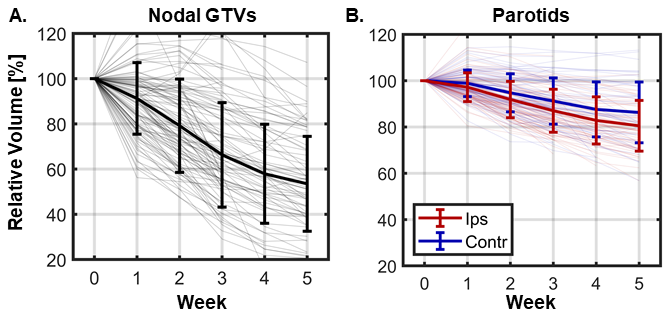
Figure 2 – Population volume trends during radiotherapy for nodal GTVs (A) and parotid glands (B). Thin lines show trends for individual patients while thick errorbars show the population mean ± one standard deviation. On average, GTVs shrunk by 9.2±8.3% per week and parotids shrunk by 3.1±3.7% per week. Ipsilateral parotids shrunk significantly faster than contralateral parotids (3.7±3.6% vs. 2.4±3.6% per week, P=0.02). Note that for patients treated to 30 Gy (~3 weeks of treatment), these plots include volume measurements after the conclusion of radiotherapy.
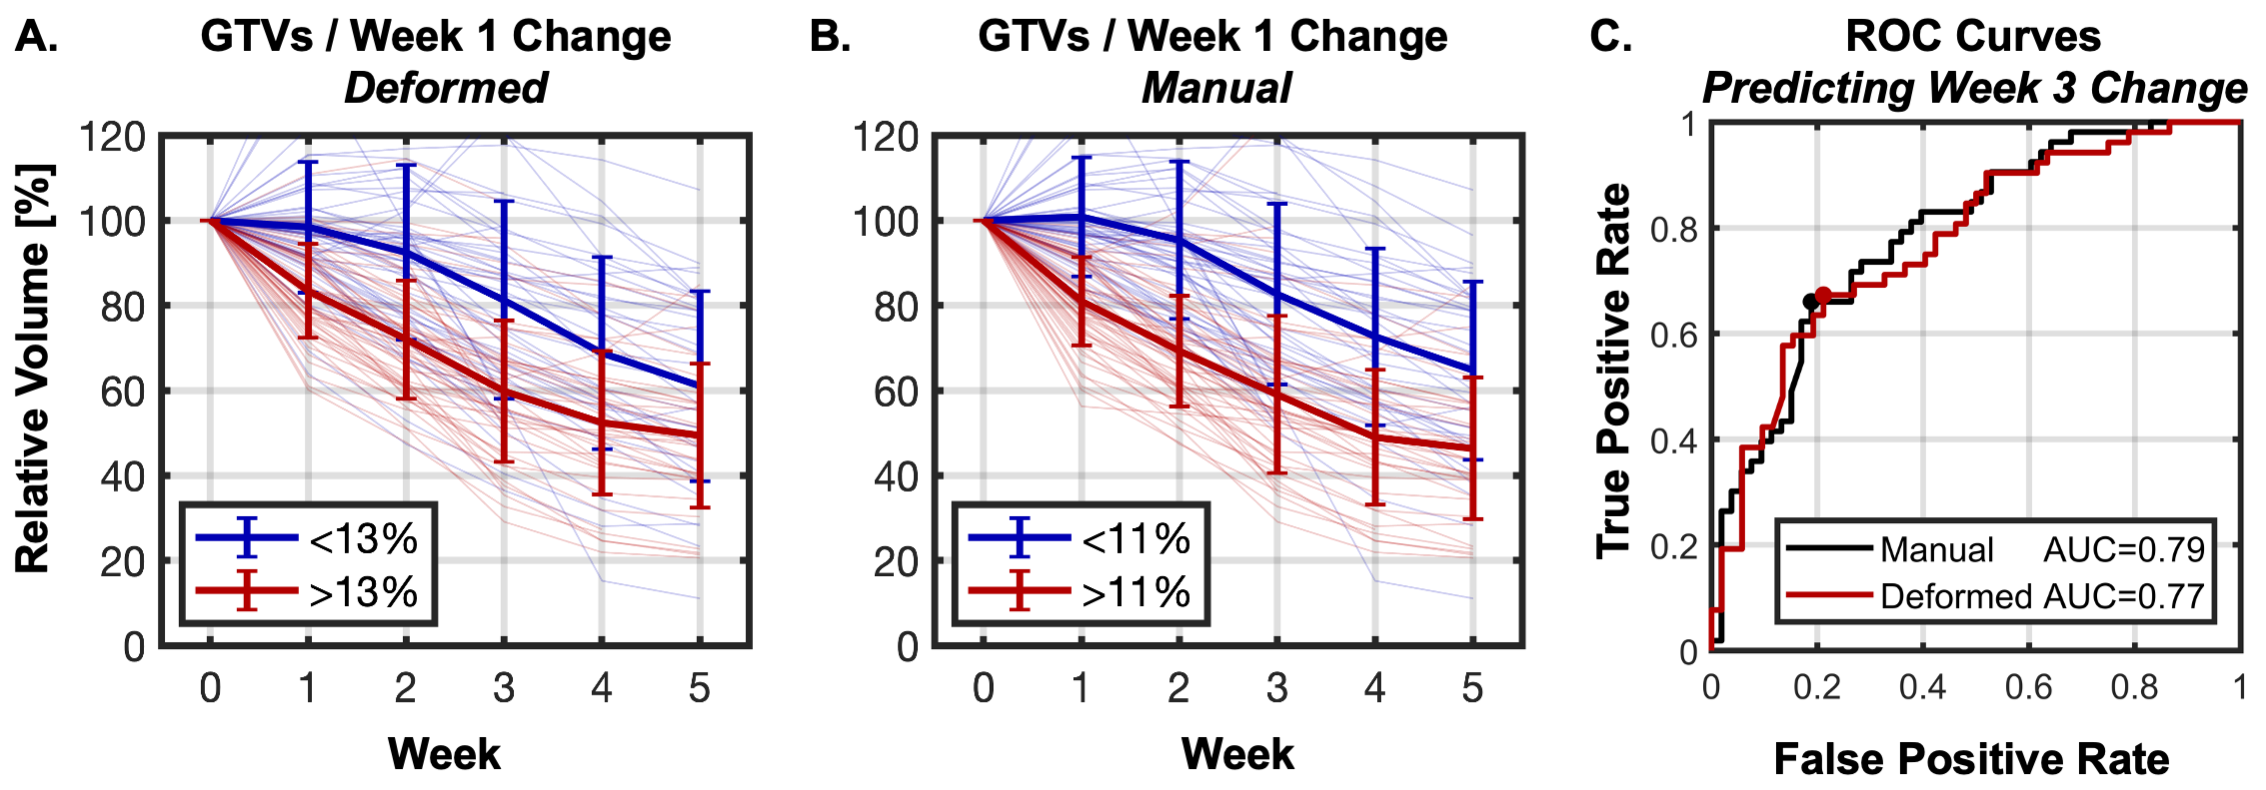
Figure 3 – Nodal GTV volume trends during radiotherapy divided according to the initial change in GTV volume measured at week one of treatment with deformed (A) and manually reviewed/revised (B) volumes. GTVs with week-1 changes larger than the median (red) shrunk significantly faster than those with smaller changes (blue) in subsequent weeks. ROC analysis (C) showed that week 1 GTV changes predicted whether the week-3 change would exceed the median with AUC=0.79 for manual (black) and 0.77 for deformed (red) GTVs.
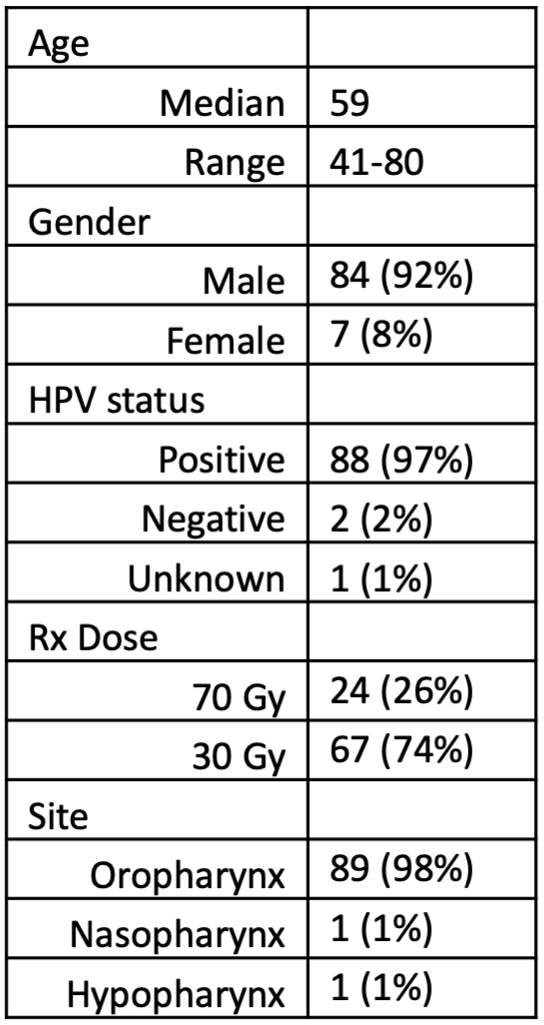

Table 2 – Dice overlap coefficients between deformed and manually revised structures at each week. Deformed parotid delineations were generally in better agreement with manual counterparts than GTVs (average Dice at all timepoints: 0.88±0.09 vs. 0.80±0.15, P<1x10⁻⁵) and were stable over time (2.3% between weeks 1 and 5). Dice coefficients for GTVs decreased more with each passing week (7.2% drop between weeks 1 and 5), although the change was not significant (ANOVA P=0.1).