2895
Three IVIM-DWI models to predict survival risk in laryngeal and hypopharyngeal squamous cell carcinoma patients after (chemo)radiotherapy1Radiology, National Cancer Center/Cancer Hospital, Chinese Academy of Medical Sciences and Peking Union Medica, Beijing, China, 2Radiology, National Cancer Center/National Clinical Research Center for Cancer/Cancer Hospital & Shenzhen Hospital, Shenzhen, China, 3Radiology, Peking University Third Hospital, Beijing, China
Synopsis
To investigate the predicted survival risk power of three IVIM-DWI models in laryngeal and hypopharyngeal squamous cell carcinoma (LHSCC) patients after (chemo)radiotherapy, 45 patients were retrospectively enrolled. IVIM-DWI sequence scanning was performed using echo planner imaging (EPI) sequence with 12 b values (0, 10, 20, 30, 50, 70, 100, 150, 200, 400, 800 and 1000 s/mm2). Followed up for 2-72 months with median follow-up of 14 months. The pretreatment ADC, D, f value and D* value were significantly correlated with prognosis of local disease, and the pretreatment ADC, D* value were independent biomarkers for survival risk prediction.
Introduction and Purpose
Laryngeal and hypopharyngeal squamous cell carcinoma had high response rate to radiotherapy and chemotherapy, the two methods were recommended as first-line treatment to preserve organ function1. However, not all patients could benefit from (chemo)radiotherapy (CRT). A number of studies have suggested that for those patients who are recommended CRT due to current clinical staging-oriented guideline but has poor response to CRT, surgery might be a better choice, especially for local advanced patients2,3. The aim of this study was to investigate the predicted prognosis and survival risk power of three IVIM-DWI models, including mono-exponential, bi-exponential and stretched exponential model in laryngeal and hypopharyngeal squamous cell carcinoma (LHSCC) patients after (chemo)radiotherapy.Materials and methods
This retrospective study was approved by the local institutional review board, and written informed consent was obtained from all enrolled patients. 45 patients with laryngeal or hypopharyngeal squamous cell carcinoma were retrospectively enrolled. All patients have undergone 3.0T MR imaging (GE Discovery MR 750, US) including pretreatment IVIM-DWI examination with an 8-channel phased array head and neck combined coil. IVIM-DWI sequence scanning was performed using echo planner imaging (EPI) sequence with 12 b values (0, 10, 20, 30, 50, 70, 100, 150, 200, 400, 800 and 1000 s/mm2). Within 6 years of follow-up, survival data was obtained for each patient. All the data were statistically analyzed using SPSS 21.0 software (IBM, US). The data were tested by t test or Mann-Whitney U test. Predictive parameters were scored as risk factors for progression free survival (PFS) in Kaplan-Meier survival analysis and Cox regression analysis. P values < 0.05 were considered significant. The sensitivity and specificity of each parameter for prediction were evaluated by ROC curve analysis.Results
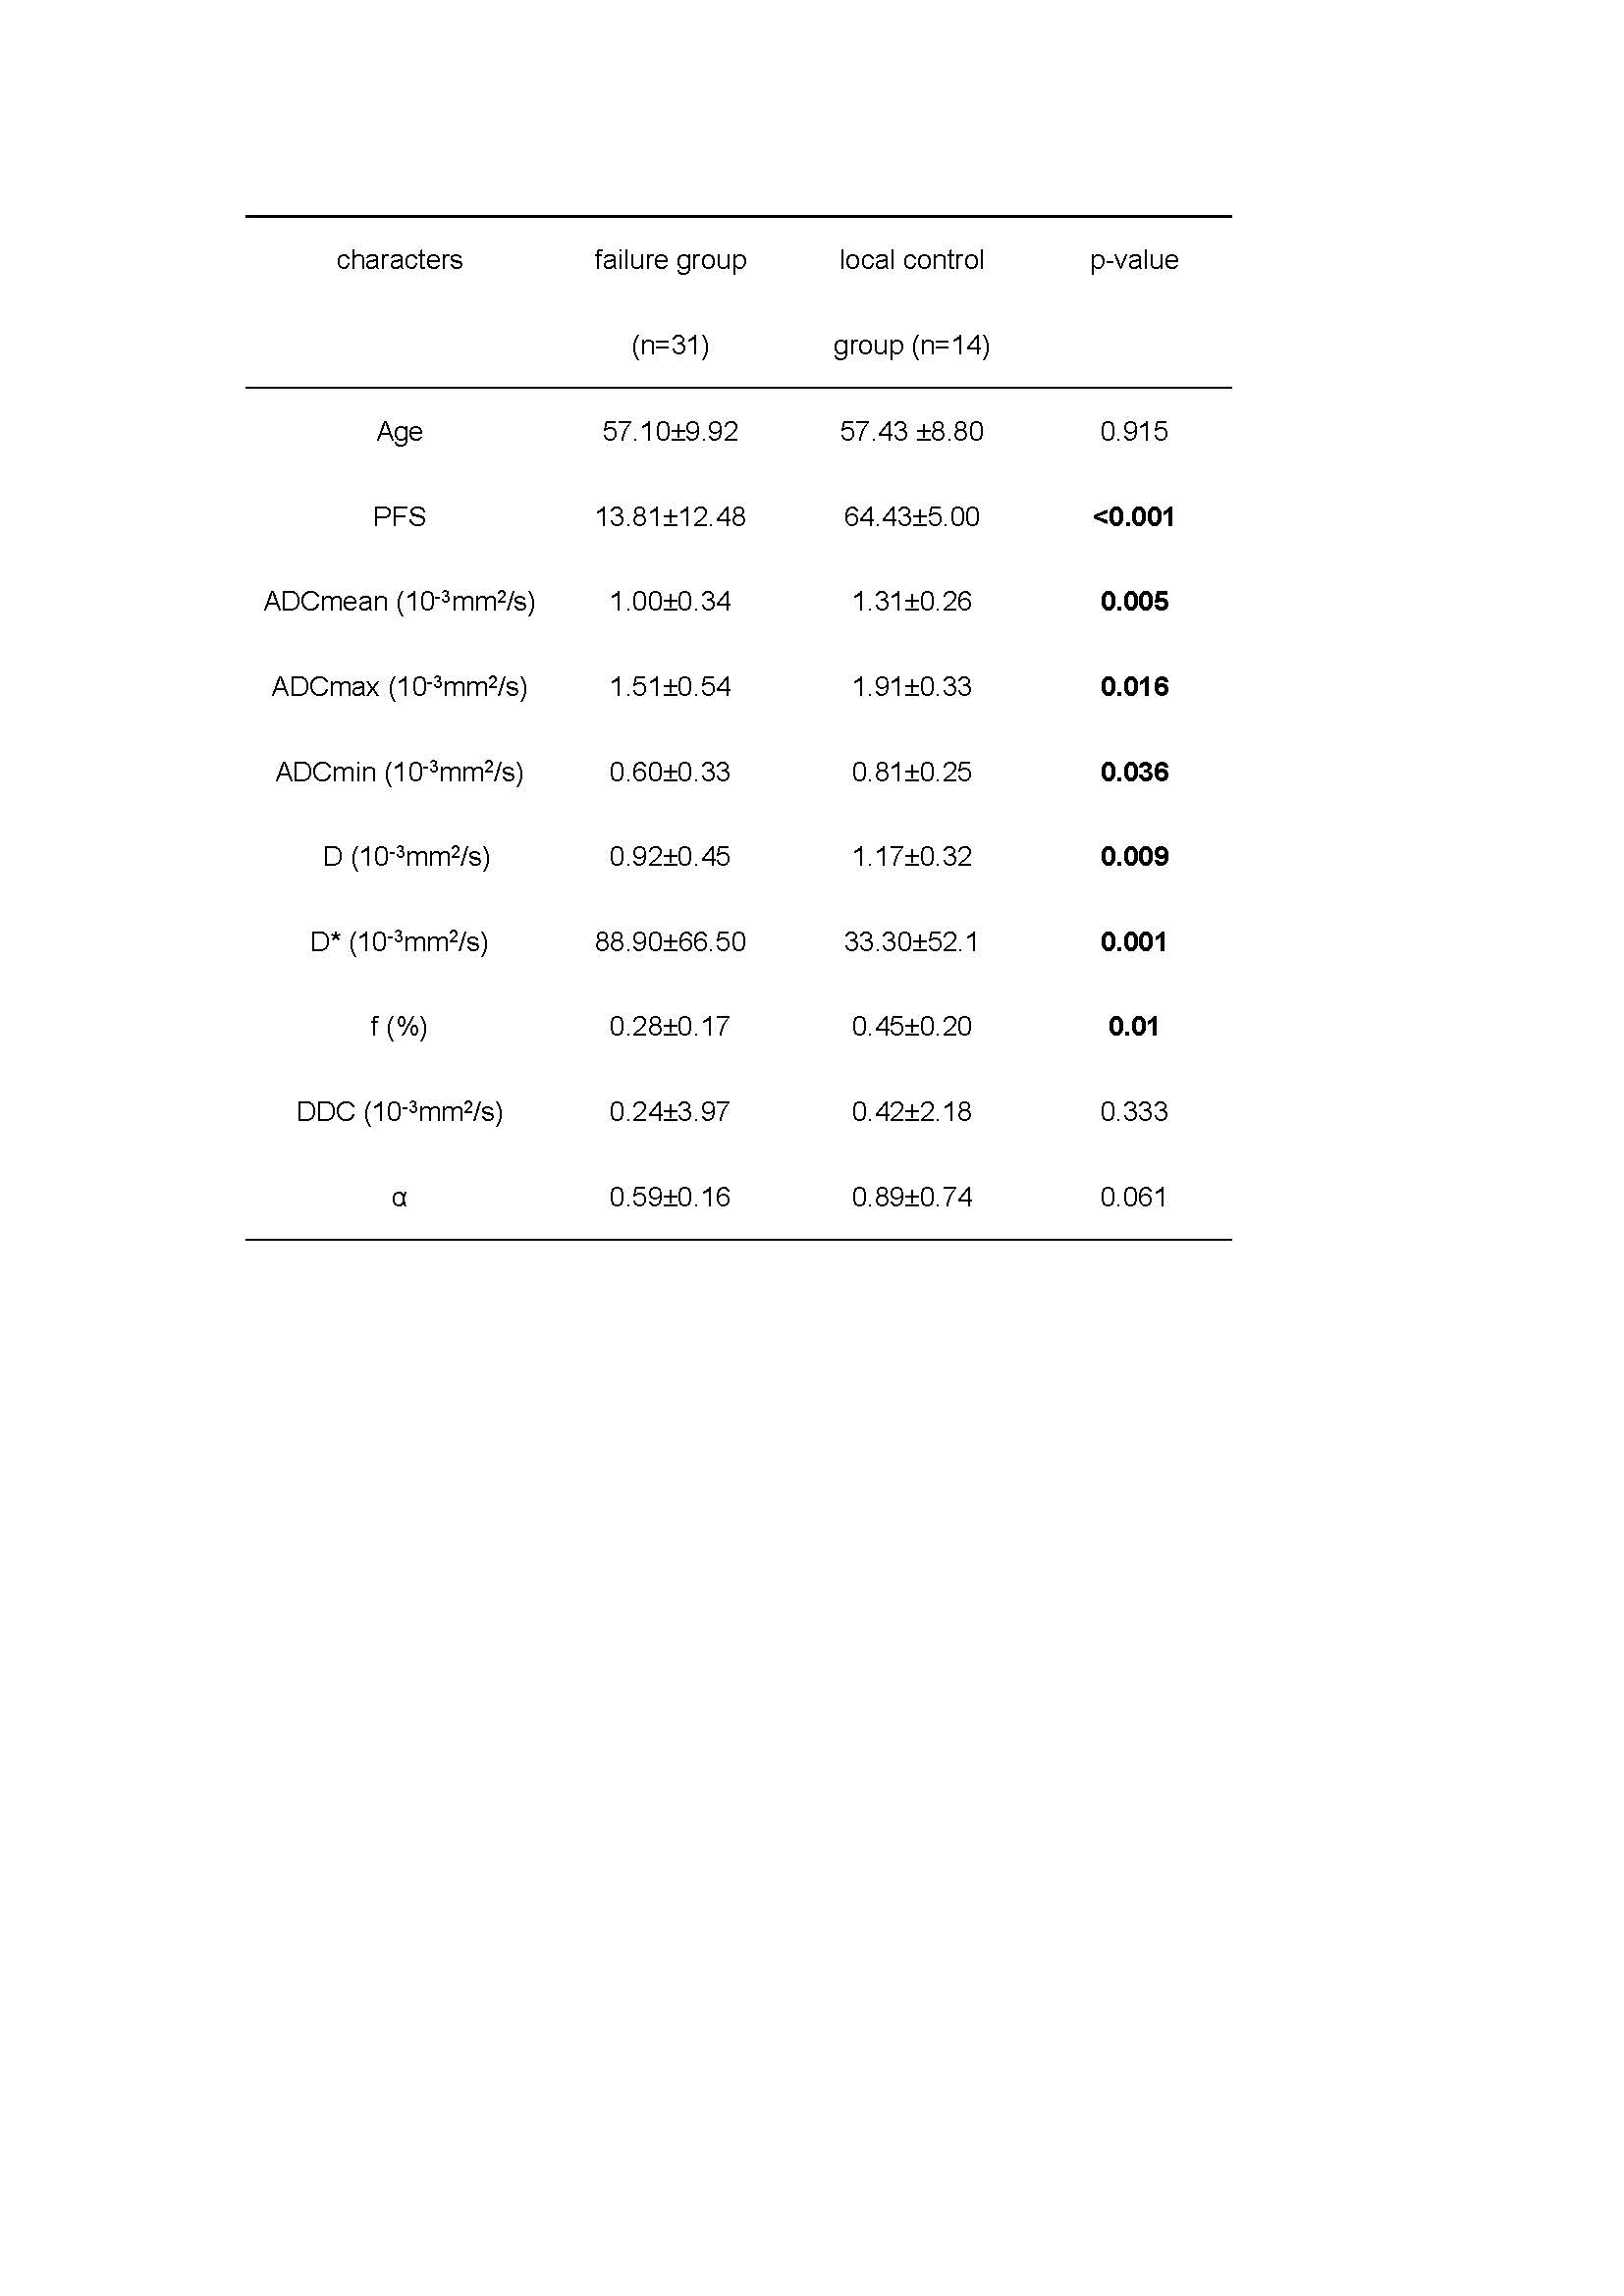
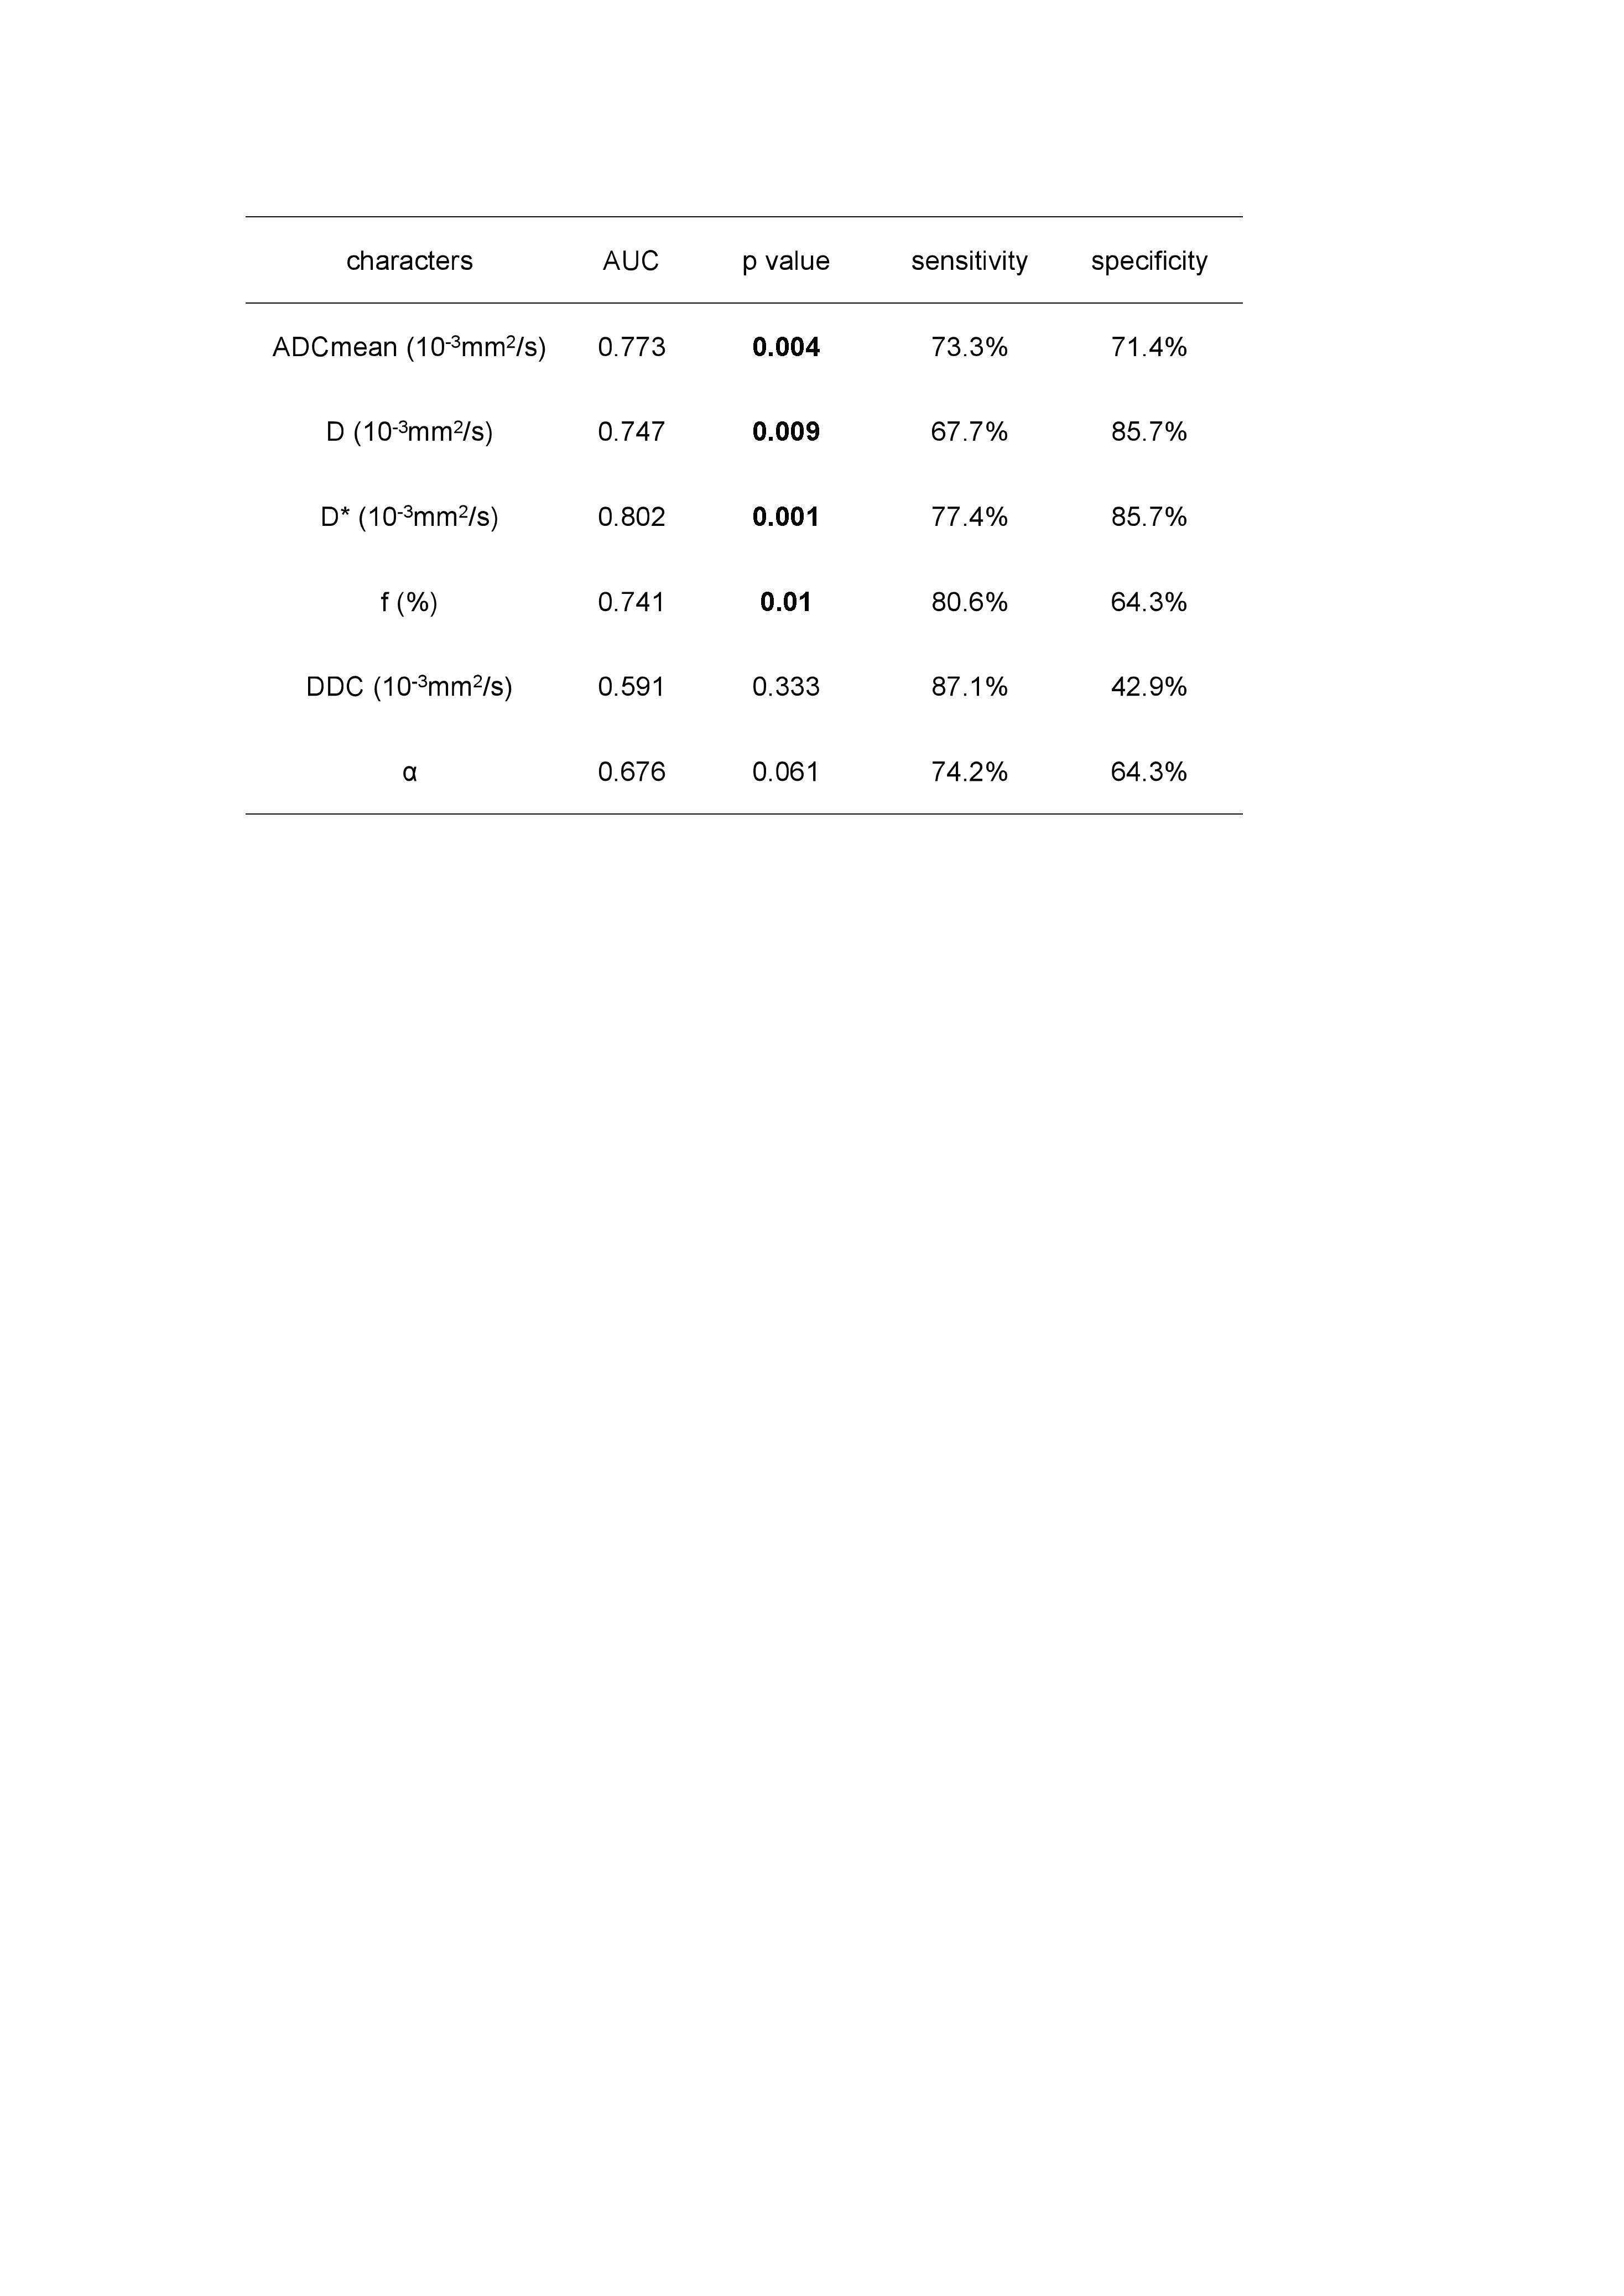
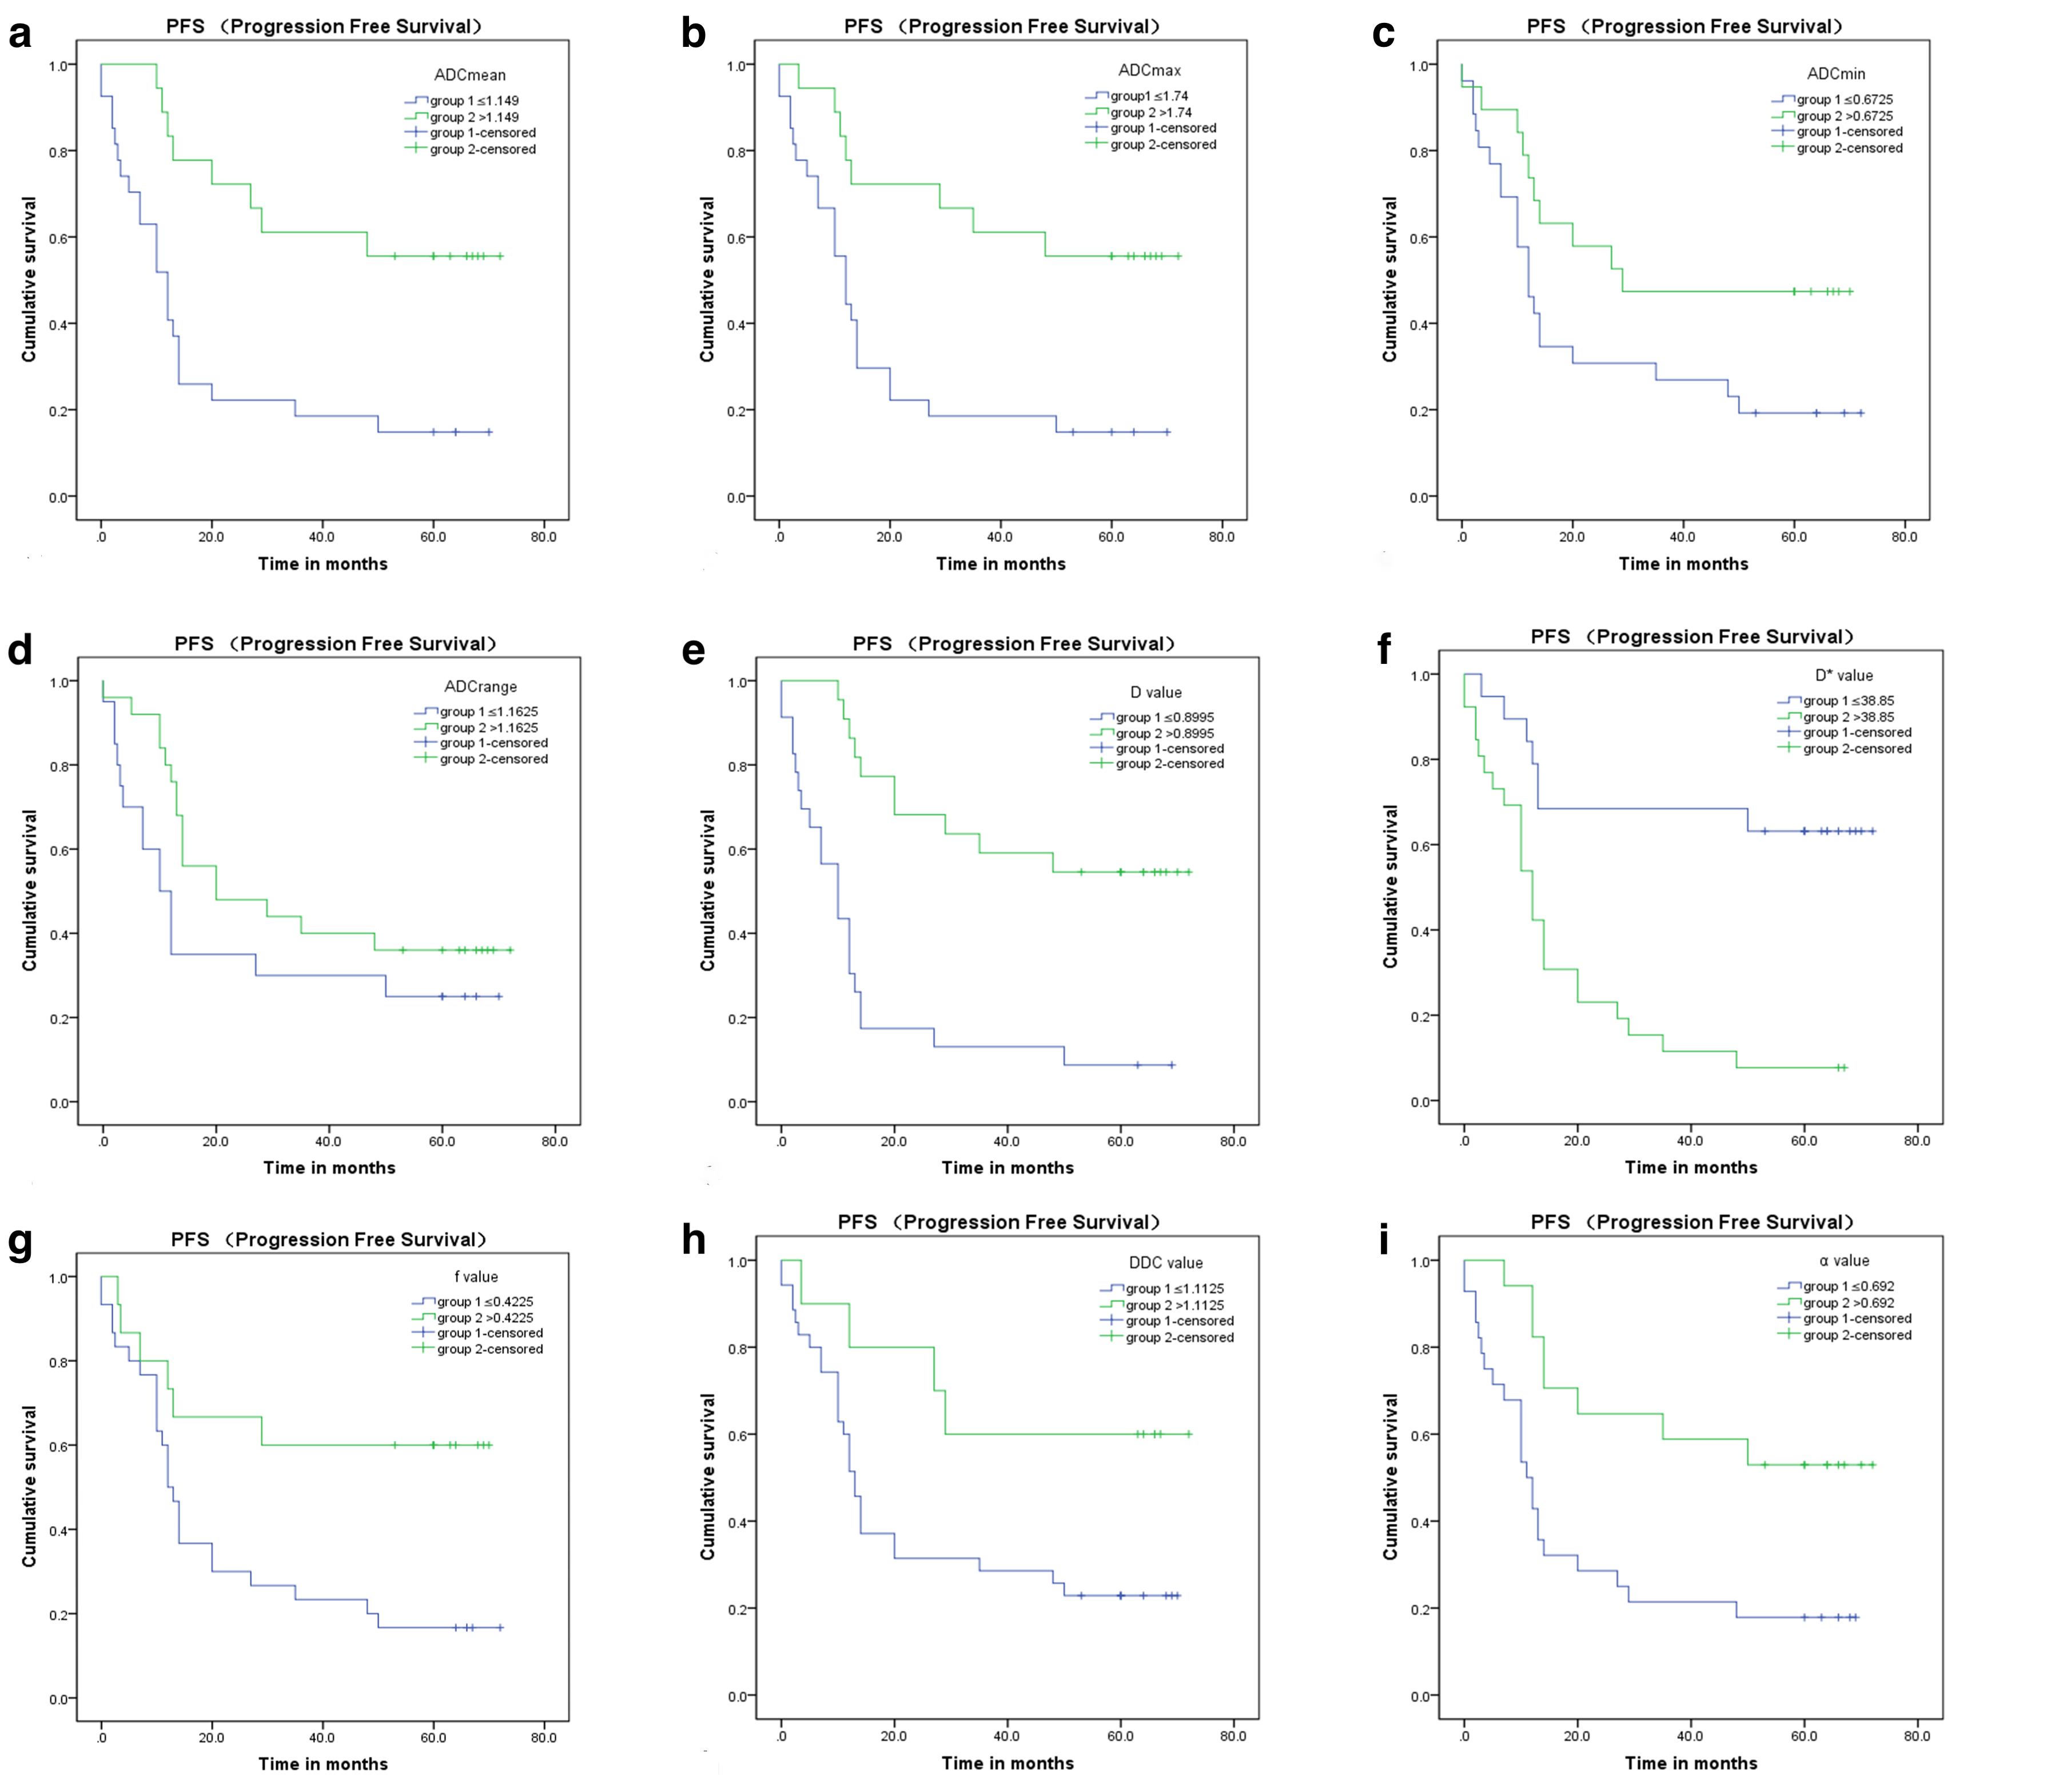
Followed up for 2-72 months with median follow-up of 14 months, 31 cases were assigned in the treatment failure group, 14 cases were local control group. Significantly lower ADCmean, ADCmax, ADCmin, D, f and higher D* were presented in the treatment failure group than local control group (p < 0.05) (Table 1). D* got the greatest AUC of 0.802, with the sensitivity and specificity 77.4%, 85.7% when D* was 38.85×10⁻³ mm2/s (Table 2). The survival curve of ADCmean, ADCmax, ADCmin, D, D*, f, DDC, and α values were found significant (Figure 3). Cox regression analysis showed ADCmean and D* were correlated with progression-free survival (PFS) (HR = 0.160, p = 0.001; HR = 1.008, p = 0.004, respectively).Discussion and Conclusion
In our study, we found that patients in the treatment failure group showed significantly lower ADCmean, ADCmax, ADCmin, D, f values and higher D* value than those in local control group. ADCmean and D* value were significantly correlated with PFS. In addition, to our knowledge, this is the first study that shows that the predictive efficiency of IVIM-DWI parameters estimated by mono-exponential model and bi-exponential model were better than that by stretched exponential model in terms of long-term prognosis prediction. The pretreatment ADC by mono-exponential model, and D, f value and D* value by bi-exponential model were significantly correlated with prognosis of local disease, and the pretreatment ADC, D* value were independent biomarkers for survival risk prediction.Acknowledgements
This work was supported by the Department of Radiology, National Cancer Center/National Clinical Research Center for Cancer/Cancer Hospital, Chinese Academy of Medical Sciences and Peking Union Medical College. And thank Dr. Xiaoduo Yu for her guidance in my research.
References
1. Pfister DG, Spencer S, Adelstein D, et al. Head and Neck Cancers, Version 2.2020, NCCN Clinical Practice Guidelines in Oncology. J Natl Compr Canc Netw. 2020;18(7):873-898.
2. Grover S, Swisher-McClure S, Mitra N, et al. Total Laryngectomy Versus Larynx Preservation for T4a Larynx Cancer: Patterns of Care and Survival Outcomes. Int J Radiat Oncol Biol Phys. 2015;92(3):594-601.
3. Semrau S, Schmidt D, Lell M, et al. Results of chemoselection with short induction chemotherapy followed by chemoradiation or surgery in the treatment of functionally inoperable carcinomas of the pharynx and larynx. Oral Oncol. 2013;49(5):454-460.
Figures