2892
Image quality in MY-RADS whole-body MRI protocols applied in a prospective multi-centre multiple myeloma study1Royal Marsden Hospital & Institute of Cancer Research, Sutton, United Kingdom, 2Southampton General Hospital, Southampton, United Kingdom, 3Leicester Royal Infirmary, Leicester, United Kingdom, 4Royal Stoke University Hospital, Stoke-on-Trent, United Kingdom, 5Derriford Hospital, Plymouth, United Kingdom, 6Norfolk & Norwich University Hospital, Norwich, United Kingdom, 7Epsom & St. Helier University Hospital, Epsom, United Kingdom, 8Spire St. Anthony's Hospital, Sutton, United Kingdom, 9Worcestershire Royal Hospital, Worcester, United Kingdom, 10Basingstoke & North Hampshire Hospital, Basingstoke, United Kingdom, 11North Bristol NHS Trust, Bristol, United Kingdom, 12Nottingham University Hospitals, Nottingham, United Kingdom, 13Royal Bournemouth & Christchurch Hospitals, Bournemouth, United Kingdom, 14University of Leeds, Leeds, United Kingdom
Synopsis
An assessment of image quality is presented from a multicentre WB-MRI study. A radiologist assessed image quality and the presence/severity of several common artefacts/image quality issues and metrics were also defined to measure these quantitatively. Image quality was consistently good or excellent, with only one DWI examination deemed non-diagnostic. In the case of most artefacts, the quantitative measurements were found to correlate with radiological assessment and a statistically significant ordinal regression model was found to predict DW image quality score using the quantitative measurements. These measurements could form part of an automated quality control pipeline for multi-centre WB-MRI studies.
Introduction
Whole body MRI (WB-MRI), comprising diffusion-weighted imaging (DWI), Dixon fat/water imaging, and sagittal T1/T2 weighted spine imaging, is the most sensitive imaging test for diagnosis and treatment response assessment in patients with multiple myeloma (MM).1 The MY-RADS standardised protocol for WB-MRI has been proposed2; however, quality of acquisition has not been tested prospectively in multi-centre clinical trials.MUKnine is a multicentre study to evaluate novel targeted treatment strategies for patients with high-risk MM.3 An exploratory sub-study of MUKnine is using WB-MRI to assess disease distribution at three time points before and during treatment.
The purpose of this work is to assess multi-centre WB-MR image quality, and compare the results of qualitative radiological assessment and quantitative semi-automated analysis.
Methods
Twelve UK centres participated in the MUKnine study. Data from the first five sites (alphabetically) are included in this analysis (37 examinations from 29 individual patients). All sites were required to complete a qualification process prior to the commencement of the study (OPTIMUM/MUKnineb; ClinicalTrials.gov Identifier: NCT03188172). All sites in this analysis used Siemens scanners (one 3T and four 1.5T), although all three main manufacturers are represented in MUKnine.A radiologist with 3 years’ experience in reporting WB images scored the quality of the overall examination and of each set of images, using a Likert scale (1-4: excellent, good, suboptimal, non-diagnostic).
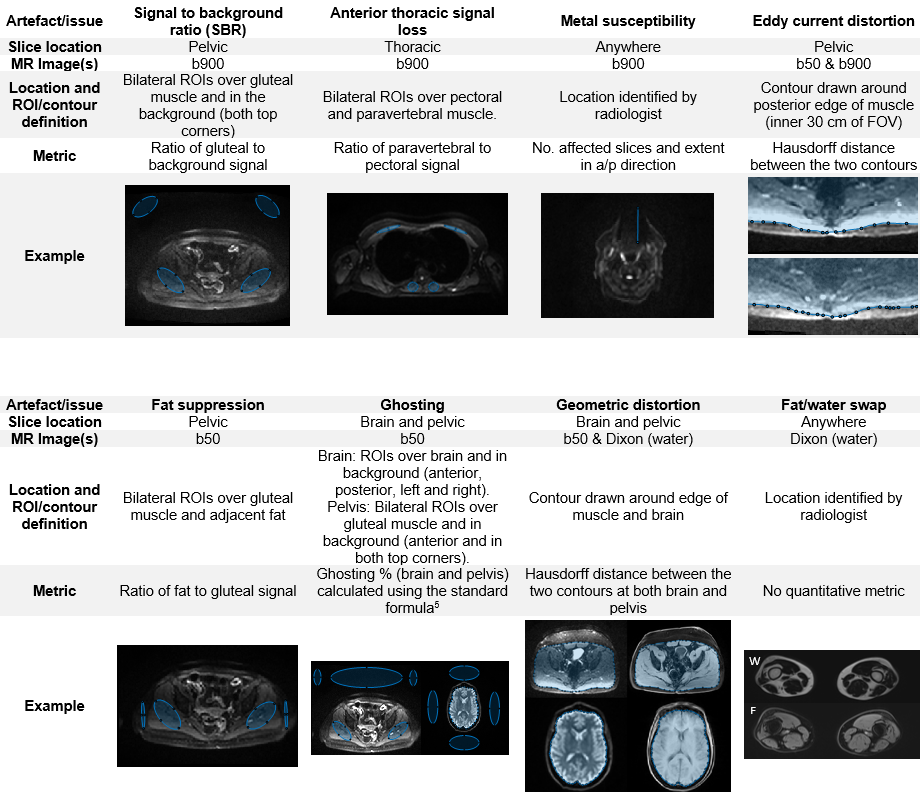
Figure 1 describes the artefacts and image quality issues that were identified as common challenges for WB-MRI protocols4, and the semi-automated measurements that were developed to quantify them. A radiologist graded the severity of each using a Likert scale (1-4: not present/no artefact, minimal, moderate, severe effect on diagnostic content). Measurements and statistical analysis were conducted in Matlab (R2019a, Mathworks, Natick, MA) and SPSS Statistics (v24, IBM, Armonk, NY) respectively.
Results
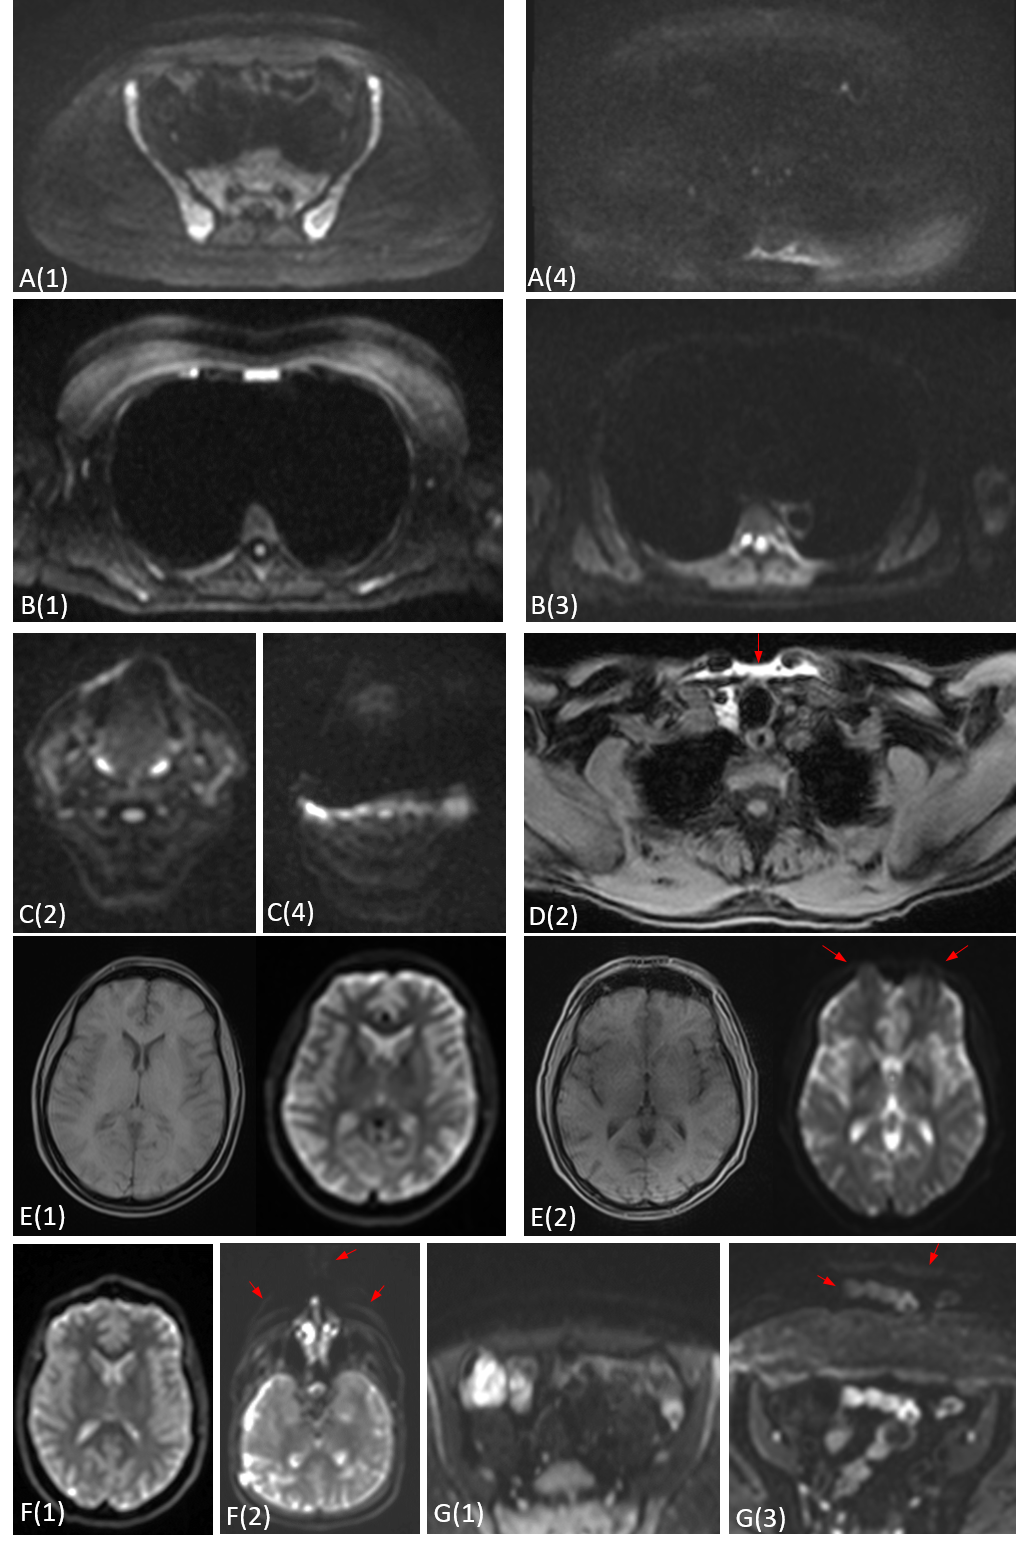
Figure 2 illustrates examples of different degrees of severity for each artefact.36/37 DWI datasets (97%) were of diagnostic quality, with 33 (89%) rated as good or excellent. 36/36 Dixon datasets (100%) and 37/37 spine datasets (100%) were rated as good or excellent. Radiological image quality scores are summarised in Figure 3.
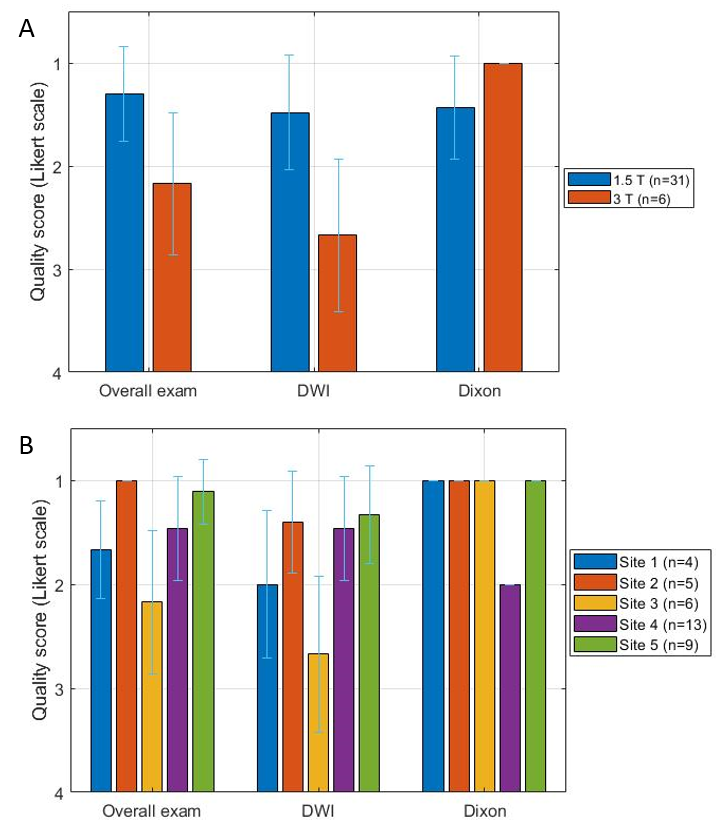
Figure 4 illustrates how the radiological quality scores varied with field strength and between sites.
A Mann-Whitney U test determined that the radiological quality scores at 1.5 T were significantly higher for overall exams (U=33.0, p=.005) and DWI (U=23.5, p=.002), and significantly lower for Dixon (U=51.0, p=.047).
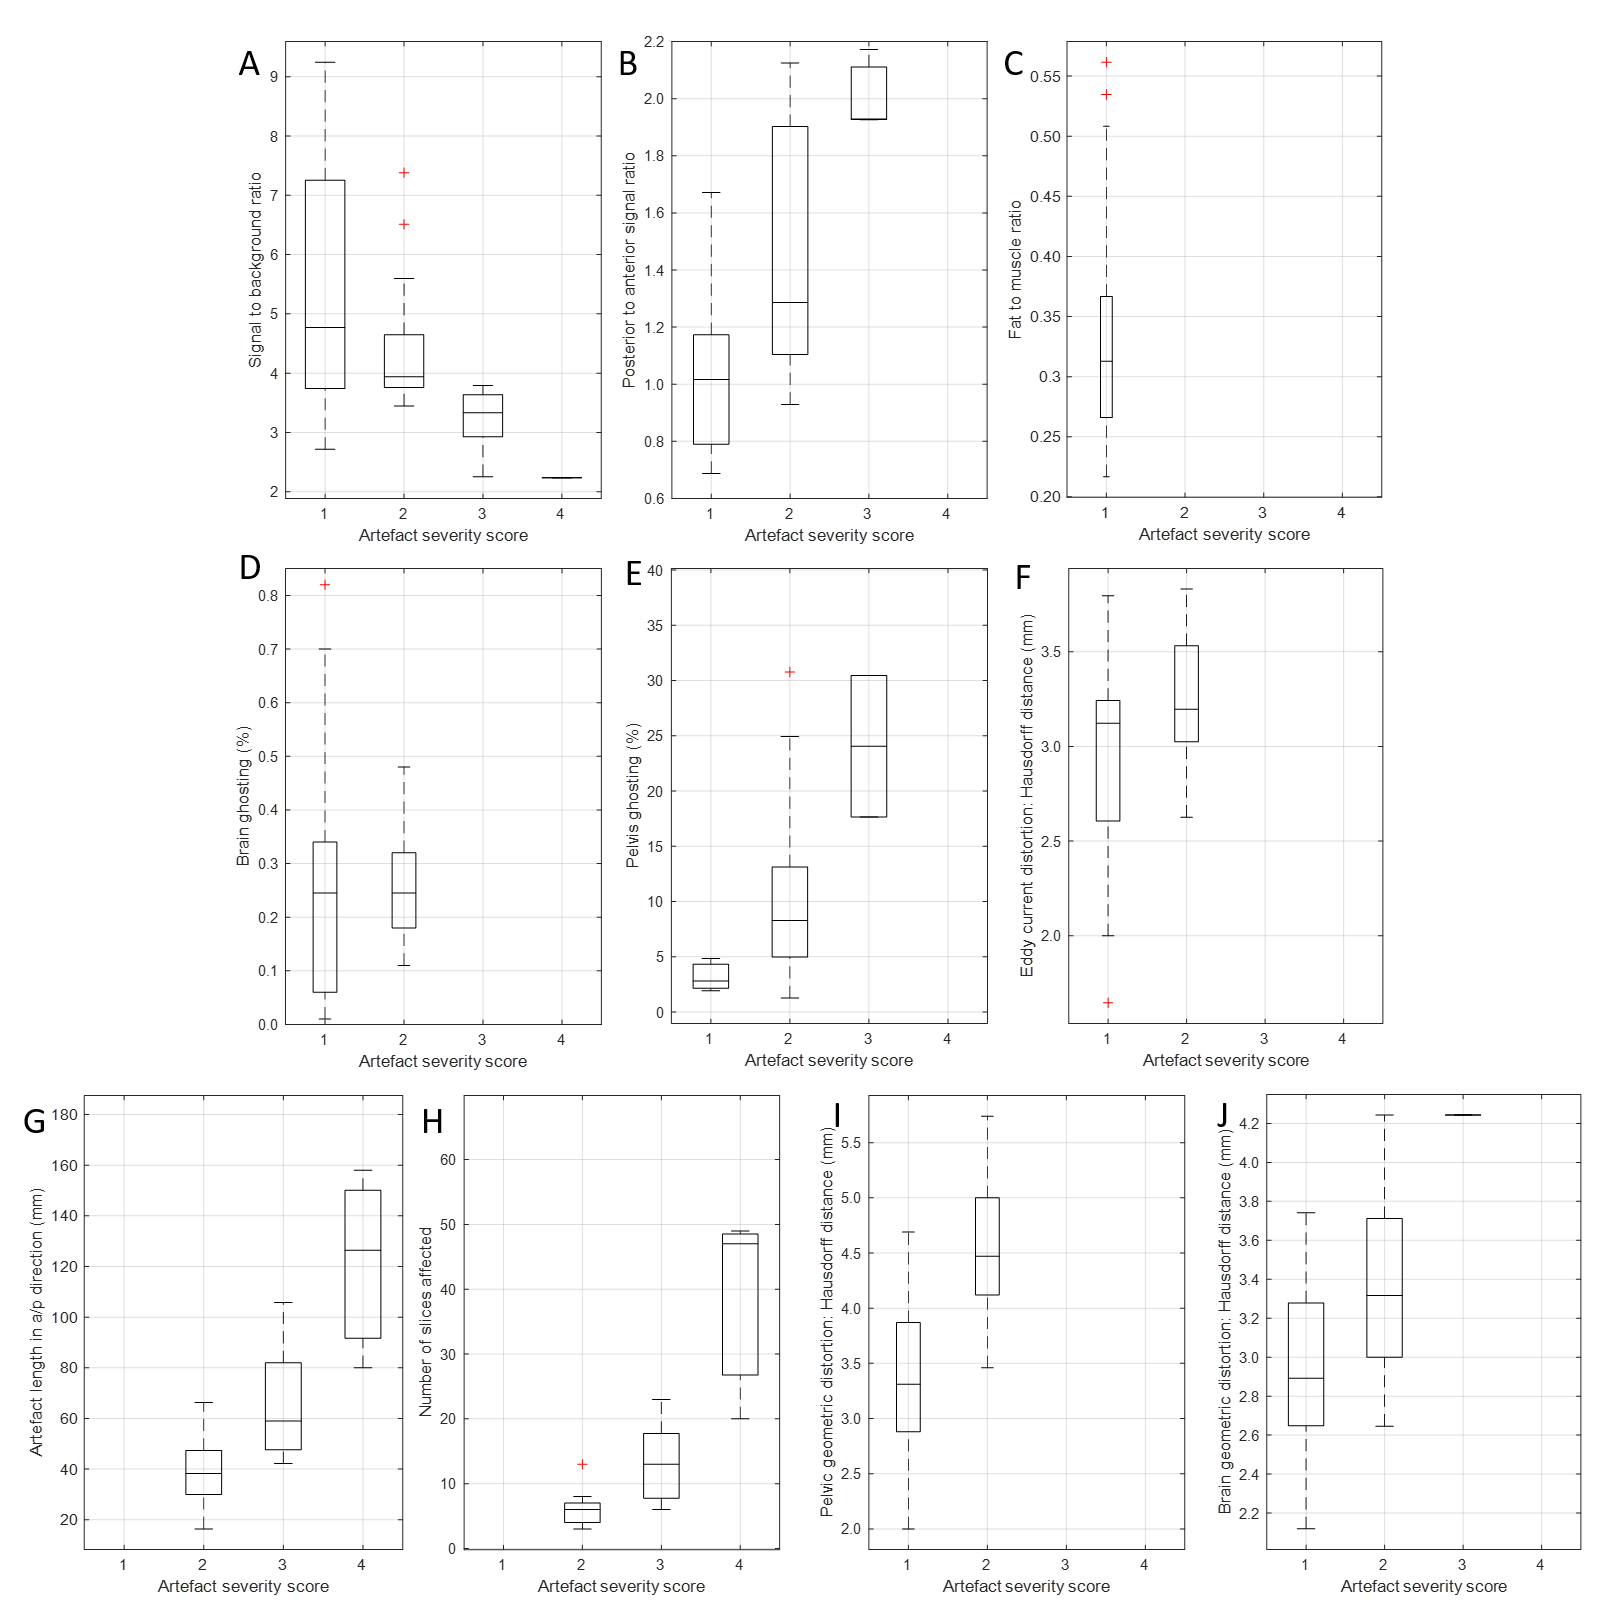
Figure 5 shows the distribution of quantitative values for each artefact, separated according to the radiological quality score.
One-way ANOVAs were used to assess differences in each quantitative metric between the radiological score groups. Statistically significant group differences were found for SBR (F36=3.46, p=.027), posterior/anterior signal ratio (F36=15.77, p<.001), pelvic ghosting (F36=6.57, p=.004), pelvic distortion (F35=22.79, p<.001), brain distortion (F34=6.91, p=.003), susceptibility artefact number of affected slices (F31=41.86, p<.001), and a/p length (F31=25.92, p<.001).
Between-group differences were not found to be statistically significant for eddy current distortion (F36=3.26, p=.080) and brain ghosting (F35=0.03, p=.858), where all studies were scored as 1 or 2. Fat suppression was not considered for this analysis as all studies scored 1.
A statistically significant ordinal logit regression model, including all the quantitative metrics, was found to predict DWI radiological quality score (X2(9)=18.79, p=.027). SBR was the only individual metric that was a statistically significant predictor of radiological score. An increase in SBR was associated with better DW image quality, with an odds ratio of 0.533 (95% CI: 0.290 to 0.980), Wald χ2(1) = 4.16, p = .041).
Discussion
Dixon and spine imaging was consistently excellent or good across all sites. DWI was diagnostic in 36/37 studies; only one DWI examination was rated as non-diagnostic, although the overall dataset for this patient retained diagnostic value. The quality of DWI examinations was significantly lower at 3 T than at 1.5 T, as reported previously.6Clinical outcome was not considered in this work; however, it is assumed that radiological image quality is closely associated with lesion detection. With the exception of two metrics, statistically significant correlations were found between the quantitative measures and the corresponding qualitative artefact scoring.
Artefacts generally had a minimal effect on diagnostic quality. For example, pelvic ghosting was reported in 34/37 patients; however, just 3 had a moderate effect on diagnostic quality (and none had a severe effect).
A limitation of this subcohort is that all sites used scanners from the same vendor, although the analysis will be extended to the whole cohort, which includes the three main scanner manufacturers.
The ordinal regression model suggests that the quantitative metrics could be used to predict the DWI radiological score. In these data, SBR appears to be the most significant factor affecting DW image quality.
The quantitative measurements described here could be automated as part of a quality control (QC) pipeline for ongoing monitoring of data quality in multicentre trials, with the potential to reduce the workload associated with radiological review.
This work has shown that consistent image quality can be achieved in a multi-centre WB-MRI study with an optimised protocol, although DWI remains challenging at 3 T. Semi-automated quantitative metrics have been developed that correlate with qualitative radiological assessment of artefacts and have the potential for use in automated QC.
Acknowledgements
We would like to acknowledge Janssen and Celgene for supporting the MUKnine OPTIMUM study. We also acknowledge funding from Cancer Research UK National Cancer Imaging Translational Accelerator (NCITA) and Engineering and Physical Sciences Research Council support to the Cancer Imaging Centre at the Institute of Cancer Research and Royal Marsden Hospital in association with the Medical Research Council and Department of Health C1060/A10334, C1060/A16464 and National Health Service funding to the National Institute for Health Research Biomedical Research Centre, Experimental Cancer Medicine Centre, the Clinical Research Facility in Imaging, and the Cancer Research Network. The views expressed in this publication are those of the author(s) and not necessarily those of the National Health Service, the National Institute for Health Research or the Department of Health.
References
- Pawlyn, C., Fowkes, L., Otero, S., Jones, J., et al., Whole-body diffusion-weighted MRI: a new gold standard for assessing disease burden in patients with multiple myeloma? Leukemia, 2016. 30(6): p. 1446-1448.
- Messiou, C., Hillengass, J., Delorme, S., Lecouvet, F.E., et al., Guidelines for acquisition, interpretation, and reporting of whole-body MRI in myeloma: myeloma response assessment and diagnosis system (MY-RADS). Radiology, 2019. 291(1): p. 5-13.
- Brown, S., Sherratt, D., Hinsley, S., Flanagan, L., et al., MUKnine OPTIMUM protocol: a screening study to identify high-risk patients with multiple myeloma suitable for novel treatment approaches combined with a phase II study evaluating optimised combination of biological therapy in newly diagnosed high-risk multiple myeloma and plasma cell leukaemia. BMJ open, 2021. 11(3): p. e046225.
- Koh, D.-M., Blackledge, M., Padhani, A.R., Takahara, T., et al., Whole-body diffusion-weighted MRI: tips, tricks, and pitfalls. American Journal of Roentgenology, 2012. 199(2): p. 252-262.
- Nicholas, S., Signal Parameters, in Quality Control and Artefacts in Magnetic Resonance Imaging IPEM report 112., McRobbie, D.W., Editor. 2016, Institute of Physics and Engineering in Medicine: York.
- Lavdas, I., Miquel, M.E., McRobbie, D.W., and Aboagye, E.O., Comparison between diffusion‐weighted MRI (DW‐MRI) at 1.5 and 3 tesla: A phantom study. Journal of Magnetic Resonance Imaging, 2014. 40(3): p. 682-690.
Figures
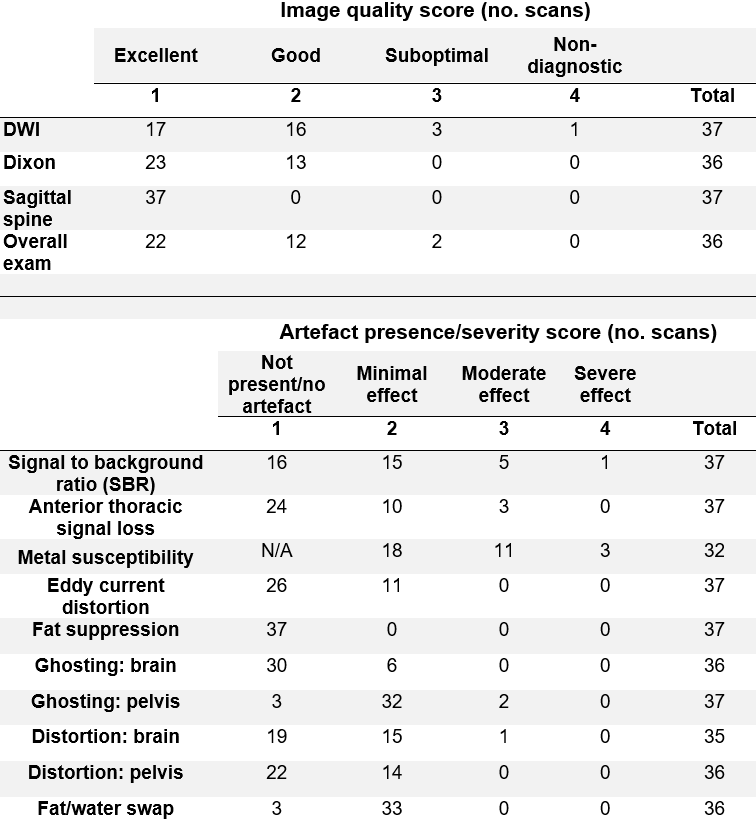
3 - Number of instances of each image quality score and each artefact presence/severity score. One exam did not include Dixon imaging and the head was not imaged for one patient due to kyphosis. Note metal susceptibility artefacts are scored per artefact and not per subject. A score of 1 is therefore not possible for this artefact.