2891
Noninvasive Detection and Assessment of Treatment Response in Multiple Myeloma using Whole-body DETECT: Preliminary Findings1Radiology, UT Southwestern Medical Center, Dallas, TX, United States, 2Nuclear Medicine, UT Southwestern Medical Center, Dallas, TX, United States, 3Advanced Imaging Research Center, UT Southwestern Medical Center, Dallas, TX, United States, 4Internal Medicine, UT Southwestern Medical Center, Dallas, TX, United States
Synopsis
We present the preliminary findings on the ability of our novel whole-body MRI using Dual-Echo T2-weighted acquisition for Enhanced Conspicuity of Tumors (WBMRI-DETECT) for detection and longitudinal assessment of therapy response in multiple myeloma (MM). Data from 4 MM patients undergoing induction therapy at 4 timepoints in an ongoing prospective research study are presented. Our results show that WBMRI-DETECT provides higher SNR, improved lesion conspicuity with shorter scan times compared to WBMRI-STIR and WBMRI-DWIBS, and minimal geometric distortions compared to WBMRI-DWIBS. In addition, quantitative FF measurements from WBMRI can serve as a prognostic imaging biomarker for the treatment response assessment.
Introduction
Multiple myeloma (MM) is the second most common hematological malignancy and characterized by significant morbidity that lowers the patient’s quality of life1. Current recommendations from the International Myeloma Working Group (IMWG) single out whole-body MRI (WBMRI) as the preferred imaging modality for pretreatment assessment of MM2. However, long scan times clinically limit WBMRI to the spine and pelvis for MM. [18F] fluorodeoxyglucose positron emission tomography (FDG-PET) is also used for MM therapy response assessment, but it is only recommended when WBMRI is unavailable during pre-treatment imaging3.WBMRI using diffusion weighted imaging (DWI) demonstrates high lesion contrast and treatment response assessment in MM4, however, it suffers from geometric distortions that inhibit localization of lesions and prolonged acquisition times.
To address these shortcomings, we previously developed a novel dual-echo T2-weighted acquisition for enhanced conspicuity of tumors (DETECT) that suppresses confounding signal from fat and fluid while providing higher signal to noise ratio (SNR), faster scan times, and improved lesion conspicuity compared to WBMRI-DWI without geometric distortions5. Here, we present preliminary findings from our prospective research study evaluating the use of DETECT in identification of MM tumors pre-treatment, and longitudinal tumor monitoring post-treatment.
Theory
DETECT utilizes a T2-weighted single-shot turbo spin echo (SShTSE) acquisition with a 2-point Dixon reconstruction5 at two echo times (TE). The Dixon reconstruction provides fat-suppressed water-only images and enables fat fraction (FF) quantification. Two TEs provide fluid suppression using the difference in T2 signal decay between fluid and tissue MR signal5.Methods
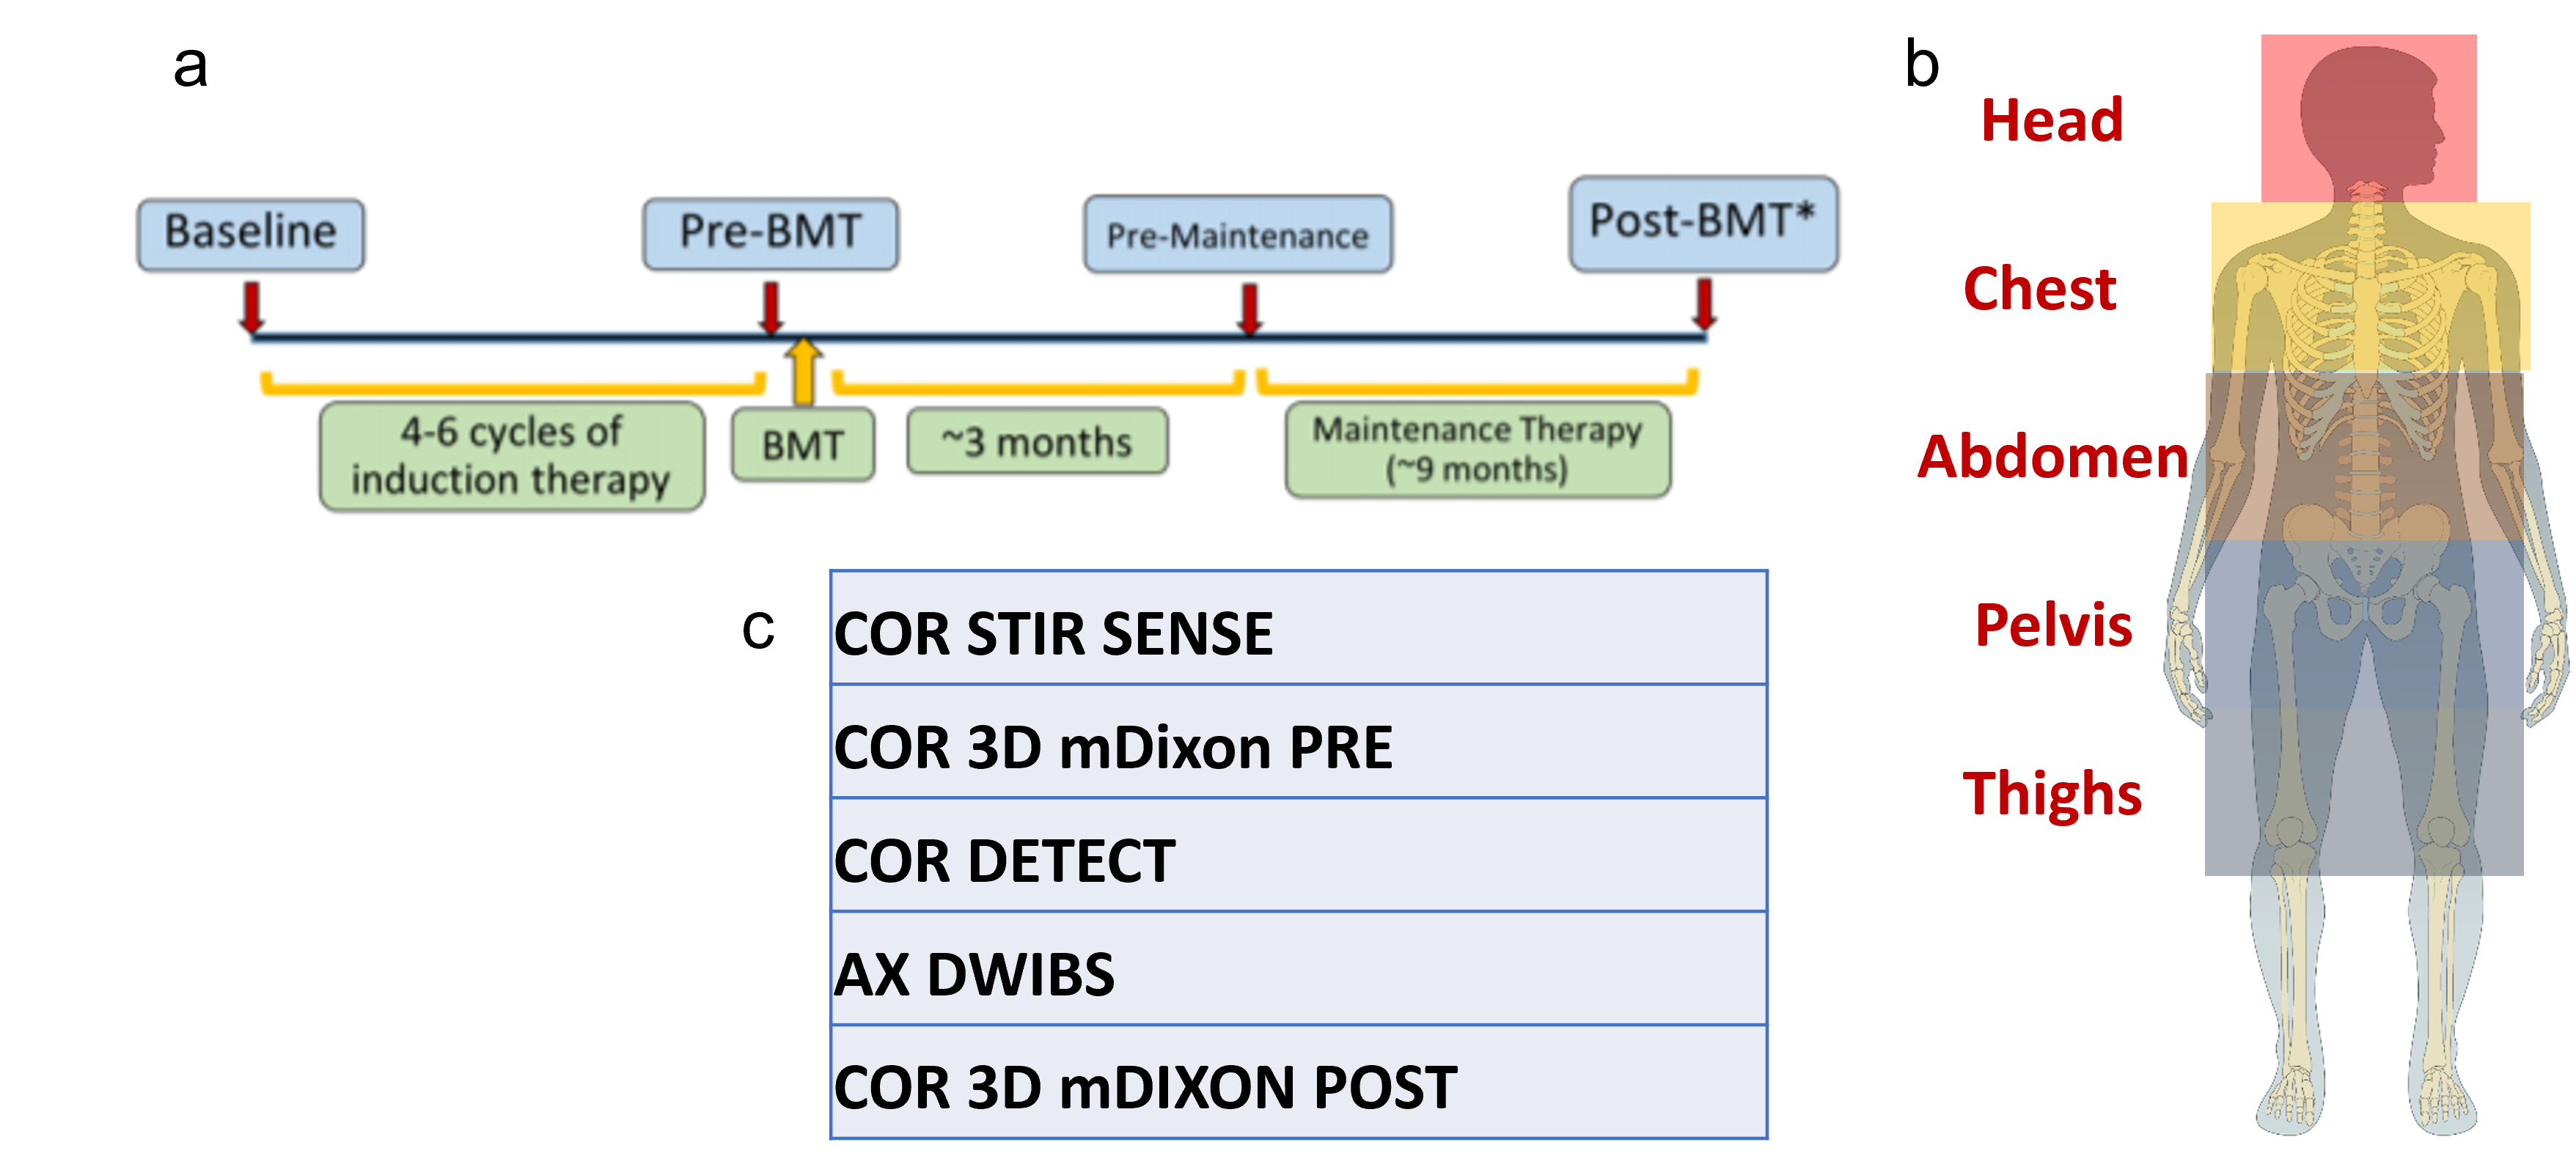
Patients: Adult patients with confirmed MM prior to starting induction therapy and not contraindicated for FDG-PET or MR were recruited for our ongoing prospective research study. Patients were imaged using WBMRI and FDG-PET/CT at four timepoints (Fig. 1a) throughout their treatment plan.Imaging Sessions: All WBMRI were performed on a 3T Ingenia scanner (Philips Healthcare). Each WBMRI session was scanned at five anatomical stations (Fig. 1b) using the following sequences: coronal STIR, coronal and axial DETECT, axial DWI with background suppression (DWIBS), and coronal pre- and post-contrast 3D T1-mDixon with Sensitivity Encoding (SENSE). Approximately 12-18 mL of gadolinium-based contrast agent (Gadovist®, 0.1 mmol/kg) was injected intravenously prior to the post-contrast 3D T1-mDixon acquisitions. The imaging parameters are as follows: DETECT: TR/TE1/TE2: 1200/80/340 ms, ΔTE=1.1 ms, Head FOV = 300x300x245 mm3, Body FOV = 350x400x245 mm3, acquired resolution = 1.5x2x5 mm3, 49 slices for head station, 60 slices for body stations, total whole body acquisition time = 7:00 min; STIR: TR/TI/TE: 5000/230/40 ms, similar FOV and slices per station as DETECT, acquired resolution = 1.5x2.2x5 mm3, total whole body acquisition time = 17:43 min; DWIBS: TR/TI/TE: 5000/220/70 ms, similar FOV and slices per station as DETECT, b = 0/800 s/mm², acquired resolution = 3x3x5 mm2, total whole body acquisition time = 18:40 min; pre- and post-contrast T1 3D FFE mDixon; TR/TE1/TE2: 3.8/1.6/2.6 ms, similar FOV and slices to other scans, acquired resolution = 2x2x5 mm2, total whole body acquisition time = 1:05 min. FDG-PET/CT imaging was performed within 24 hours of each WBMRI session.
Image Analysis: A radiologist (A.D.) with 11 years of experience identified lesions at the first timepoint (T0) for four patients using WBMRI images, and evaluated the lesions at the second timepoint (T1) for the first patient. FF maps were calculated using the 3D T1-mDixon fat/water separated images due to artifacts from a software update present on DETECT images. These artifacts are currently being resolved. These FF maps were calculated after processing the water-only and fat-only images through a “dark-fat” algorithm6 to reduce residual multi-peak fat spectra signal in the water-only image. Apparent diffusion coefficient (ADC) maps were calculated using b = 0 s/mm² and b = 800 s/mm² images from DWIBS. The change in FF and ADC values for identified lesions at T0 and T1 were analyzed using a paired t-test. Correlation between FF and ADC in lesions at T0 was measured using simple linear regression.
Results
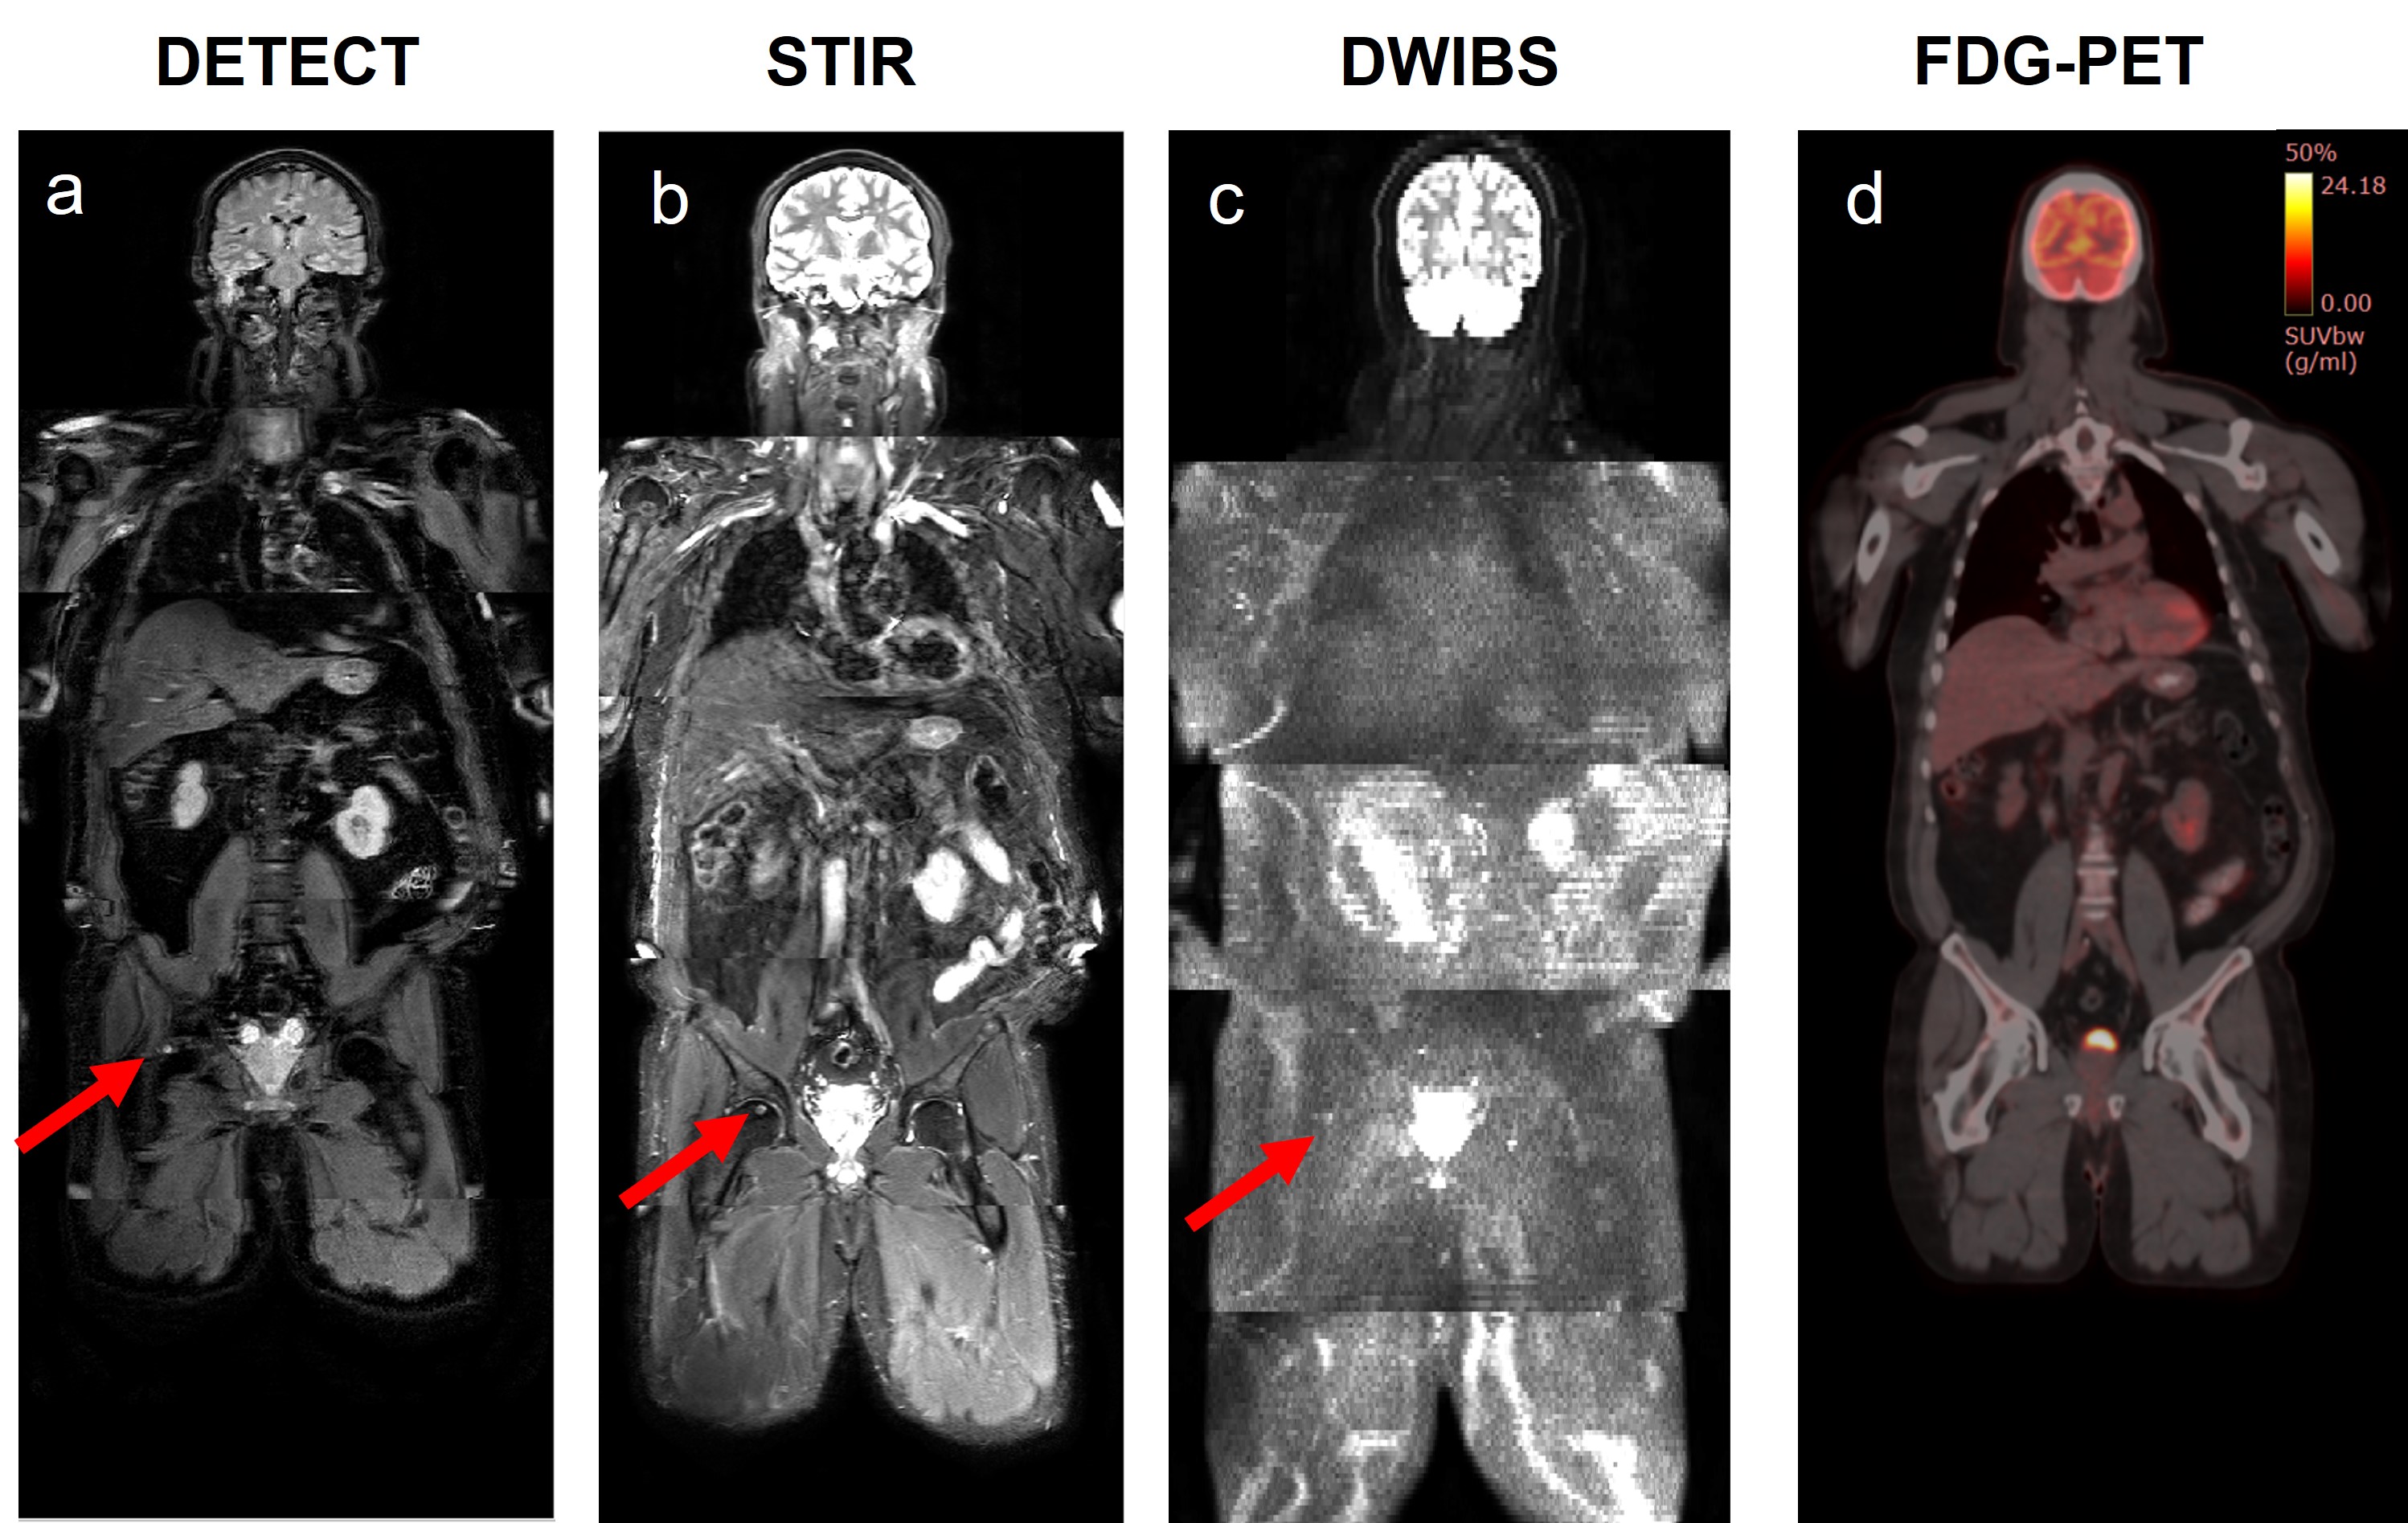
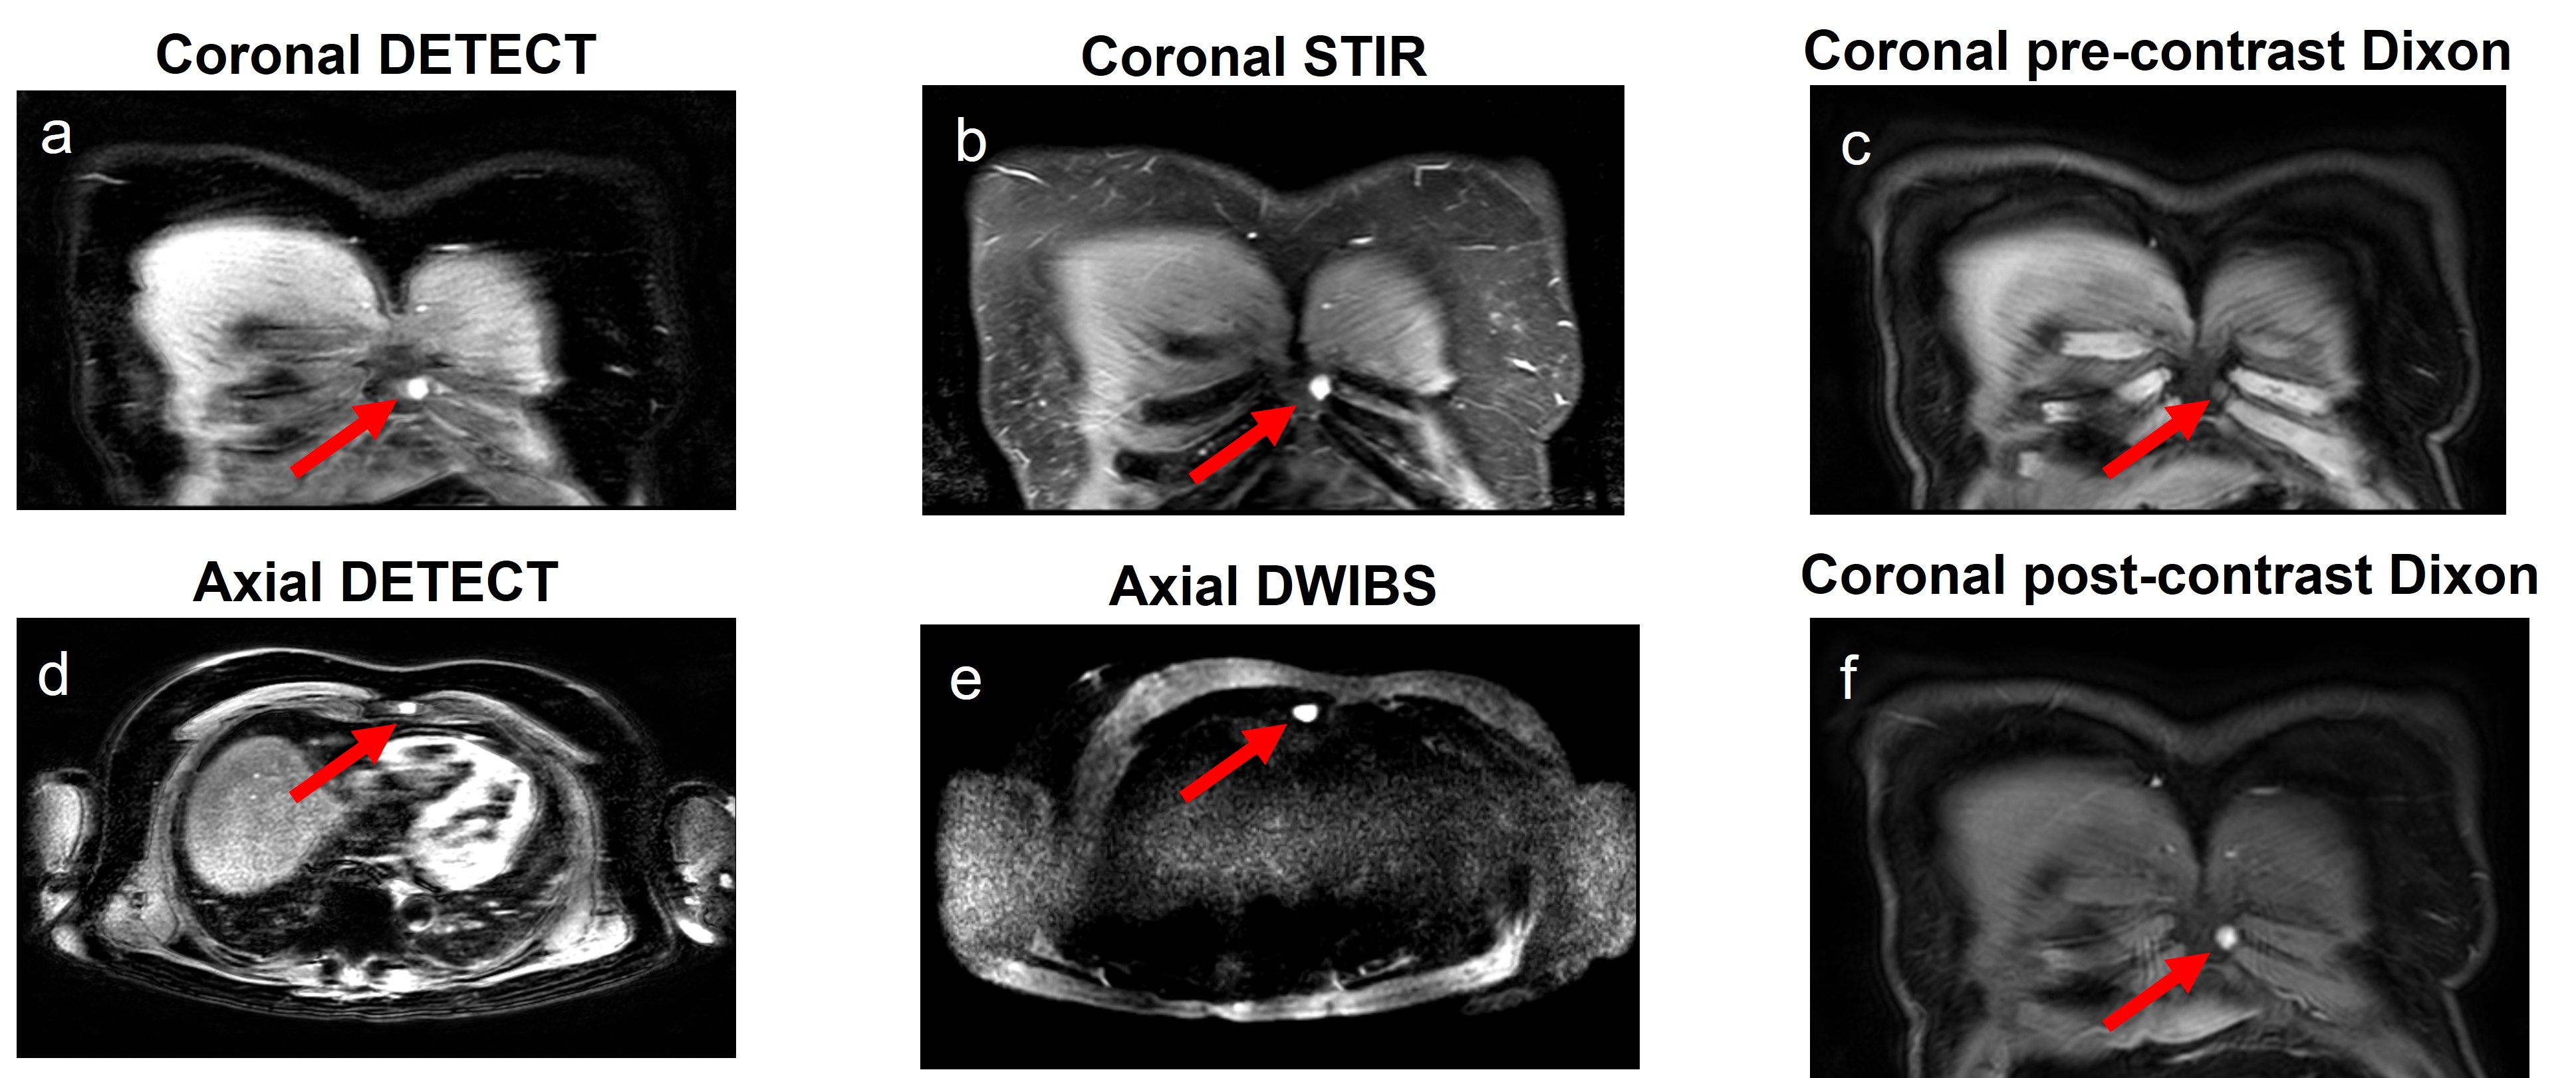
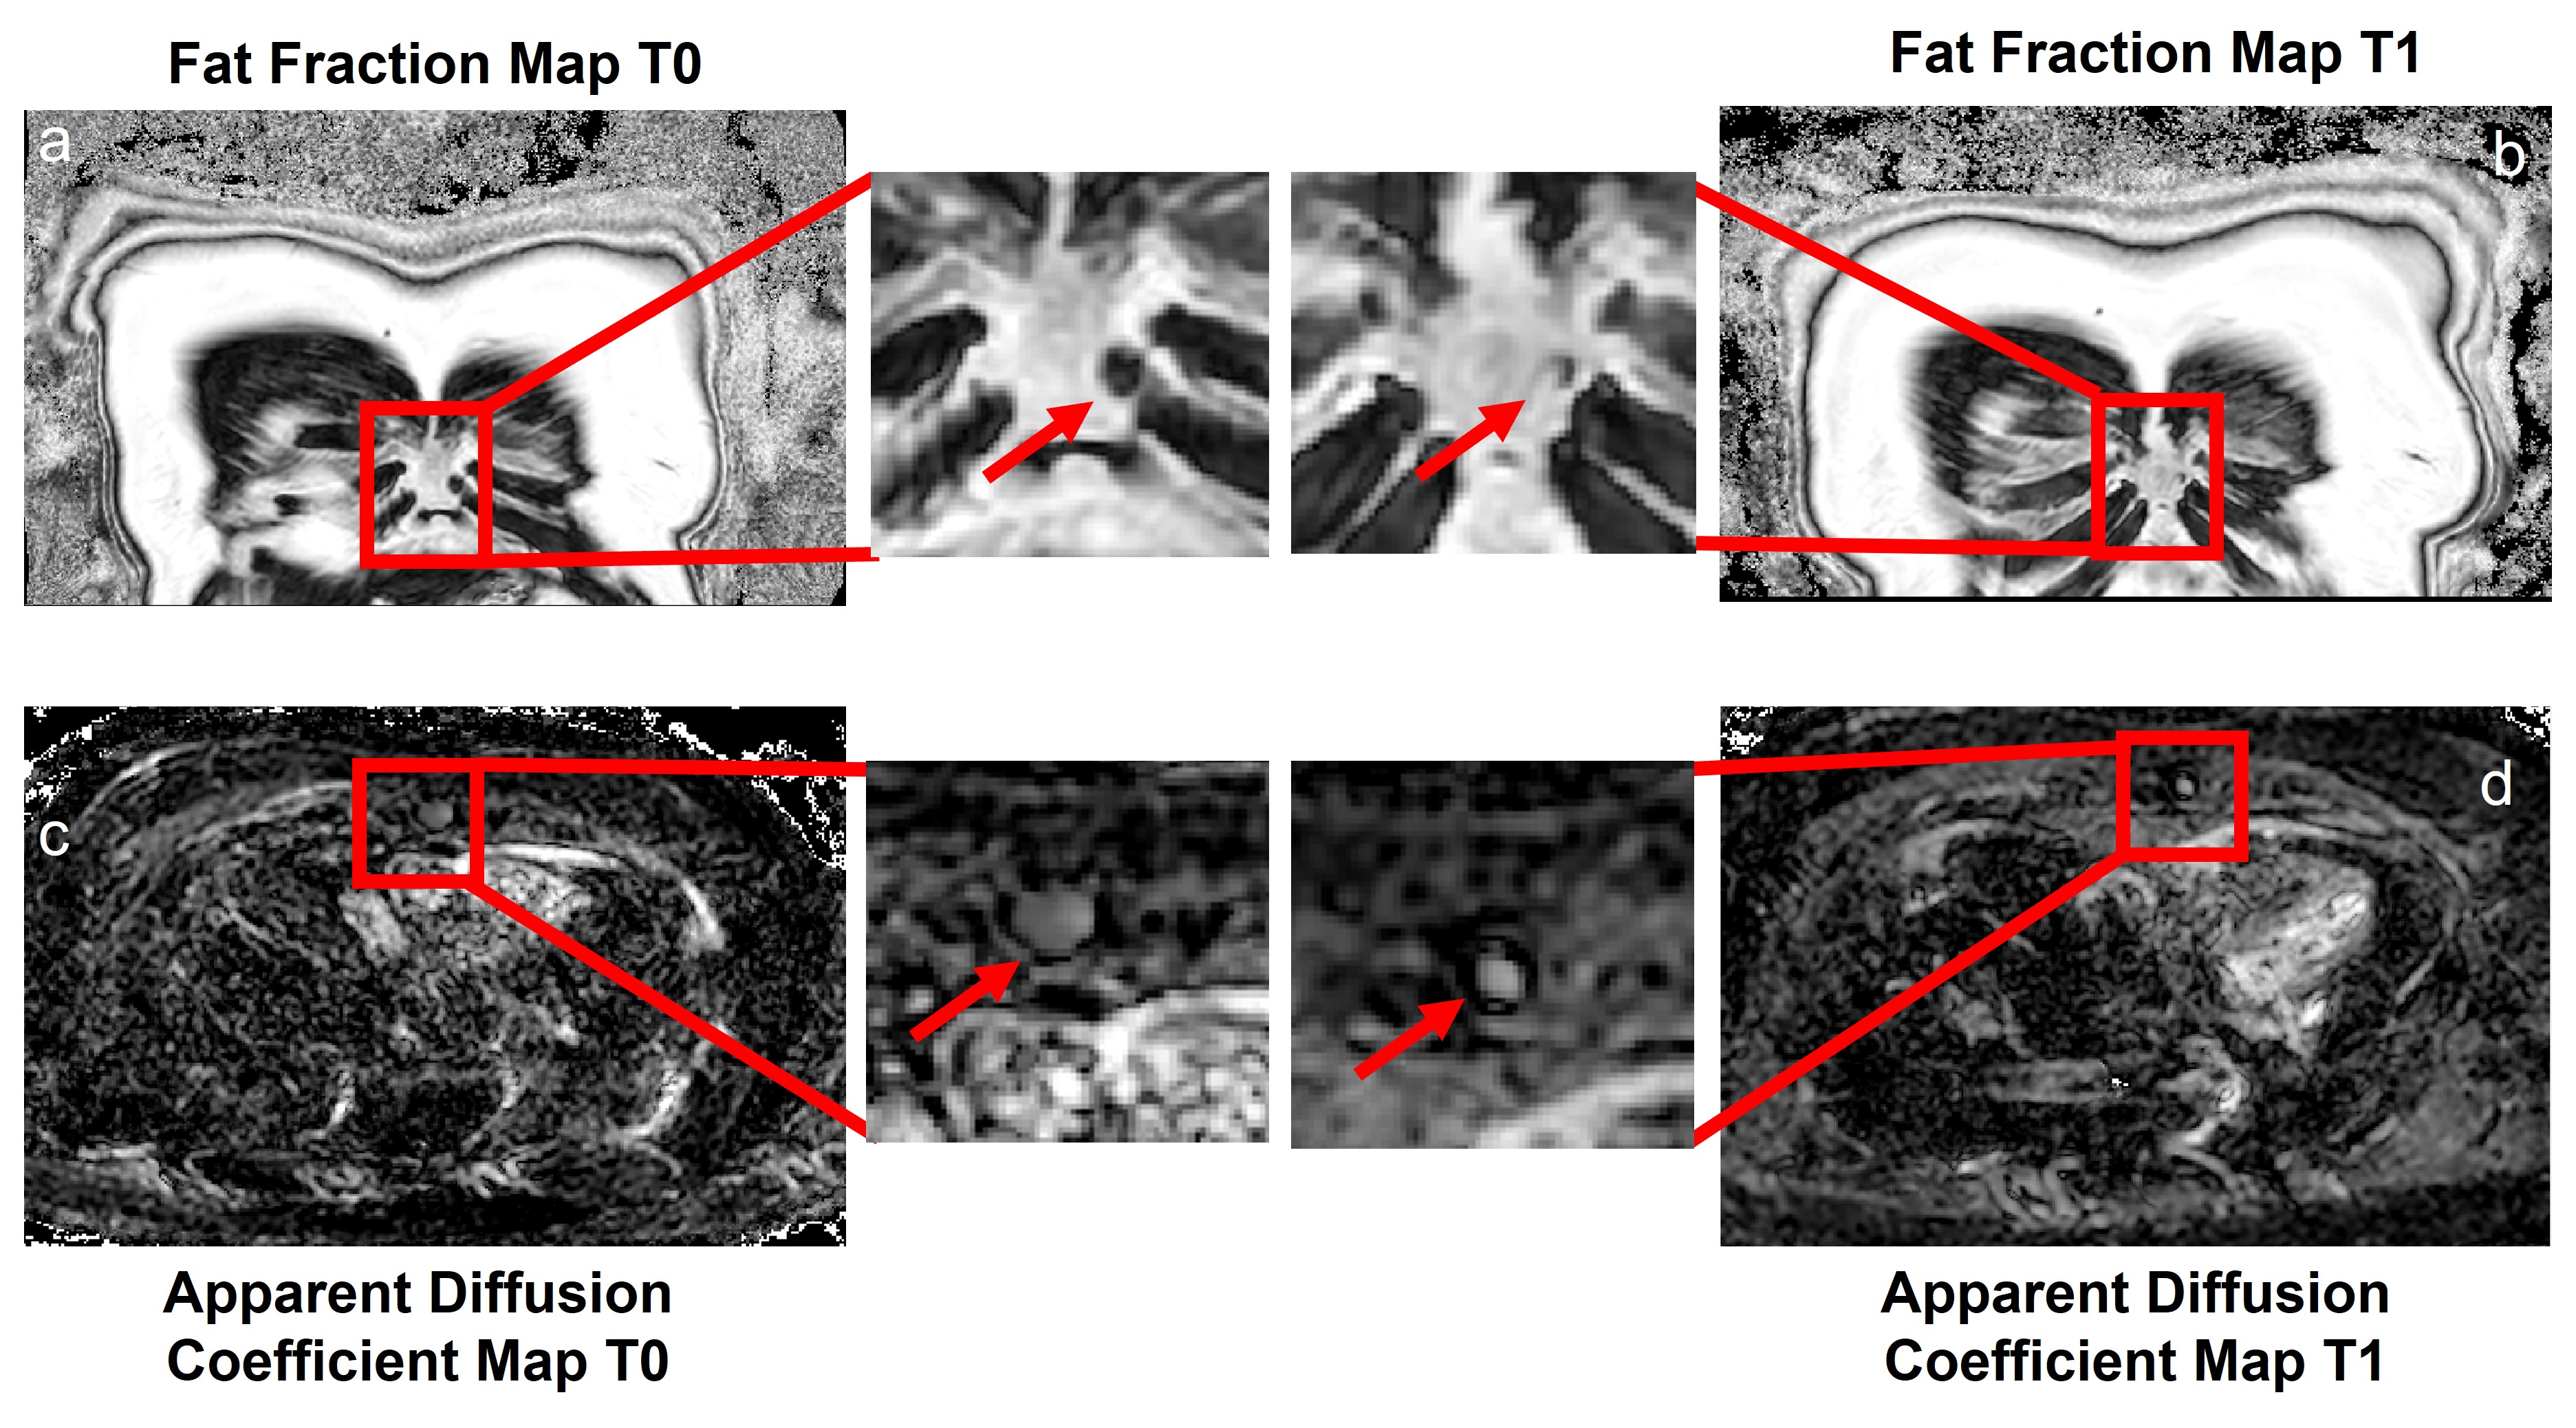
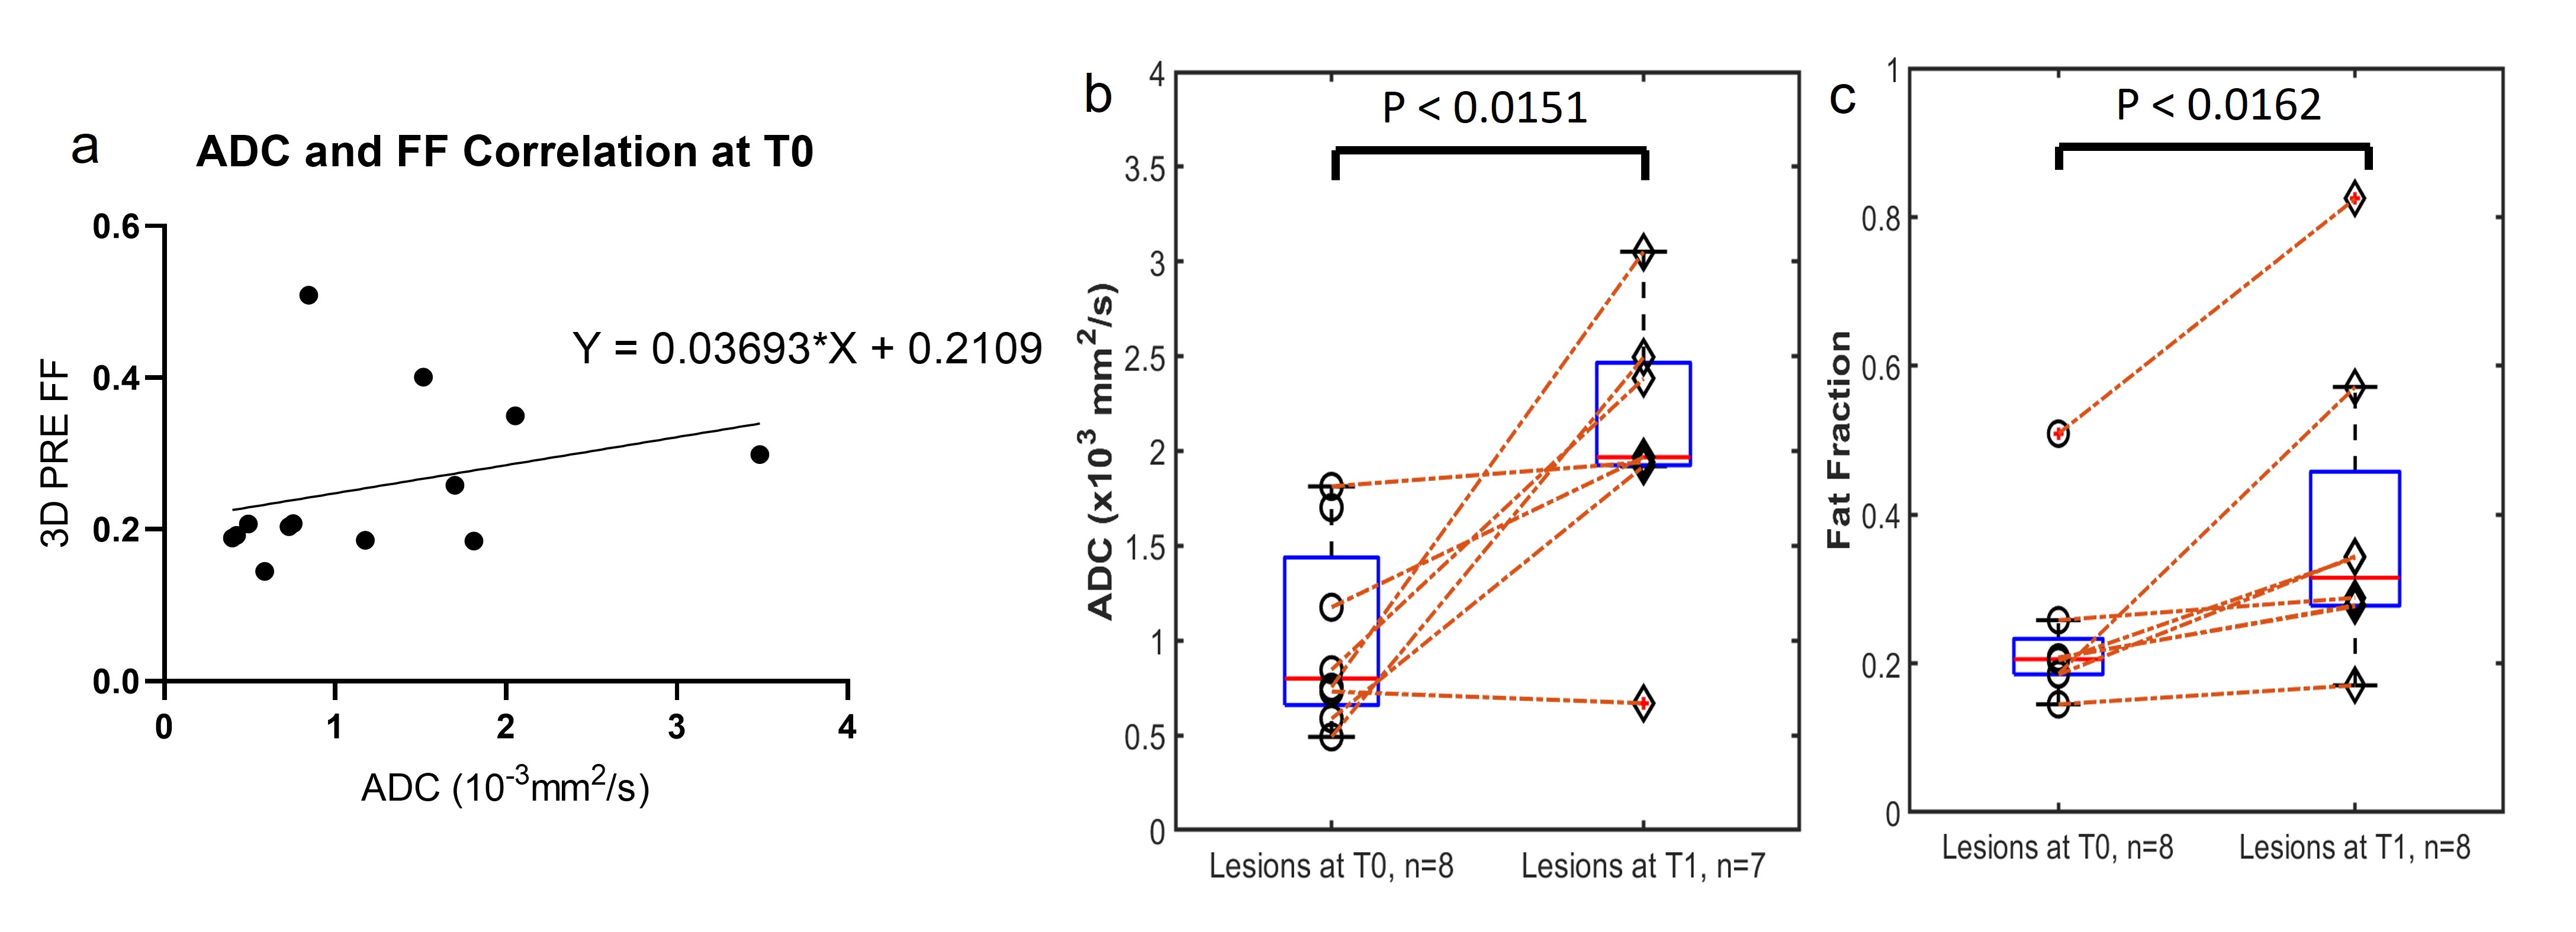
Currently, four patients have been imaged at T0, three at T1, and one at the third timepoint (T2). WBMRI-DETECT has better lesion conspicuity than STIR and DWIBS and significantly less geometric distortions than DWIBS (Fig. 2), while also requiring shorter scan times. Thirteen lesions were identified through WBMRI across all four patients. Representative images of one lesion identified on all WBMRI scans is shown in Fig. 3, with DETECT showing high lesion conspicuity and excellent localization. FF and ADC maps from T0 and T1 of the same lesion (Fig. 4) show a decrease in size and an increase in FF and ADC values. Linear regression of ADC and FF values of thirteen lesions show a slight positive correlation (Fig. 5a), while paired t-tests show significance for ADC (p<0.02) and FF (p<0.02) between T0 and T1 (Fig. 5b-c).Discussion and Conclusion
Our preliminary results from this ongoing study have shown that WBMRI-DETECT provides higher SNR, improved lesion conspicuity in shorter scan times compared to WBMRI-STIR and WBMRI-DWIBS, and minimal geometric distortions compared to WBMRI-DWIBS. In addition, quantitative FF measurements from WBMRI can serve as a prognostic imaging biomarker for the assessment of treatment response in multiple myeloma.Acknowledgements
This work was partly supported by the Cancer Prevention and Research Institute of Texas (CPRIT) grant RP190049.References
1. Rajkumar, S. V. & Kumar, S. Multiple Myeloma: Diagnosis and Treatment. Mayo Clin Proc 91, 101-119, doi:10.1016/j.mayocp.2015.11.007 (2016).
2. Rajkumar, S. V. et al. International Myeloma Working Group updated criteria for the diagnosis of multiple myeloma. Lancet Oncol 15, e538-548, doi:10.1016/S1470-2045(14)70442-5 (2014).
3. Cavo, M. et al. Role of (18)F-FDG PET/CT in the diagnosis and management of multiple myeloma and other plasma cell disorders: a consensus statement by the International Myeloma Working Group. Lancet Oncol 18, e206-e217, doi:10.1016/S1470-2045(17)30189-4 (2017).
4. Lacognata, C. et al. Diffusion-weighted whole-body MRI for evaluation of early response in multiple myeloma. Clin Radiol 72, 850-857, doi:10.1016/j.crad.2017.05.004 (2017).
5. Wang, X. et al. Whole-body MRI for metastatic cancer detection using T2 -weighted imaging with fat and fluid suppression. Magn Reson Med 80, 1402-1415, doi:10.1002/mrm.27117 (2018).
6. Madhuranthakam AJ, Y. H., Alsop DC. System and method for fat suppression in chemical shift based water-fat separated MR imaging. USA patent (2013).
Figures