2887
Assessment of Lumbar Nerve Root Changes in Disc Herniation Using Ultrashort Echo Time Magnetization Transfer (UTE-MT) Imaging1Department of Radiology, The Fifth Affiliated Hospital of Sun Yat-Sen University, Zhuhai, China, 2MR Research, GE Healthcare, Beijing, China, 3Department of Radiology, University of California San Diego, San Diego, CA, United States
Synopsis
Ultrashort echo time magnetization transfer (UTE-MT) imaging can quantify macromolecular content changes in tissues. This study aims to investigate the feasibility of UTE-MT ratio (UTE-MTR) in assessment of lumbar nerve root changes due to disc herniation. T2 mapping and diffusion tensor imaging (DTI) were also employed for comparison. Our results demonstrated that the UTE-MTR is able to detect nerve root changes due to disc herniation and it has a better performance than T2 mapping and DTI imaging in differentiation of disc herniation and non-disc herniation.
Introduction
Foraminal stenosis often causes nerve root entrapment in patients with lumbar disc herniation, which results in low back pain [1]. Ultrashort echo time magnetization transfer (UTE-MT) imaging can quantify macromolecular content changes in tissues [2]. This study aims to investigate the feasibility of UTE-MT ratio (UTE-MTR) in assessment of lumbar nerve root changes due to disc herniation. T2 mapping and diffusion tensor imaging (DTI) were also employed for comparison.Methods
A total of 75 patients with disc herniation (age 43 ± 16years, age range 35-78) were recruited and scanned with UTE-MT, DTI and CPMG sequences in examination of L4/5 and L5/S1 lumbar discs on a 3T MRI scanner (Signa, Pioneer, GE Healthcare). Informed consent was obtained from all participants in accordance with the Institutional Review Board. A Fermi pulse was employed to generate the MT contrast in UTE-MT sequence with duration of 8ms and bandwidth of 160Hz. The frequency offset of this MT pulse was 1500 Hz. The UTE-MT sequence was scanned twice with flip angle of 750° for MT-On and 0° for MT-Off. Other UTE-MT sequence parameters were as follows: TR = 100 ms, TE = 0.032 ms, excitation flip angle = 5°, number of spokes per-TR = 5, FOV = 28cm × 28cm, matrix = 140 × 140, slice thickness = 3.6mm, slice number = 16, bandwidth = 125 kHz, oversampling factor = 1.2, and scan time = 3min. The UTE-MTR is calculated by the signal ratio of the difference between UTE-MT-OFF and UTE-MT-ON to the UTE-MT-OFF. The DTI sequence parameters were as follows: TR = 6000ms, TE = 60ms, FOV = 42cm × 42cm, matrix = 140 × 140, slice thickness = 4mm, slice number = 18, bandwidth = 250 kHz, b-values of 0 and 800 in each of six diffusion gradient encoding directions, and scan time = 3 min. 2D CPMG sequence was used for T2 mapping with parameters as follows: TEs = 7, 14, 21, 28, 35, 42, 49, and 56 ms, TR = 1400 ms, FOV = 38cm × 38cm, matrix = 140 × 140, slice thickness = 4mm, slice number = 20, bandwidth = 250 kHz, and scan time = 5 min.Disc herniation was identified in consensus by two musculoskeletal radiologists with 6 and 8 years of experience. 82 herniated discs were found from a total of 150 discs. The region of interest (ROI) of the nerve roots was manually drawn by a radiologist with 11 years of experience. The student’s t-test was used to compare UTE-MTR, T2 and fractional anisotropy (FA) values in nerve roots between patients with and without disc herniation. Receiver operating characteristic (ROC) analysis and computed the area under the curve (AUC) with 95% CI was to evaluate the performances of the UTE-MT, T2 and DTI in discriminating between patients with and without disc herniation. A value of P < 0.05 was considered as a statistically significant.
Results
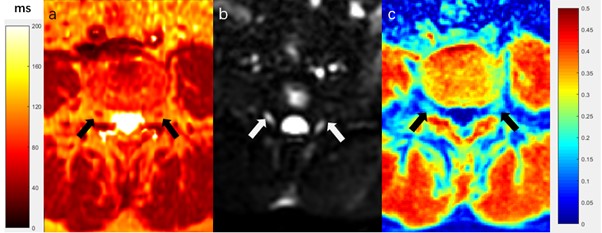
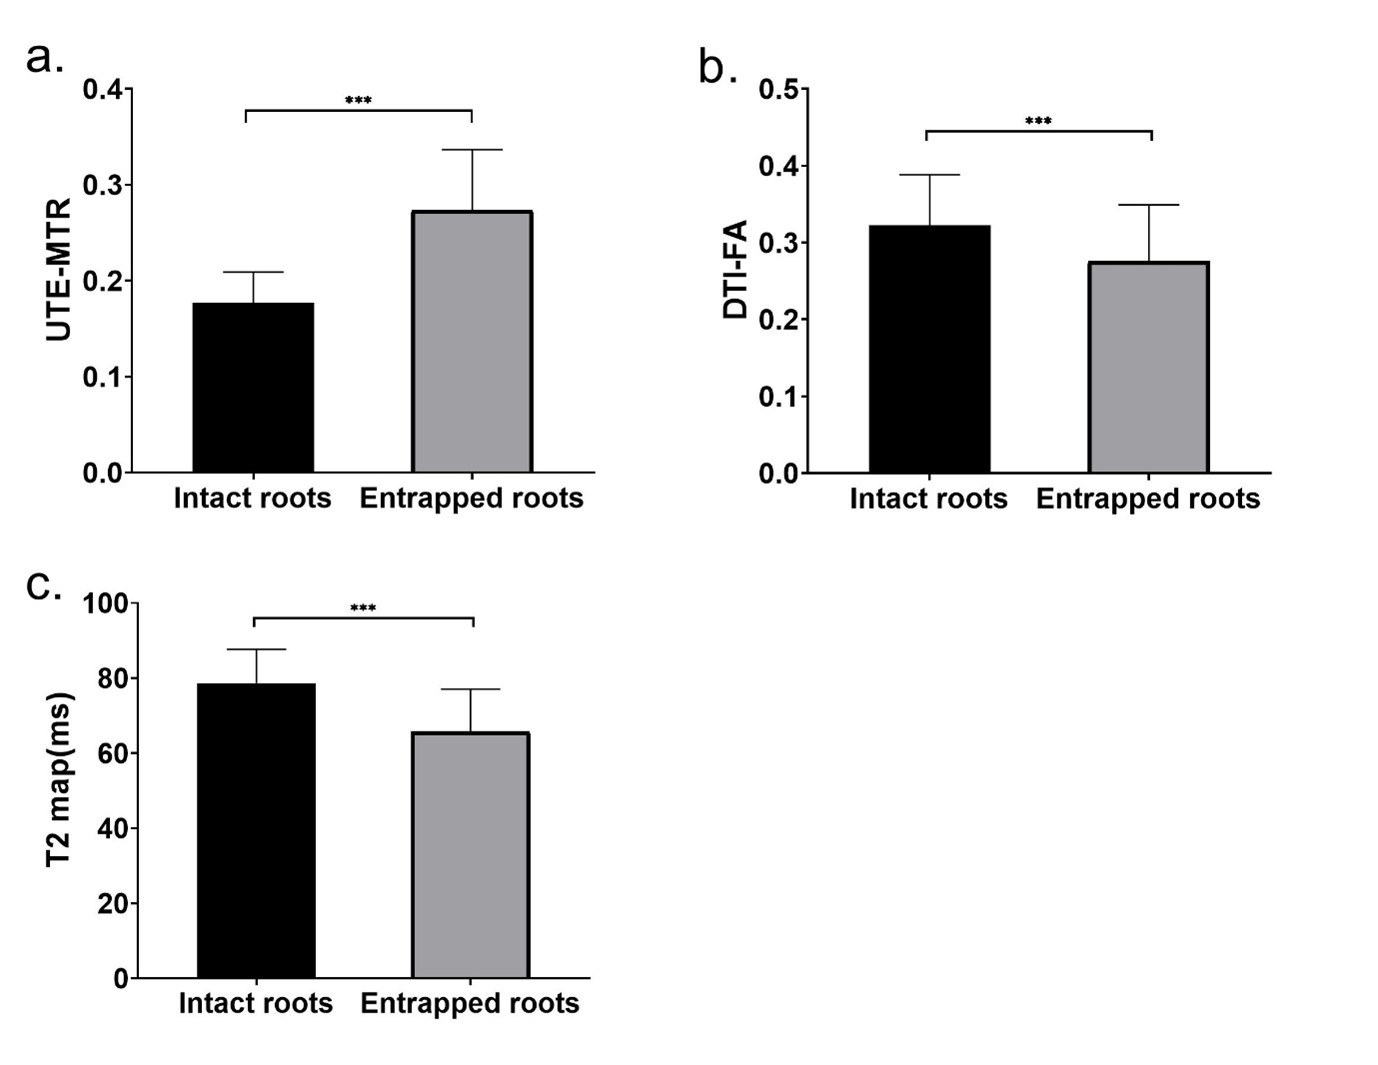
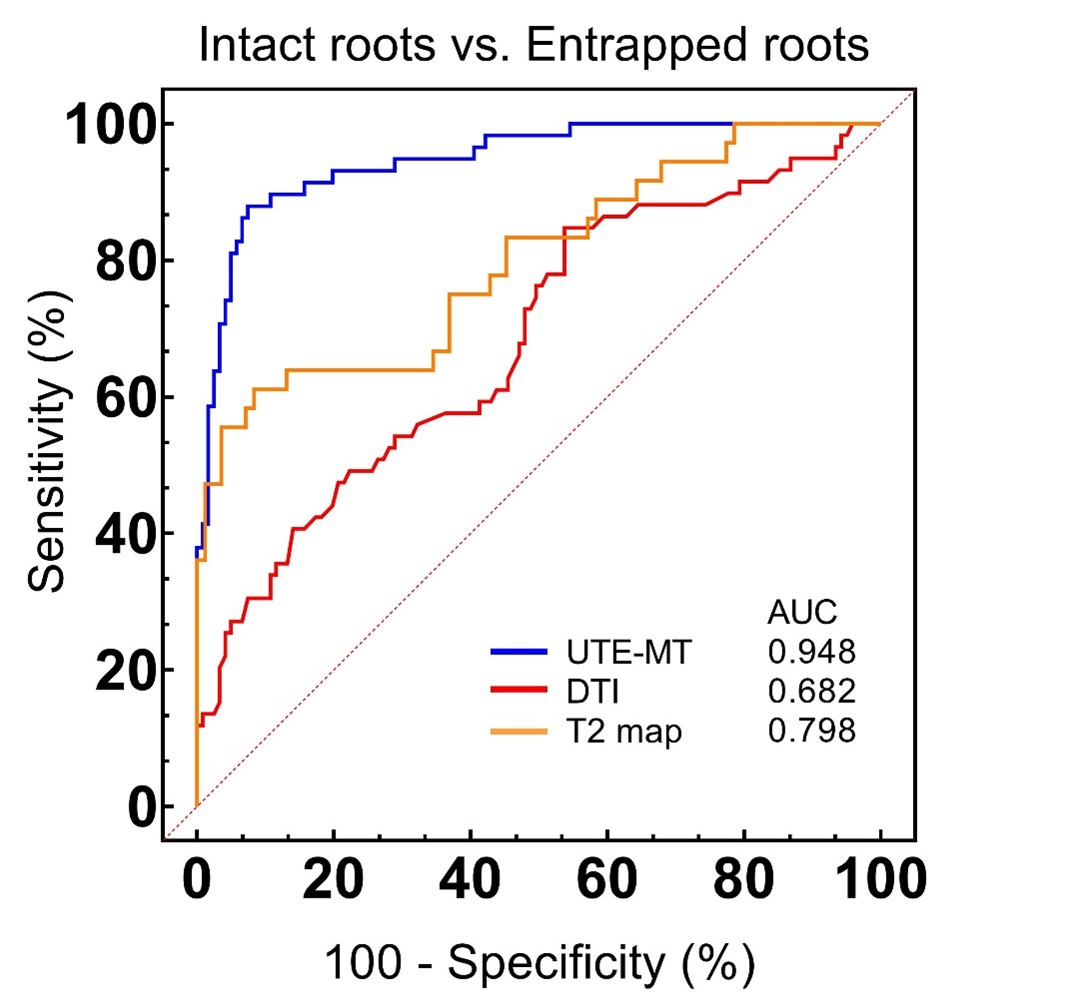
Figure 1 shows the representative axial L4/5 lumbar disc UTE-MT images acquired from a 45-year-old male subject. The UTE-MTR values were significantly increased while FA and T2 values were significantly decreased in patients with lumbar disc herniation compared to those without disc herniation (Figure 2). The ROC curves showed that the UTE-MTR performed better than FA and T2 in discrimination of disc herniation and non-disc herniation (with AUC of UTE-MTR = 0.948, AUC of FA = 0.682 and AUC of T2 = 0.798) (Figure 3).Discussion and Conclusion
To our best knowledge, this is the first study to apply the UTE-MT imaging to assess nerve root changes due to disc herniation in lumbar. Our findings suggested that patients with disc herniation have significantly higher UTE-MTR values in lumbar nerve roots. These UTE-MTR value increases in the nerve roots may be related to the decrease of proteoglycan content. In addition, compression of nerve roots induces blood flow reduction and ischemia, leading to nerve fiber demyelination, Wallerian degeneration and endoneural cracking [3], which may explain the decrease of FA and T2 map. Higher AUC values of UTE-MTR demonstrates that UTE-MT imaging may be a better biomarker than DTI and T2 mapping in assessment of nerve root changes due to disc herniation in lumbar.Acknowledgements
No acknowledgement found.References
[1] Jenis LG, An HS. Spine update. Lumbar foraminal stenosis. Spine 2000; 25: 389-94.
[2] Y. J. Ma, E. Y. Chang, M. Carl and J. Du, "Quantitative magnetization transfer ultrashort echo time imaging using a time-efficient 3D multispoke Cones sequence," Magn Reson Med, 2018;79: 692-700.
[3] Takahashi N, Yabuki S, Aoki Y et al (2003) Pathomechanisms of nerve root injury caused by disc herniation: an experimental study of mechanical compression and chemical irritation. Spine 28:435-441.
Figures