2885
Investigations of the effects of differently trained subject cohortson T1 and T2 of the lumbar spine muscles
1Medical Physics Group, Institute of Diagnostic and Interventional Radiology, Jena University Hospital - Friedrich-Schiller-University, Jena, Germany, 2Institute of Diagnostic and Interventional Radiology, Jena University Hospital - Friedrich Schiller University, Jena, Germany, 3Institute for Pathophysiology and Pathobiochemistry, Motor Research Group, Friedrich-Schiller-University, Jena, Germany, 4Michael Stifel Center for Data-driven and Simulation Science Jena, Friedrich Schiller University, Jena, Germany, 5Abbe School of Photonics, Friedrich Schiller University, Jena, Germany, 6Center of Medical Optics and Photonics, Friedrich Schiller University, Jena, Germany
Synopsis
The majority of studies investigating changes in skeletal muscle parameters with MRI have focused on analyzing the effects before and after exercise training. In this work, we analyze the effects of regular repetitive training on low back muscle by determining T1 and T2 parameters in three cohorts of subjects characterized by different levels of physical activity.
Introduction
The effects of exercise on various skeletal muscles in the body have been extensively studied with MRI, with most studies analyzing the changes in MRI relaxation parameters before and shortly after exercise1,2,3. Only few, mostly animal based studies4, have focused on the changes induced by regular exercise training.In this work, we aim to investigate whether regular exercise and the type of training affect MRI relaxation parameters such as T1 and T2 in three different cohorts.
The 3 cohorts consist of healthy male volunteers (age range 20-30 years): two of them are athletes in two different disciplines (weight training and endurance cycling), while the third group is a control cohort consisting of individuals with a relatively sedentary lifestyle.
Methods
A comprehensive protocol for performing T1 and T2 mapping was developed. A multi-echo TSE sequence (with 20 TEs ranging from 5 ms to 187 ms) was used to generate T2 maps, and a GRE sequence with five flip angles (FA= 4°, 10°, 18°, 24°, 32°), corrected for B1 inhomogeneities, was also used for VFA-based T1 mapping. All measurements were performed in-vivo on a 3T whole-body MRI scanner (Magnetom PRISMA fit, Siemens Healthineers, Erlangen, Germany) using the spine coil array supplied by the vendor. Other sequence parameters were: voxel size = (1.5 x 1.5 x 3) mm3, TAs = 50 min. All the athletes (n=9, 3 subjects per cohort) were measured at rest, and were asked not to exercise for at least 48h before the examination. The subjects are training in average for at least 3 times per week in their discipline.Results
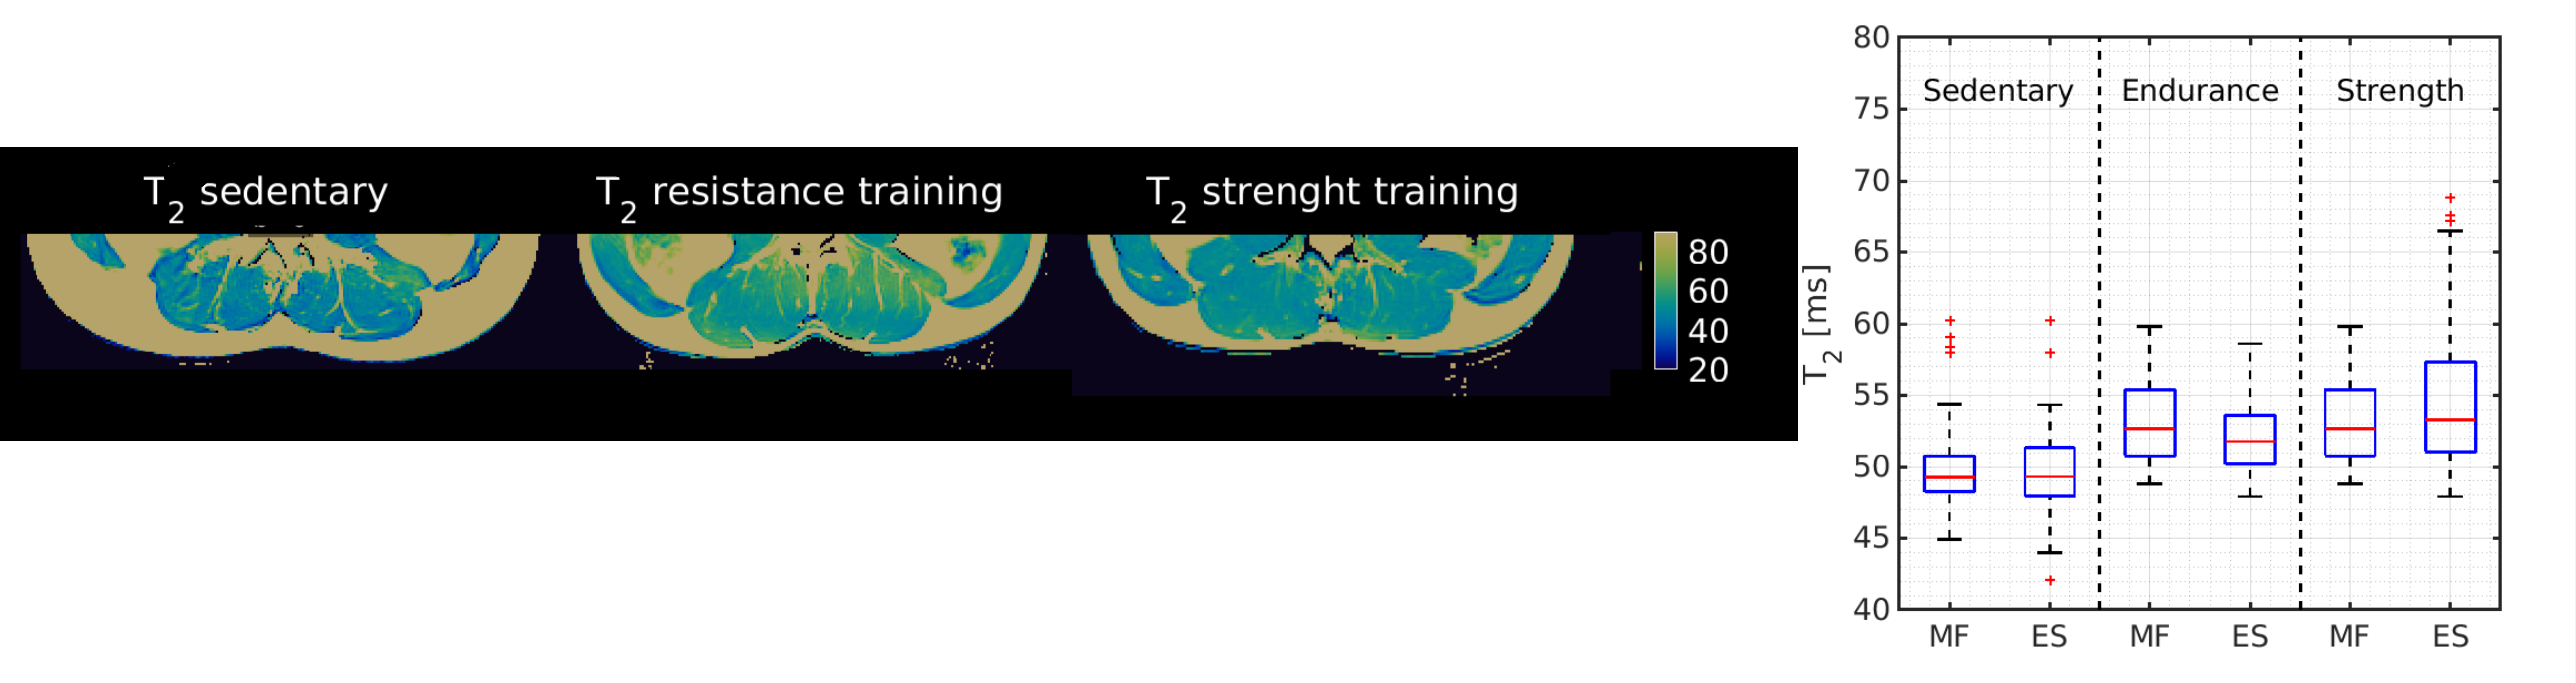
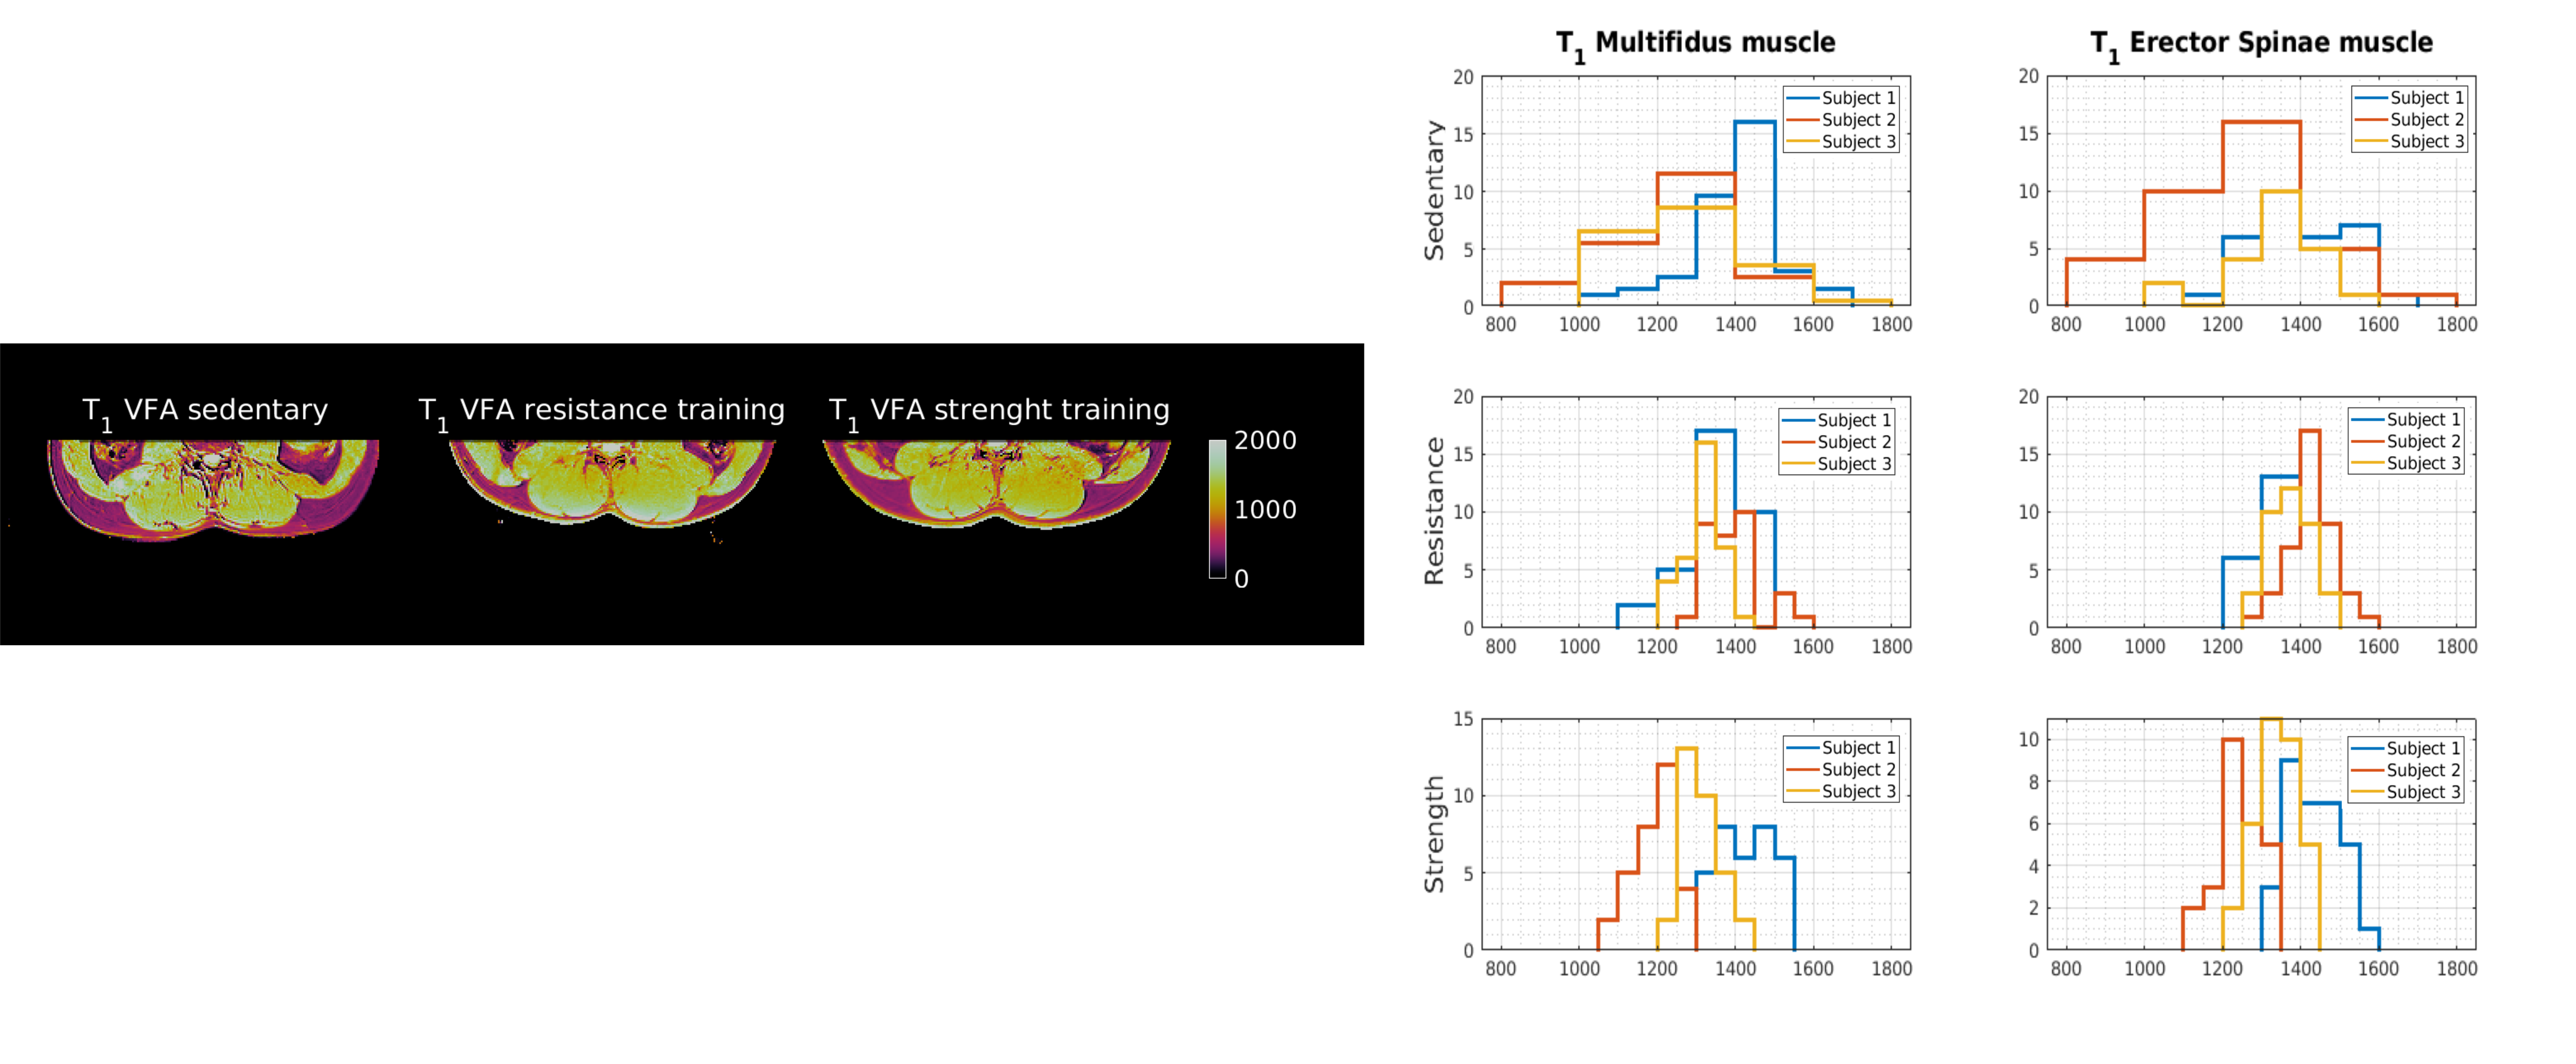
The T2 values of both athlete groups are increased compared to the sedentary subjects, as shown in Fig 1. The boxplots result from the distribution of values extracted from the ROIs (n=35 voxels) in the multifidus and erector spinae muscles for each subjects in the cohorts. Interestingly, although the T1 values of the three cohorts are comparable, the standard deviation of the athletes is smaller than that of the sedentary subjects (see Fig.2).Discussion and conclusion
The T2 and T1 values obtained are consistent with the current literature on this topic1,4. The higher T2 values in athletes are supposedly due to increased transport of water molecules into and out of muscle cells. Several studies have reported that T2 values return to baseline within a period of 30 minutes to 24h after exercise2,3, but our results suggest that baseline values are different in trained and untrained subjects, with trained subjects consistently showing higher T2 values even days after their last exercise sessions. The lower standard deviation of T1 could be related to the lower percentage of fat infiltration in the more trained muscles, resulting in a more homogeneous value of the relaxation parameter in the studied ROI.This work is a preliminary result of a larger ongoing study in which more subjects per cohort will be examined. In addition, IVIM diffusion measurements could be used to investigate whether the changes observed in T1 and T2 are related to changes in perfusion and diffusion coefficient and whether the diffusion parameters would be able to further discriminate between the two cohorts of athletes with distinctly different training. Nevertheless, the results obtained so far appear promising for gaining better insight into the morphofunctional constitution of differently trained subject groups.
Acknowledgements
This work was supported by the Competence Center for Interdisciplinary Prevention (KIP) at the Friedrich Schiller University Jena and the German Professional Association for Statutory Accident Insurance and Prevention in the Foodstuffs Industry and the CateringTrade (BGN).
References
1) Koh HW, Cho SH, Kim CY. Comparison of the Effects of Hollowing and Bracing Exercises on Cross-sectional Areas of Abdominal Muscles. J Phys Ther Sci. 2014;26(2):295-9.
2) Varghese J, Scandling, D, Ono C.. Exercise induced changes in T1, T2 relaxation times and blood flow in the lower extremities in healthy subjects. J Cardiovasc Magn Reson 2013;15:108-13
3) Huang YL, Zhou JL, Jiang YM, Zhang ZG, Zhao W, Han D, He B. Assessment of lumbar paraspinal muscle activation using fMRI BOLD imaging and T2 mapping. Quant Imaging Med Surg. 2020;10(1):106-115. /qims.2019.10.20. PMID: 31956534; PMCID: PMC696
4) Lyu X, Gao Y, Liu Q. Exercise-induced muscle damage: multi-parametric MRI quantitative assessment. BMC Musculoskelet Disord 2021:22: 256 2021). https://doi.org/10.1186/s12891-021-04085-z
Figures