2882
Myelin Water Imaging and Diffusion Tensor Imaging in Pediatric Acute Lymphoblastic Leukemia Patients1Diagnostic Imaging, St Jude Children's Research Hospital, Memphis, TN, United States
Synopsis
Myelin water imaging (MWI) and diffusion tensor imaging (DTI) was performed at two longitudinal time points, approximately two years apart, during chemotherapy in patients treated for acute lymphoblastic leukemia (ALL). DTI metrics correlated with MWF and LWF at time point 1, but the correlations were weaker at time point 2 (TP2). This may be caused by a possible decoupling of the relationship at TP2 as the brain is recovering from the impact of chemotherapy.
INTRODUCTION
With over 90% of patients treated for acute lymphoblastic leukemia (ALL) surviving1, improving the survivors’ quality of life has become a central focus in ALL clinical research. There has been intense interest in studying myelin water fraction (MWF) in the past decade, as a potential biomarkers for the integrity of the white matter (WM) myelin2,3. MWF has been found strongly correlated with myelin histological staining4, and demyelination and scarring were also observed in leukoencephalopathy5 and multiple sclerosis6. Long-T2 water fraction (LWF) may be related to inflammation and severe axonal damage in WM3. Diffusion tensor imaging (DTI) offers a possibility to explore WM microstructure noninvasively. The diffusion metrics, including fractional anisotropy (FA), mean diffusivity (MD), axial diffusivity (AD) and radial diffusivity (RD), may be sensitive to some myelination development along with a wide range of other WM changes within axons7. Based on the hypothesis that DTI parameters should be strongly correlated with MWF/LWF, we examined the relationship between diffusion metrics and MWF/LWF in children treated for ALL with chemotherapy only.METHODS
MRI exams were acquired at two time points, ie., TP1, 20 weeks after diagnosis at re-induction, and TP2, at the end of therapy about two years later. A multi-slice turbo spin echo sequence was used to estimate MWF and LWF8. The acquisition parameters were FOV = 220×220 mm2; matrix = 256 × 256; TE = 10 × n ms (n =1,2,3,...,32); TR = 3 s; receiver bandwidth = 300 Hz/pixel; GRAPPA = 2, and the number of reference lines = 24. Ten slices with 5 mm thickness and 2.5mm gap were acquired with two evenly spaced and interleaved scans (Fig. 1a). DTI images were acquired with 12 directions and a spatial resolution of 1.8x1.8x3.0 mm [TR/TE = 6500/100 ms; b=0, 700 s/mm2].MWF and LWF maps were generated using a MATLAB program described previously8, and DTI metrics were estimated in SPM8 (www.fil.ion.ucl.ac.uk/spm/) using the DTI toolkit. An ROI template was generated using a previous voxel-based analysis of leukoencephalopathy9. The ROI and myelin water imaging (MWI) or DTI were co-registered and means and standard deviations of MWI and DTI metrics were measured on the ROI.
Only patients with non-zero LWF values were included in this study. 132 patients (age = 5.99 ± 3.93 years, M/F = 77/55) were included for TP1 and 144 patients (age = 8.00 ± 4.01 years, M/F = 91/53) for TP2. Imaging protocols were approved by the local Institutional Review Board, and written informed consent was obtained from the patients, parents or guardians.
RESULTS
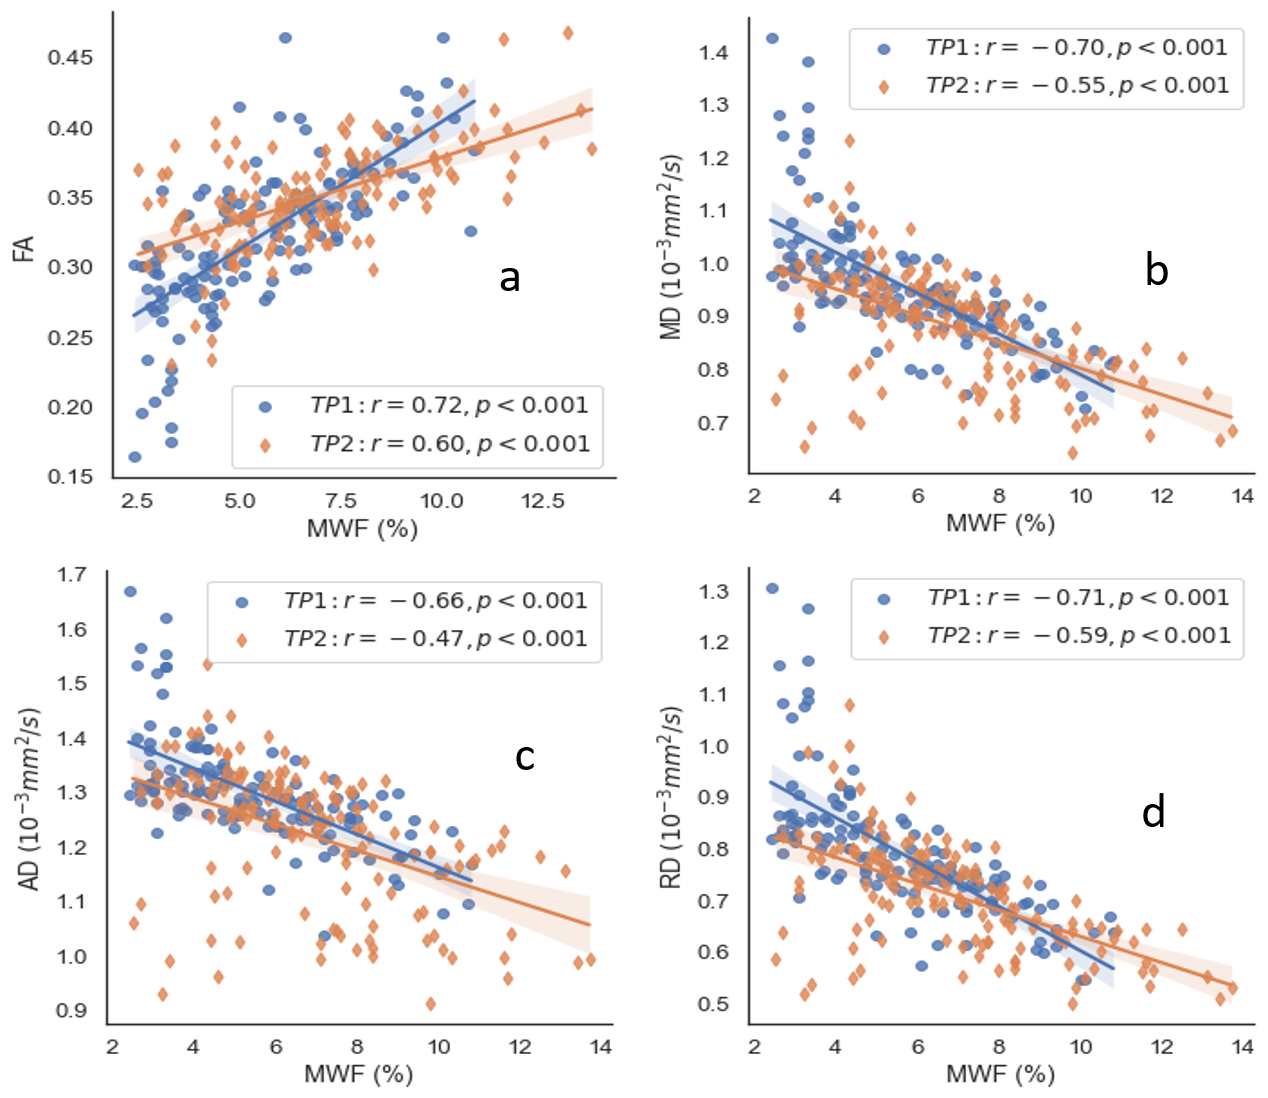
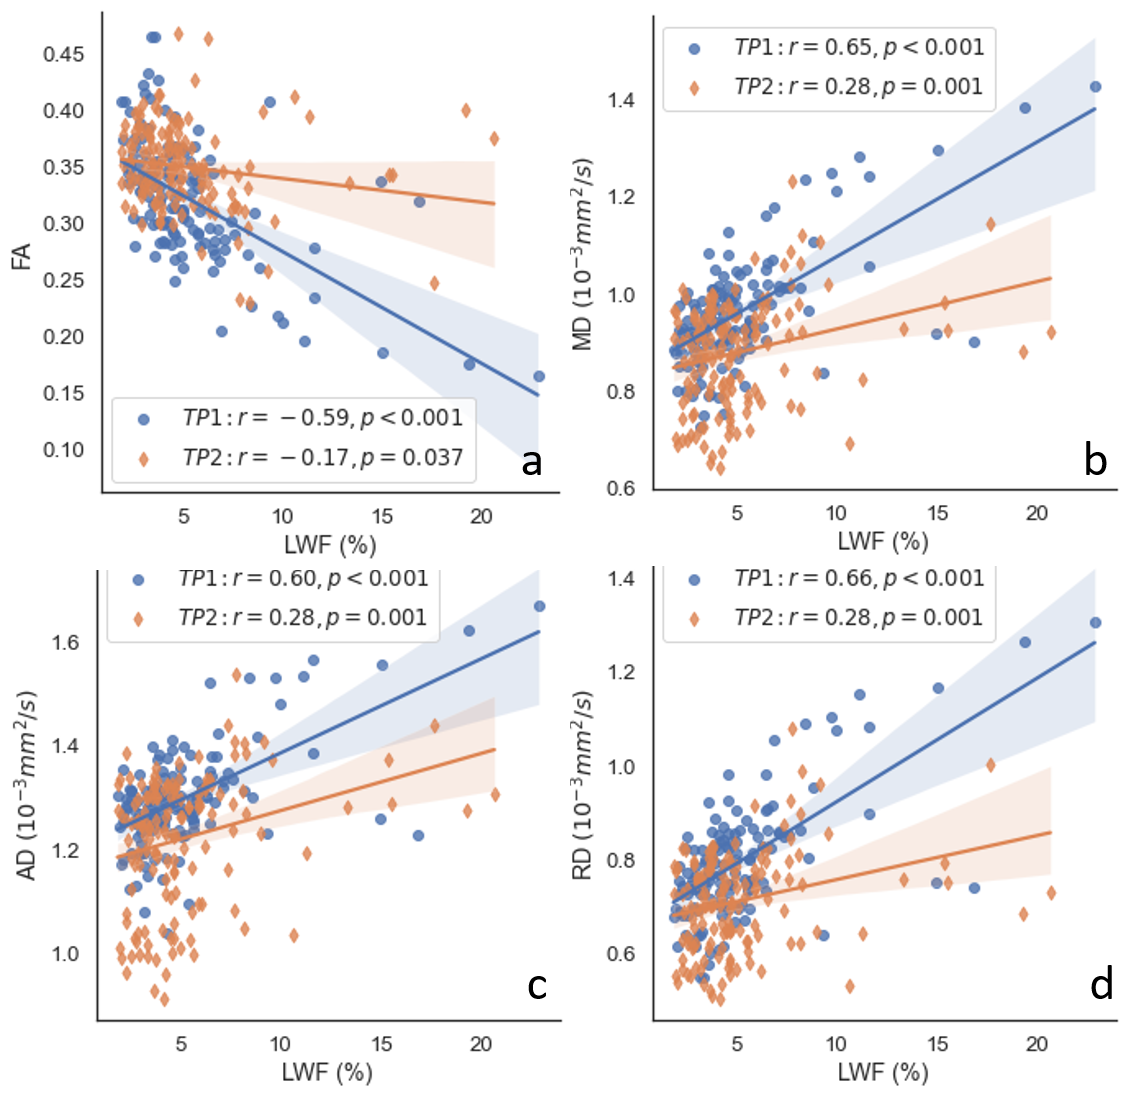
Fig. 1 shows a T2 weighted image along with corresponding MWF/LWF images and DTI parameter maps for an ALL patient. A WM lesion (arrowed) can be seen in the T2 weighted image (Fig. 2b) and different metrics maps (Figs. 2c-2h), most obviously in the MWF map. Assessment of the MWF and DTI metrics at TP1 and TP2 within the ROI across all patients is shown in Fig 2. MWF was positively correlated with FA and negatively correlated with MD, AD and RD with absolute correlation coefficients (r) from 0.66 to 0.72 for TP1 and 0.47 to 0.60 for TP2, along with p < 0.001 for all the cases. The r values for TP2 were always lower than those for TP1. Similarly, Fig. 3 demonstrates the relationships between LWF and DTI metrics. LWF was negatively correlated with FA, and positively correlated with MD, AD and RD with r from 0.59 to 0.66 and p < 0.001 for TP1. However, for TP2 the correlations were weak with r values between 0.17 and 0.28 and p values between 0.001 and 0.037.DISCUSSION
The relationships between MWF and DTI metrics were investigated previously with varying results. MD and RD yielded the highest correlation coefficients with MWF in 22 healthy volunteers10. In 20 healthy children, MWF correlated significantly with MD, but not with AD, RD, or FA11. Significant but weak correlation were observed between MWF and DTI metrics in 22 healthy subjects12. In these studies, the number of participants is limited. In the current study, we assessed these relationships in more than 100 pediatric ALL patients at two time points. MWF and LWF were strongly correlated with FA, MD, AD and RD. To the best of our knowledge, this is the first examination of the relationships between LWF and DTI metrics. LWF was correlated with FA, MD, AD and RD. However, given the inverse relationship between MWF and LWF, the correlations with the DTI metrics were reversed as expected. While this relationship was strong at TP1, correlations were weaker at TP2.The correlations at TP2 were always lower than those at TP1 for MWF and LWF. This may be caused by a possible decoupling of the relationship between water fraction measures and diffusion measures at TP2 as the brain is recovering from the impact of chemotherapy at end of therapy.
CONCLUSION
DTI metrics correlated strongly with MWF and LWF at TP1 early in therapy, but the correlations were weaker at TP2 at end of therapy. Combing DTI and MWI together may provide complimentary information about WM integrity during therapy for ALL.Acknowledgements
We gratefully acknowledge the valuable contributions of Rhonda Simmons and Kathy Jordan, advanced signal processing technicians, and funding in part by the Cancer Center Support Grant P30 CA-21765 and R01 CA90246 (WER) from the National Cancer Institute, and ALSAC.References
1. Pui CH, Evans WE. A 50-year journey to cure childhood acute lymphoblastic leukemia. Semin. Hematol. 2013;50:185–196 doi: 10.1053/j.seminhematol.2013.06.007.
2. Faizy TD, Thaler C, Kumar D, et al. Heterogeneity of multiple sclerosis lesions in multislice myelin water imaging. PLoS One 2016;11:1–13 doi: 10.1371/journal.pone.0151496.
3. Laule C, Vavasour IM, Mädler B, et al. MR evidence of long T2 water in pathological white matter. J. Magn. Reson. Imaging 2007;26:1117–1121 doi: 10.1002/jmri.21132.
4. Laule C, Kozlowski P, Leung E, Li DKB, MacKay AL, Moore GRW. Myelin water imaging of multiple sclerosis at 7 T: Correlations with histopathology. Neuroimage 2008;40:1575–1580 doi: 10.1016/j.neuroimage.2007.12.008.
5. Reddick WE, Laningham FH, Glass JO, Pui CH. Quantitative morphologic evaluation of magnetic resonance imaging during and after treatment of childhood leukemia. Neuroradiology 2007;49:889–904 doi: 10.1007/s00234-007-0262-9.
6. Compston A, Coles A. Multiple sclerosis. Lancet 2008;372:1502–1517 doi: 10.1016/S0140-6736(08)61620-7.
7. Beaulieu C. The basis of anisotropic water diffusion in the nervous system - A technical review. NMR Biomed. 2002;15:435–455 doi: 10.1002/nbm.782.
8. Guo J, Ji Q, Reddick WE. Multi-slice myelin water imaging for practical clinical applications at 3.0 T. Magn. Reson. Med. 2013;70:813–822 doi: 10.1002/mrm.24527.
9. Reddick WE, Glass JO, Johnson DP, Laningham FH, Pui CH. Voxel-based analysis of T2 hyperintensities in white matter during treatment of childhood leukemia. Am. J. Neuroradiol. 2009;30:1947–1954 doi: 10.3174/ajnr.A1733.
10. Mädler B, Drabycz SA, Kolind SH, Whittall KP, MacKay AL. Is diffusion anisotropy an accurate monitor of myelination?. Correlation of multicomponent T2 relaxation and diffusion tensor anisotropy in human brain. Magn. Reson. Imaging 2008;26:874–888 doi: 10.1016/j.mri.2008.01.047.
11. Morris SR, Holmes RD, Dvorak A V., et al. Brain Myelin Water Fraction and Diffusion Tensor Imaging Atlases for 9-10 Year-Old Children. J. Neuroimaging 2020;30:150–160 doi: 10.1111/jon.12689.
12. Liu F, Vidarsson L, Winter JD, Tran H, Kassner A. Sex differences in the human corpus callosum microstructure: A combined T2 myelin-water and diffusion tensor magnetic resonance imaging study. Brain Res. 2010;1343:37–45 doi: 10.1016/j.brainres.2010.04.064.
Figures
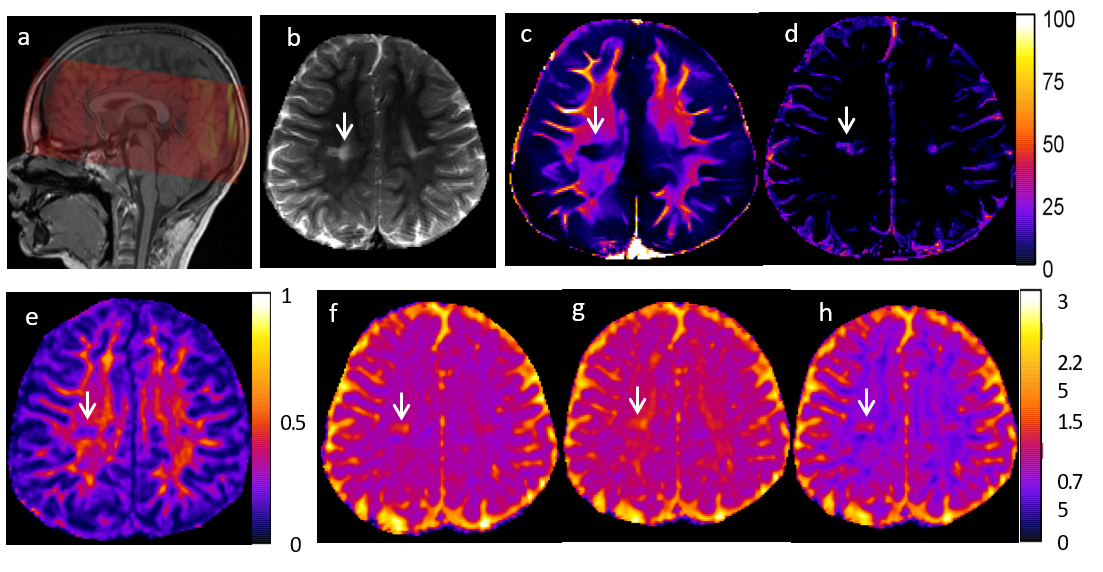
Fig. 1. Myelin water image(MWI) and diffusion tensor image (DTI) for a typical patient. (a)The location of 10 slices MWI images, (b) a multi-echo T2 image (TE = 130 ms), (c) MWF map in %, (d) LWF map in %, (e) FA map unitless, (f) MD, (g) AD and (h) RD in 10-3mm2/s. A white matter lesion (white arrow) can be seen in the different parameter maps.