2880
Early MRI biomarkers in amyotrophic lateral sclerosis (ALS): DTI and functional connectivity.
Juan Carlos Quizhpilema1, Pablo Lecumberri2, Marta Vidorreta3, Tamara Laxe4, Mikel San Miguel5, Javier Díaz6, Inmaculada Pagola5, Marisol Gómez1, Ivonne Jericó5, and Teresa Cabada4
1Department of Statistics, Computer Science and Mathematics, UPNA, Pamplona, Spain, 2Movalsys, Pamplona, Spain, 3Siemens Healthineers, Madrid, Spain, 4Radiology department, HUN, Pamplona, Spain, 5Neurology department, HUN, Pamplona, Spain, 6Psychiatry department, HUN, Pamplona, Spain
1Department of Statistics, Computer Science and Mathematics, UPNA, Pamplona, Spain, 2Movalsys, Pamplona, Spain, 3Siemens Healthineers, Madrid, Spain, 4Radiology department, HUN, Pamplona, Spain, 5Neurology department, HUN, Pamplona, Spain, 6Psychiatry department, HUN, Pamplona, Spain
Synopsis
Amyotrophic lateral sclerosis (ALS) is a neurodegenerative disease characterized by damage to motor neurons. The search for early biomarkers is relevant due to their rapid progression.This study aims to analyze structural and functional measures in a group of newly diagnosed ALS patients, compare them with a group of healthy controls, and evaluate changes longitudinally at a 6-month follow-up.Twenty patients and 15 controls were recruited. The MRI examination included a T1-weighted scan, DTI, rs-fMRI. ALS shows involvement in motor and non-motor areas as shown by DTI in cortical activity in the early phase and in time progression.
Introduction
Amyotrophic lateral sclerosis (ALS) is a chronic and progressive neurodegenerative disease characterized by damage to upper and lower motor neurons [1]. In addition to motor symptoms, patients with ALS may present neuropsychological alterations and their relationship with frontotemporal dementia has been recognized in recent decades as different expressions of the same disease.In recent years, different techniques are being investigated in an attempt to support the clinical diagnosis [2]. MRI has been used to find biological markers to identify ALS, including cortical thinning [3], loss of structural connectivity using Diffusion tensor imaging (DTI) [4], and cortical activity impairment through functional MRI (fMRI) [5]. However, the temporal dynamics of the disease are still under investigation, and the search of early biomarkers is of utmost importance, due to the rapid progression ALS typically exhibits after onset.
This study aims to analyze structural and functional measures in a group of patients with a recent diagnosis of ALS, compare them to a group of healthy controls, and evaluate changes longitudinally at a 6-month follow-up.
Methods
So far, 20 ALS patients and 15 age-matched controls were recruited for this study (mean age ± SD = 62.5 ± 9.48 years, range = 44-76). Patients were diagnosed by a neurologist according to the El Escorial criteria [6].All participants underwent an MRI examination that included an anatomical T1-weighted scan, DTI, resting-state Blood-Oxygen Level Dependent (BOLD) fMRI. Patients underwent an additional follow-up MRI session 6 months after diagnosis.
The MR studies were carried out on a 3T MAGNETOM Vida system (Siemens Healthineers, Erlangen, Germany) using a 32ch head coil, with the following imaging parameters:
Sagittal 3D T1 MPRAGE: voxel size = TI/TE/TR = 1020/2.61/2100 ms, FoV = 230 x 230 mm², matrix = 256 x 256, 192 slices, GRAPPA 3, voxel = 0.9 mm3 isotropic.
DTI: 64-dir multi-shell scan, b-vals = 0, 1000 and 2000 s/mm², TE/TR=91/3800 ms, FoV = 200x200 mm², matrix = 100 x 100, 66 slices, GRAPPA 2, SMS 3, voxel = 2 mm3 isotropic.
BOLD fMRI: 200 resting-state volumes, TE/TR=30/1500 ms, FoV = 200x200 mm², matrix = 100 x 100, 54 slices with 25% gap, GRAPPA 2, SMS 3, voxel = 2 mm3 isotropic.
Structural MRI analysis was performed with FreeSurfer v7.2.0 [7], to evaluate inter-group morphometry differences. DTI data were processed using the TRActs Constrained by UnderLying Anatomy (TRACULA) tool, and differences in Fractional Anisotropy (FA) between groups were assessed.
Resting-state connectivity networks were derived in Matlab using the CONN toolbox v20.b and SPM12 [8]. Seed-based analyses were conducted, placing the seeds in the posterior cingulate cortex and left and right hand-area motor cortices, to extract the default mode network (DMN) and motor network. Group analyses were carried out to evaluate network differences.
Results
Cortical thickness evaluation showed no significant differences between patients and controls at the time of diagnosis. When assessing disease progression within the patient group, significantly isolated foci of cortical loss were found in the right precuneus (p-val=0.013), in the left lateral occipital cortex, both superior and inferior division (p-val=0.017 and 0.022), and the temporooccipital region of the middle temporal gyrus (p-val=0.024).Significant losses of FA were found in the left pyramidal tract comparing patients to controls (Fig 1). When comparing the association tracts, a significant loss of FA was also observed in the following fascicles: bilaterally with left predominance in uncinate fasciculus, superior and inferior longitudinal fasciculus, optic radiations, frontal aslant fasciculus, and arcuate fasciculus; bilaterally in medial longitudinal fasciculus, anterior thalamic radiations, acoustic radiations; and in the right premotor corpus callosum.
At the 6-month follow-up evaluation, FA losses extended bilaterally, preserving the left predominance (Fig 2). Significant differences were observed in the following fascicles: superior, inferior, and middle longitudinal fascicle, uncinate fascicle, corticospinal tract, extreme capsule, ventral cingulum, and dorsal cingulum. The corpus callosum was more affected in the right hemisphere.
In the functional connectivity analysis, different clusters of significant differences (p < 0.005) were found. Comparative results between patients and healthy controls and evolutive changes (Fig 3) are shown in Table 1 (Fig 4).
Discussion
FA losses showed higher sensitivity than cortical thinning in differentiating ALS patients to controls at the time of onset. In addition to the FA alteration of the pyramidal tract, better known in ALS, the damage found in the association fascicles, with asymmetric frontal and temporal involvement, supports the relationship of this disease with the group of frontotemporal dementias and allows a better understanding of the non-motor symptoms in these patients.Conclusion
ALS demonstrates affectations in motor and non-motor areas as shown by DTI and cortical activity in the initial stage of the disease, with progression over time. Future work of this study is to perform rest perfusion and connectivity analysis using ASL and kurtosis to consolidate the results presented in addition to the integration of new patients.Acknowledgements
No acknowledgement found.References
1. Wais, V., Rosenbohm, A., Petri, S., Kollewe, K., Hermann, A., Storch, A., Hanisch, F., Zierz, S., Nagel, G., Kassubek, J., Weydt, P., Brettschneider, J., Weishaupt, J. H., Ludolph, A. C. and Dorst, J. The concept and diagnostic criteria of primary lateral sclerosis. Acta Neurol Scand. 2017;136:204–211. https://doi. Org/10.1111/ane.127132. Mazon M, Vazquez Costa JF, Ten-Esteve A, Marti-Bonmati L. Imaging Biomarkers for the Diagnosis and Prognosis of Neurodegenerative Diseases. The Example of Amyotrophic Lateral Sclerosis. Front Neurosci. 2018;12:784
3. Menke RAL, Proudfoot M, Talbot K, Turner MR. The two-year progression of structural and functional cerebral MRI in amyotrophic lateral sclerosis. Neuroimage Clin. 2018;17:953–61
4. Kalra S, Müller HP, Ishaque A, Zinman L, Korngut L, et al. A prospective harmonized multicenter DTI study of cerebral white matter degeneration in ALS. Neurology. 2020;95(8):e943-e952. doi: 10.1212/WNL.
5. Castelnovo V, Canu E, Calderaro D, Riva N, Poletti B, et al. Progression of brain functional connectivity and frontal cognitive dysfunction in ALS. Neuroimage Clin. 2020;28:102509. doi: 10.1016/j.nicl.2020.102509.
6. Brooks, B. R., Miller, R. G., Swash, M. & Munsat, T. L. El Escorial revisited: Revised criteria for the diagnosis of amyotrophic lateral sclerosis. Amyotroph. Lateral Scler. (2000). doi:10.1080/146608200300079536
7. Yendiki A, Panneck P, Srinivasan P, Stevens A, Zöllei L, Augustinack J, Wang R, Salat D, Ehrlich S, Behrens T, Jbabdi S, Gollub R and Fischl B. Automated probabilistic reconstruction of white-matter pathways in health and disease using an atlas of the underlying anatomy. (2011). Front. Neuroinform. 5:23. doi: 10.3389/fninf.2011.00023
8. Whitfield-Gabrieli, S., & Nieto-Castanon, A. Conn: A functional connectivity toolbox for correlated and anticorrelated brain networks (2012). Brain connectivity, 2(3), 125-141
Figures
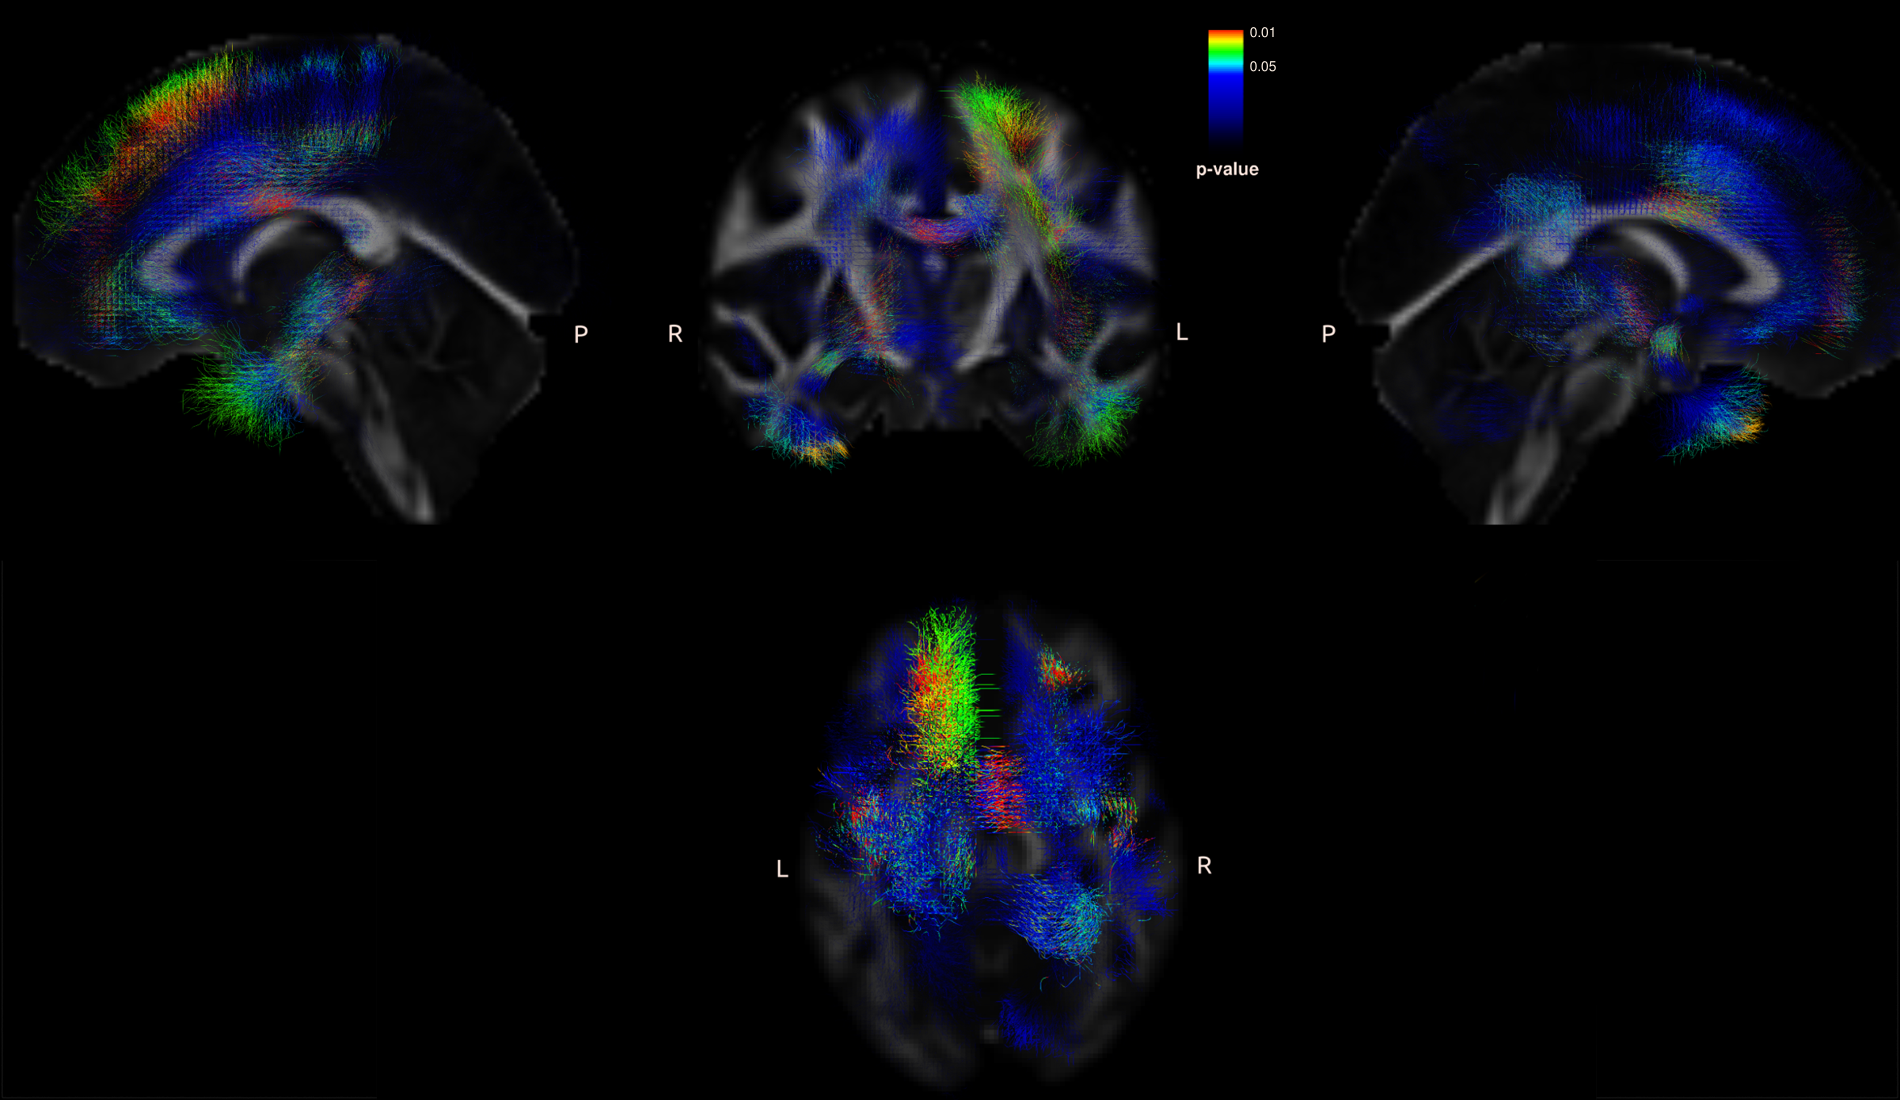
Fig 1. Tracts with significant FA differences between controls and patients.
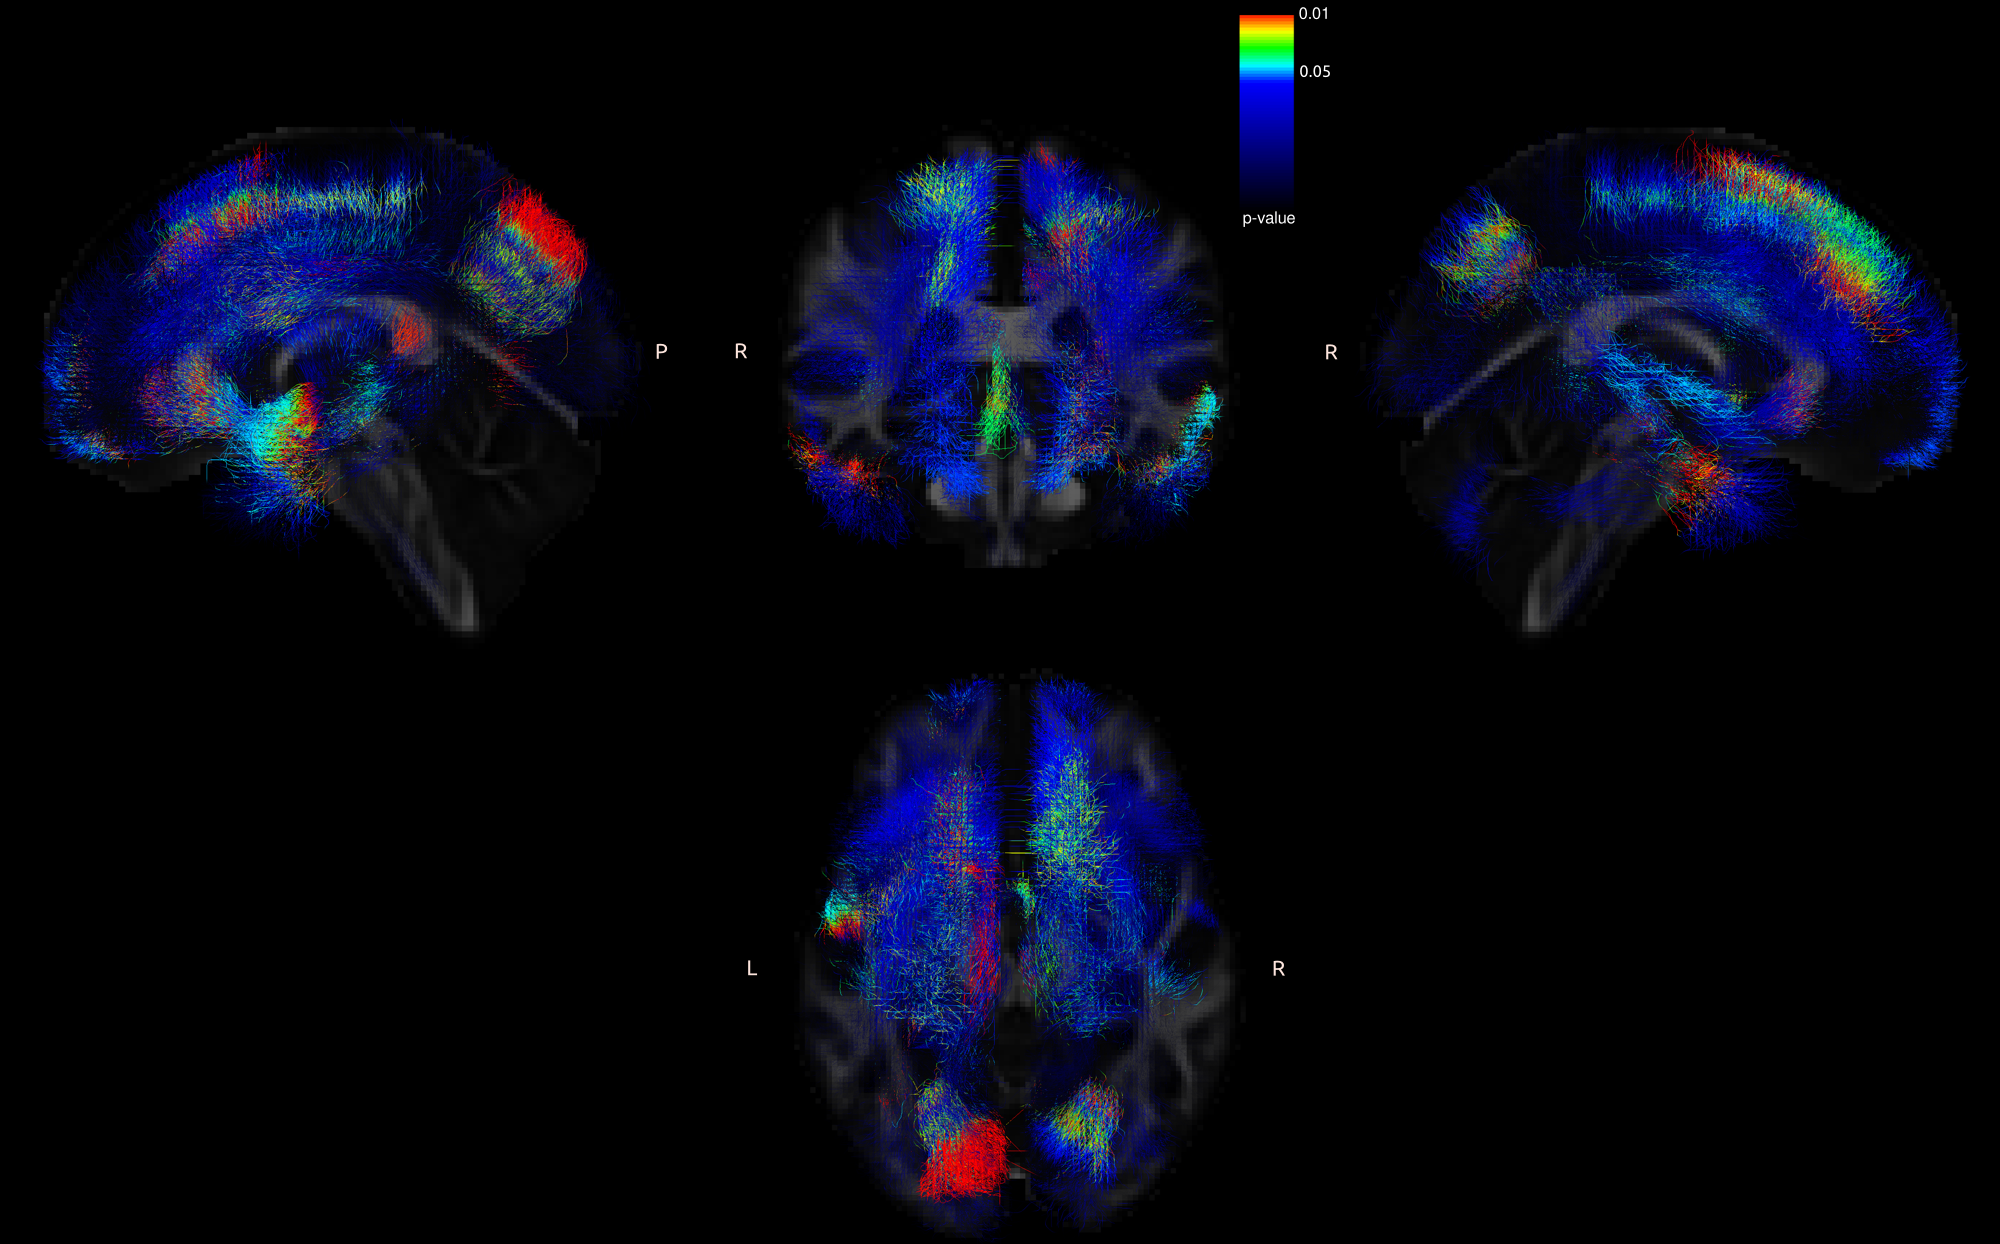
Fig 2. Tracts with significant FA differences between patients after diagnosis and patients at 6 months.
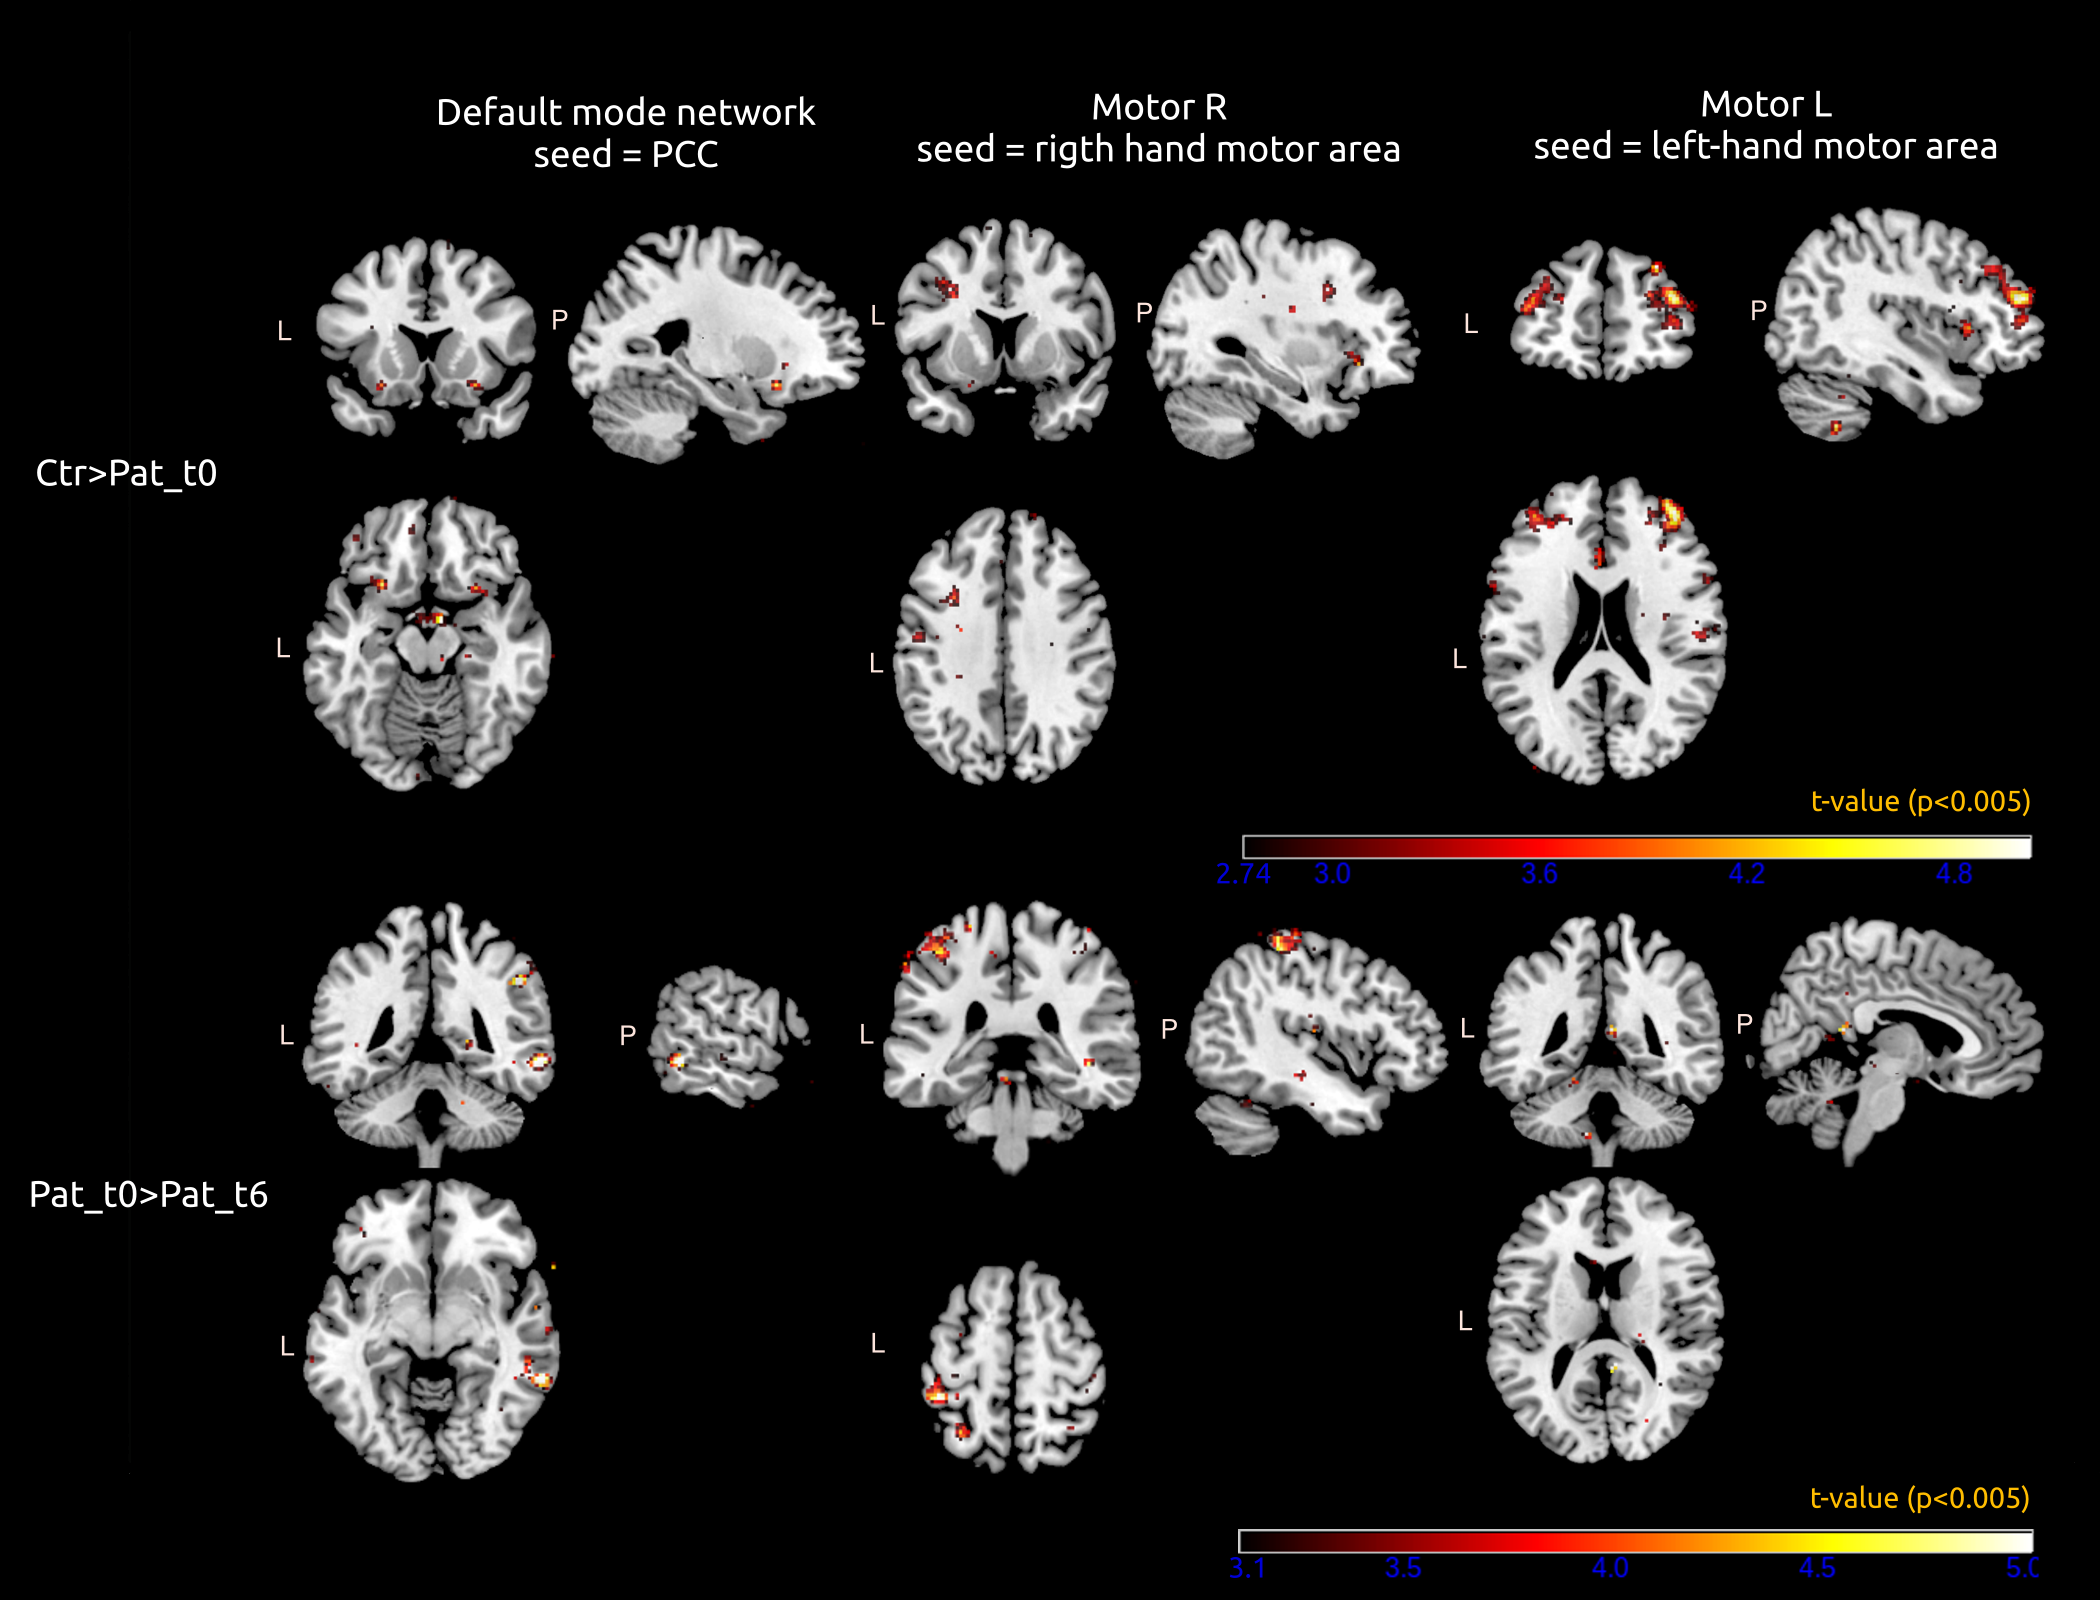
Fig 3. Representative areas showing significant functional connectivity differences in PCC (left), right motor (middle) and left motor (right) seed-based analyses (p < 0.005 unc, Crt = Healthy controls, Pat_t0 = Patients a time of diagnosis, Pat_t6 = Patients 6 months).
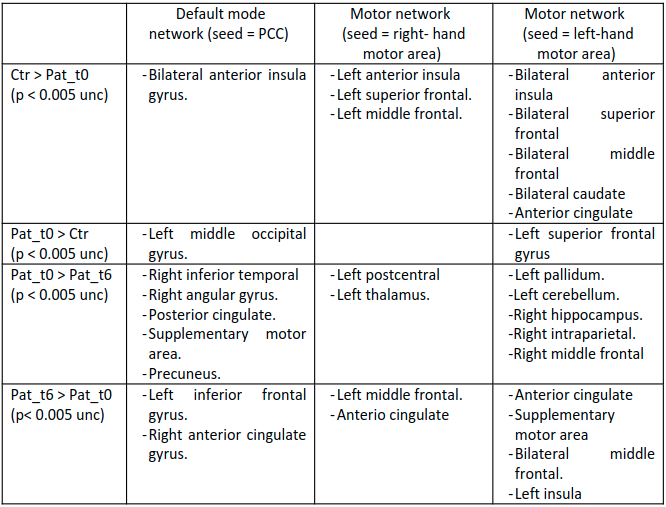
Fig 4. Summary of all brain areas showing significant differences in PCC (left), right motor (middle) and left motor (right) seed-based analyses (p < 0.005 unc, Crt = Healthy controls, Pat_t0 = Patients a time of diagnosis, Pat_t6 = Patients 6 months).
DOI: https://doi.org/10.58530/2022/2880