2879
Myelin Alterations during the Development of an Absence Seizure Mouse Model1Bioengineering Department, Stanford University, Stanford, CA, United States, 2Neurology Department, Stanford University, Stanford, CA, United States, 3Radiology Department, Stanford University, Stanford, CA, United States
Synopsis
Maladaptive myelination may be related to the increasing frequency of absence seizures. To explore this connection, we performed MRI microstructural measurements in ex vivo mouse brains from the Scn8amed+/- model of absence epilepsy in two cohorts of mice at two points of their development, both before and after seizures were well established. Our MRI g-ratio results strongly agree with our previous findings based on electron microscopy and show a clear alteration of myelination throughout the anterior portion of the corpus callosum.
Introduction
Absence seizures are a common form of pediatric epilepsy1 that involve generalized seizures consisting of brief lapses in awareness. Pediatric absence seizures may be associated with significant impairment of attention and learning in 30-40% of affected children.Recent studies have shown the influence of neuronal activity in adaptive changes in myelination in the healthy brain2. Here, we are focused on understanding the potential interplay between myelination and seizure activity3 by tracking the progression of absence epilepsy with non-invasive MRI maps of myelination. Towards this goal, we have previously shown MRI white matter evaluations4 in ex vivo brains of a murine model of absence epilepsy (Scn8amed+/-)5 and an electron microscopy (EM) validation of these results6. Here, we extend this work in two ways. Firstly, we provide further evidence that it is the presence of seizures that are related to the observed myelination changes as opposed to a different attribute of the Scn8amed+/- mouse model. To more clearly assess the impact of seizures, we perform MRI characterization of myelination changes in two cohorts of mice at different stages of development (before and after seizures are prevalent). Secondly, we aim to demonstrate how MRI can provide valuable information about which parts of a tract are affected as opposed to sampling only select ROIs as is done for EM.
Methods
Using a 7T Bruker small bore animal scanner (BioSpec 70/30 USR, Gmax: 440 mT/m, SR: 3440 T/m/s), we scanned two cohorts of excised mouse brains: a p21 cohort (4 heterozygous(HET) and 5 wildtype(WT)) and a p51 cohort (5 HET/ 4 WT). At p21, the mice have not yet developed seizures, while at p51, the seizures are already well established3.Our protocol included:- Magnetization Transfer (MT): 2D FLASH images with equivalent flip angles of 1000° and 4000° and frequency offsets of 1000, 2000, 4000, 6000, 10000, 22000 and 30000Hz.
- T1 images: RARE with TR=600, 800, 1000, 1500, 2200 and 4000 ms.
- Diffusion: diffusion weighted spin echo EPI with two shells of 36 diffusion encoding directions at b=3000 and 6000 s/mm2.
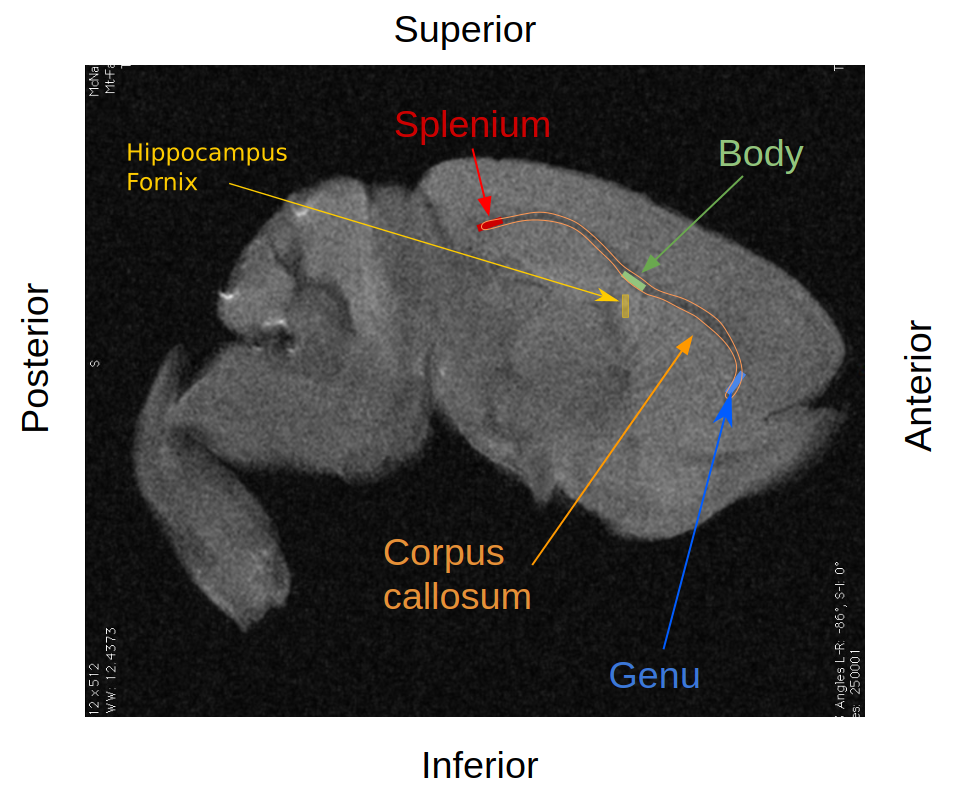
Myelin Volume Fraction (MVF), derived from the MT and T1 images using the Sled-Pike model7,8 and Axon Volume Fraction (AVF), derived from the DWI using the NODDI model9, were used to obtain a voxel wise estimate of g-ratio(ratio of the inner diameter of the axon to the outer diameter encompassing the myelin sheath) as described in West et al.10,11. G-ratios were compared within the genu, body and splenium of the corpus callosum, as well as in the hippocampal fornix as a negative control (Fig.1).
Results and Discussion
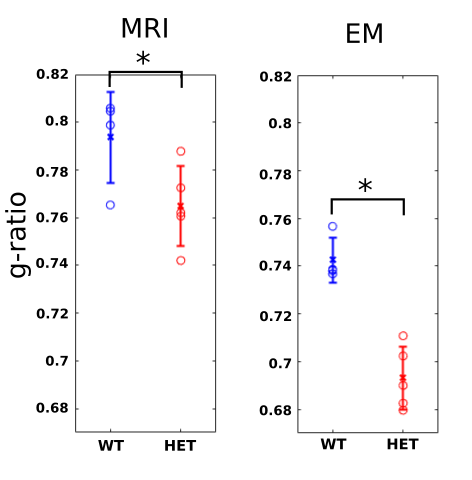
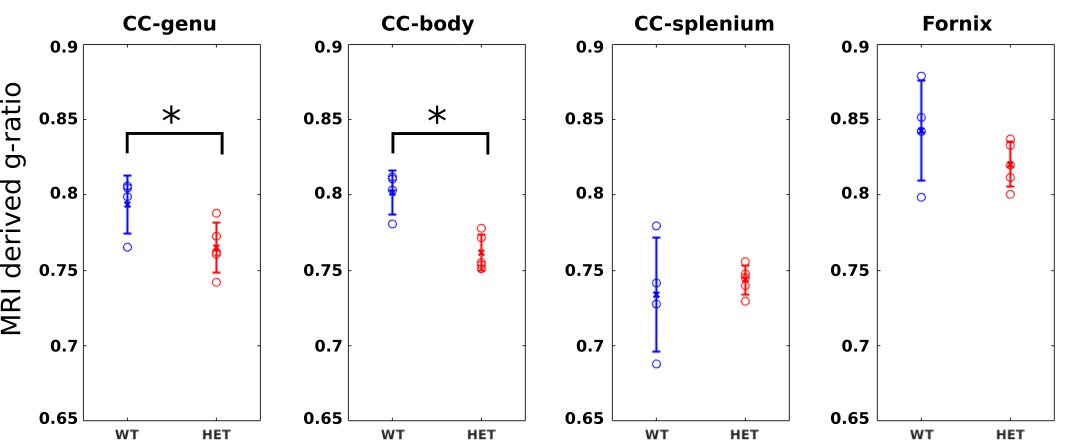
In p51 mice (Fig.2), the MRI derived g-ratios in the genu (WT:0.794±0.019, HET:0.765±0.017, T-test: p=0.048) show a statistically significant decrease in the HET mice and agree with the EM g-ratios (WT:0.743±0.009, HET:0.693±0.01, T-test: p=0.0004). Potential reasons for the higher MRI g-ratios compared to EM include the known MRI bias towards larger axons12 and the exclusion of unmyelinated axons for EM11.MRI metrics (Fig. 3) show a statistically significant difference in the body (WT:0.802±0.014, HET:0.762±0.012, T-test: p=0.0027) but not in the splenium of the corpus callosum (WT:0.734±0.038, HET:0.744±0.01, p=0.6). These agree with previous studies that obtained EM g-ratio comparisons in the same mouse model3. No significant difference (WT:0.843±0.033, HET: 0.820±0.015, p=0.21797) was found in our negative control white matter tract (Hippocampal fornix). The seizures are concentrated in the thalamocortical network3,6 and, therefore, we do not expect any observable alterations in the fornix.
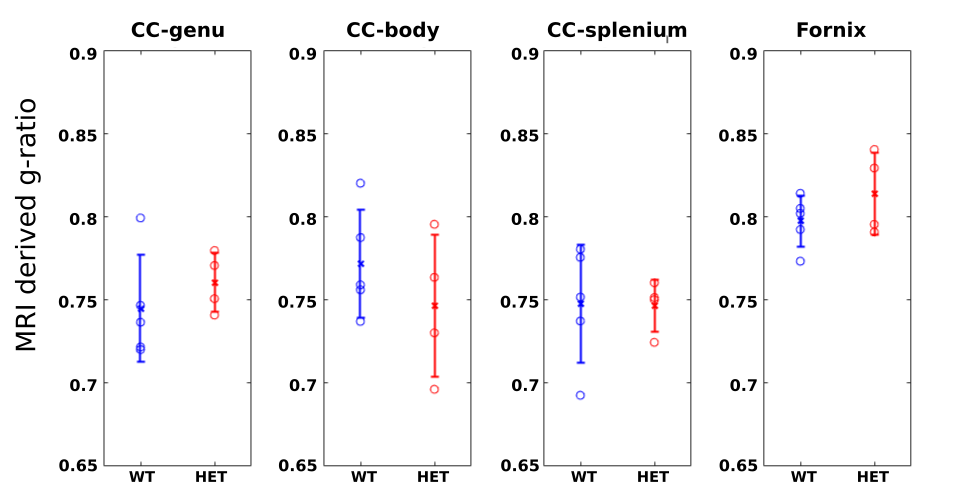
No significant differences were found for WT vs. HET in the less mature p21 mice (Fig.4), for which seizures are not well established. These results support the prior evidence linking myelination changes with the presence of seizures3.
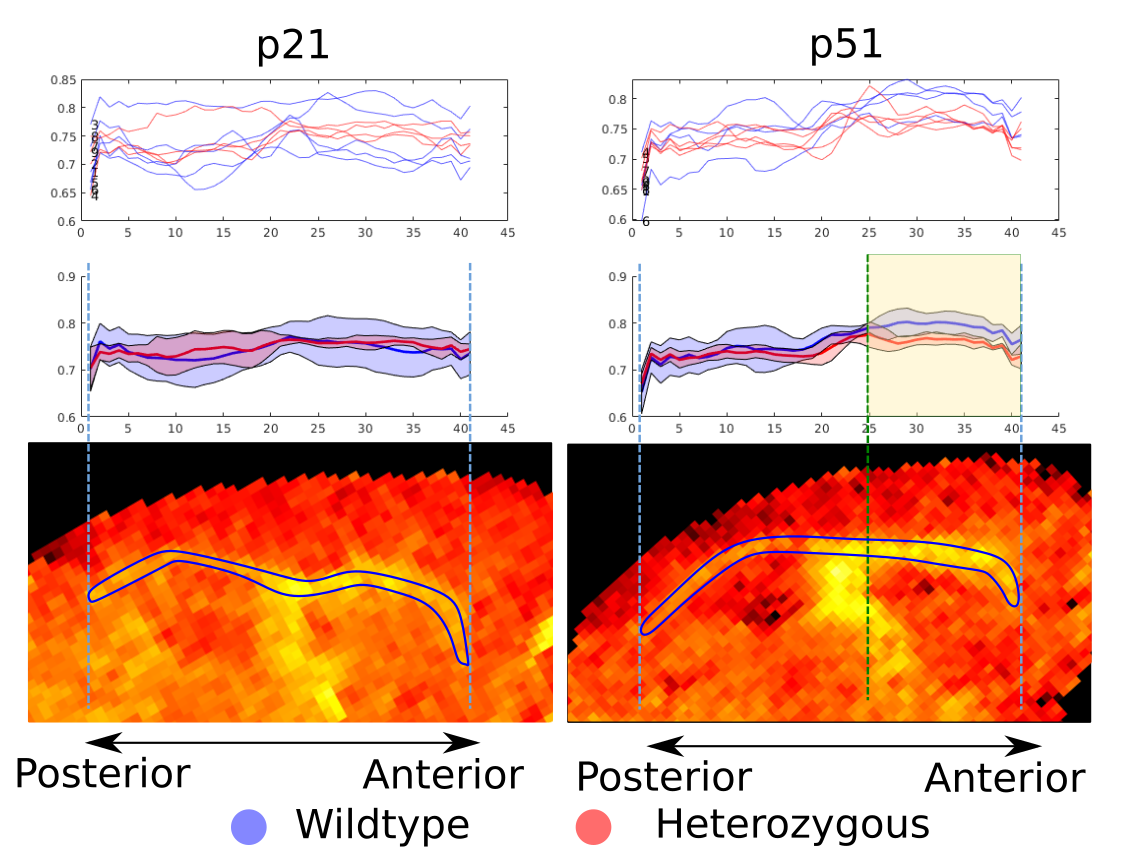
Figure 5 shows that the average HET (red) g-ratio curves overlap with the WT for the p21 mice, whereas HET g-ratios are consistently lower than WT between the genu and the body (highlighted in yellow) for the p51 mice. A spline regression analysis shows that the curves are significantly different with p-value <0.001 between the two groups. This agrees with our previous comparisons4 and previous EM measurements3 and pinpoints the importance of selecting adequate regions in the EM analysis and the possibilities opened by whole brain MRI analysis.
Conclusion
We have presented a comparison of MRI derived g-ratios in a mouse model of absence seizures at two different time points in development. We observed significant differences in the oldest cohort with well established seizures in the anterior part of the corpus callosum, and these results agree with the EM validation and previous studies. These results support the use of MRI for probing myelination changes and highlight the advantages of mapping myelination in the whole brain using quantitative MRI.Acknowledgements
The authors would like to acknowledge the help of Dr. Jarrett Rosenberg with the spline regression analysis.References
Kessler, Sudha Kilaru, and Emily McGinnis. "A Practical Guide to Treatment of Childhood Absence Epilepsy." Pediatric Drugs 21.1 (2019): 15-24.
Gibson, Erin M., et al. "Neuronal activity promotes oligodendrogenesis and adaptive myelination in the mammalian brain." Science 344.6183 (2014): 1252304.
Knowles, Juliet K., et al. "Maladaptive myelination promotes epileptogenesis in absence epilepsy." Available at SSRN 3680883 (2020).
Chau Loo Kung, Gustavo et al. “White Matter Microstructural Changes in an Absence Epilepsy Mouse Model,” 2020 International Society for Magnetic Resonance in Medicine
Chau Loo Kung, Gustavo et al. “Validation of MRI Measurements of Myelination Changes in an Absence Epilepsy Mouse Model,” 2021 International Society for Magnetic Resonance in Medicine
Makinson, Christopher D., et al. "Regulation of thalamic and cortical network synchrony by Scn8a." Neuron 93.5 (2017): 1165-1179.
Sled, John G., and G. Bruce Pike. "Quantitative imaging of magnetization transfer exchange and relaxation properties in vivo using MRI." Magnetic Resonance in Medicine: An Official Journal of the International Society for Magnetic Resonance in Medicine 46.5 (2001): 923-931.
Cabana, J.-F., Gu, Y., Boudreau, M., Levesque, I. R., Atchia, Y., Sled, J. G., Narayanan, S., Arnold, D. L., Pike, G. B., Cohen-Adad, J., Duval, T., Vuong, M.-T. and Stikov, N. (2016), Quantitative magnetization transfer imaging made easy with qMTLab: Software for data simulation, analysis, and visualization. Concepts Magn. Reson.
Zhang, Hui, et al. "NODDI: practical in vivo neurite orientation dispersion and density imaging of the human brain." Neuroimage 61.4 (2012): 1000-1016.
West, Kathryn L., et al. "Myelin volume fraction imaging with MRI." Neuroimage 182 (2018): 511-521.
West, Kathryn L., et al. "Experimental studies of g-ratio MRI in ex vivo mouse brain." NeuroImage 167 (2018): 366-371.
West, Kathryn L., et al. "A revised model for estimating g-ratio from MRI." Neuroimage 125 (2016): 1155-1158.
Figures