2878
Acute Global Structural and Diffusivity Changes Following Treatment with MRgFUS1University of Sydney, Sydney, Australia, 2Sydney Neuroimaging Analysis Centre, Sydney, Australia, 3St Vincent's Hospital Sydney, Sydney, Australia, 4GE Healthcare Australia, Melbourne, Australia
Synopsis
MRgFUS is a non-invasive procedure for the treatment of tremor, involving the application of high-energy ultrasound waves to ablate tissue in the brain in regions implicated in tremor networks. There is a lack of data on the acute changes outside the ablated region following treatment with MRgFUS. This investigation sought to examine changes in brain volume and diffusion tensor metrics following treatment with MRgFUS.
Introduction
Magnetic resonance guided focused ultrasound (MRgFUS) is an incisionless surgical procedure used to treat tremor symptoms in patients with movement disorders such as essential tremor (ET) and Parkinson’s disease (PD). The procedure involves the ablation of brain tissue by application of high-energy ultrasonic beams focused on a single target region, resulting in focal heating and the destruction of tissue by thermal necrosis.MRgFUS ablations have been the subject of numerous investigations1,2,3; however, there is a lack of literature on acute global changes outside of the ablated region following treatment with MRgFUS. Therefore, this investigation aimed to use structural and diffusion weighted imaging (DWI) to investigate global structural changes outside of the ablated region immediately following treatment with MRgFUS.
Methods
Data was acquired from 66 subjects undergoing MRgFUS at St Vincent’s Hospital Sydney. MRI data was acquired prior to and immediately following treatment. The acquisition protocol included a sagittal 3D T1-WI, and in a subset of 27 subjects, either 64-direction (b=1000) or multi-shell DWI (b-values: 0, 700, 1000, 2800 s/mm2, with 8, 25, 40 and 75 directions) was acquired.From each treatment, the mean, maximum and sum of the energy, power and temperature of all sonication’s over the course of the treatment was calculated.
Percentage brain volume change (PBVC) and percentage ventricular volume change (PVVC) were estimated between the pre and post-treatment T1-WI using SIENA (v6.0), part of FSL4. Whole brain and substructure (GM, WM, CSF) volumes and scaling factor (inversely proportional to head size) were estimated on the pre-treatment T1-WI with SIENAX (v6.0)4. The ablated regions were segmented on the post-treatment T1-WI using ITK-SNAP (v3.6.0)5.
White matter (WM) segmentation masks were generated from the pre and post-treatment T1-WI using FSL-FAST (v6.0)6 and transformed to DWI space. The segmented ablated regions were dilated by a single voxel and removed from the WM masks to ensure the ablated region was not included in the WM masks.
The diffusion data were pre-processed with MRtrix37 to produce maps of fractional anisotropy (FA) and mean diffusivity (MD). Absolute mean change in FA and MD was calculated in the whole brain WM and at the ablation site.
Multiple linear regression with backward elimination was used to determine how the energy, power and temperature of treatment were related to changes in PBVC, PVVC, FA and MD. In addition, age, gender, SDR, scaling factor, and brain and substructure (GM, WM, CSF) volumes were included as covariates in the model. All statistics were performed with SPSS (IBM SPSS Statistics for Mac, Version 26.0)
Results
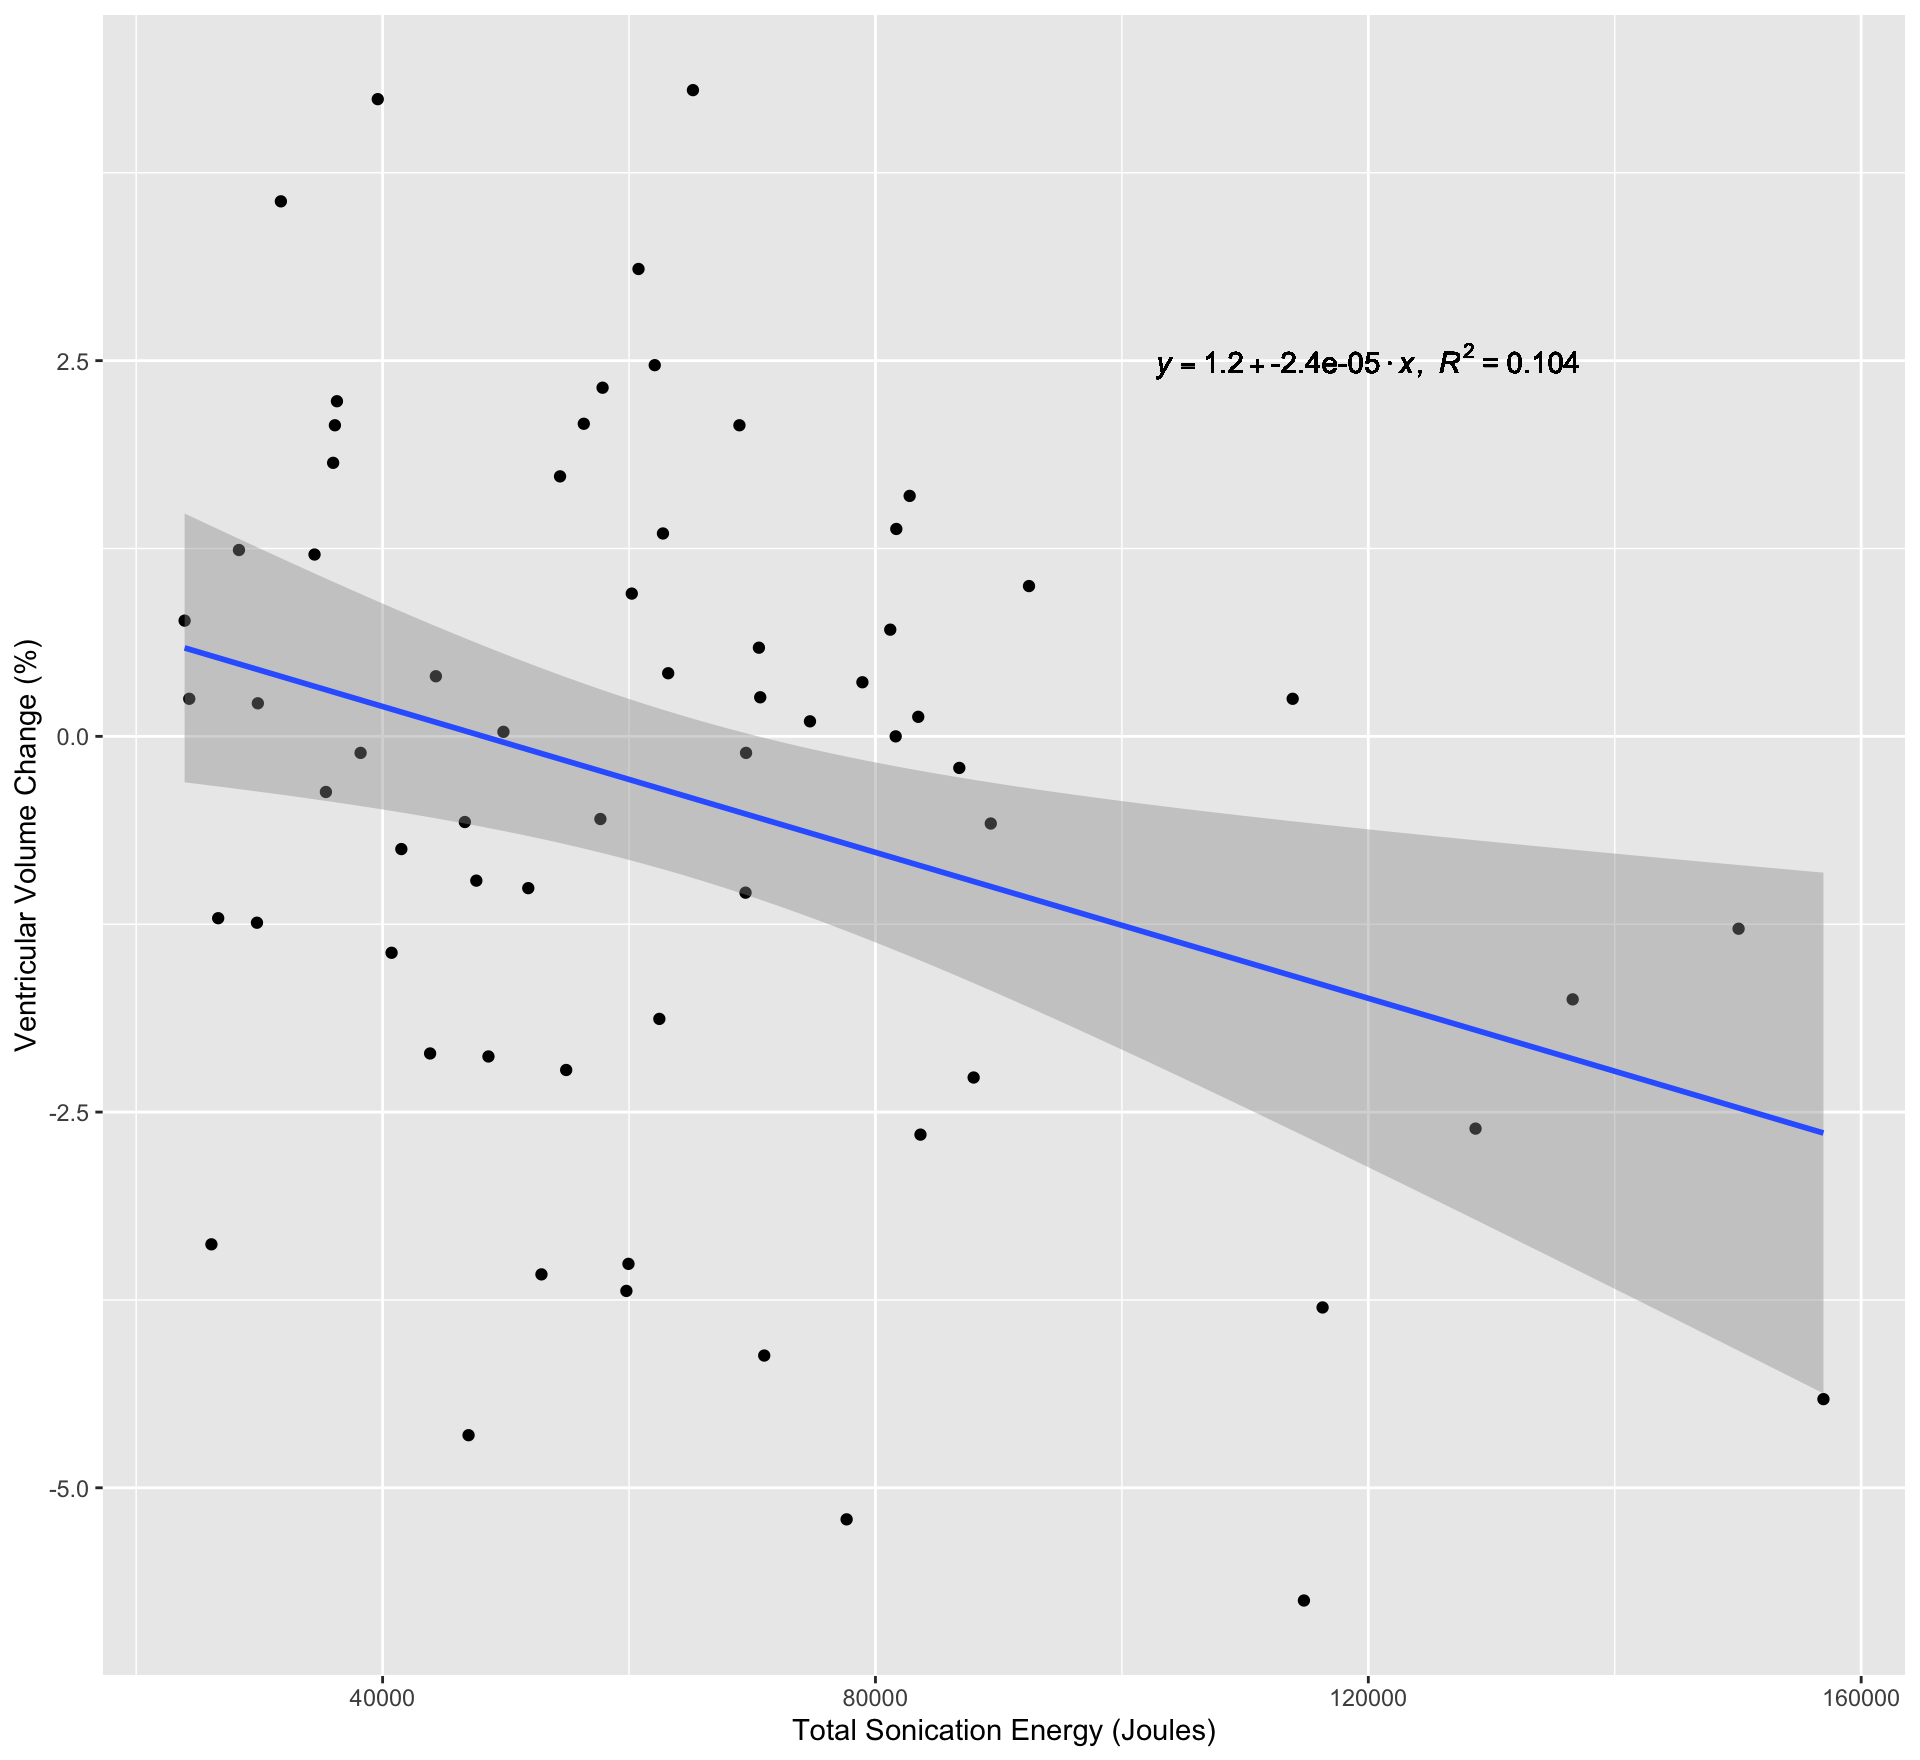
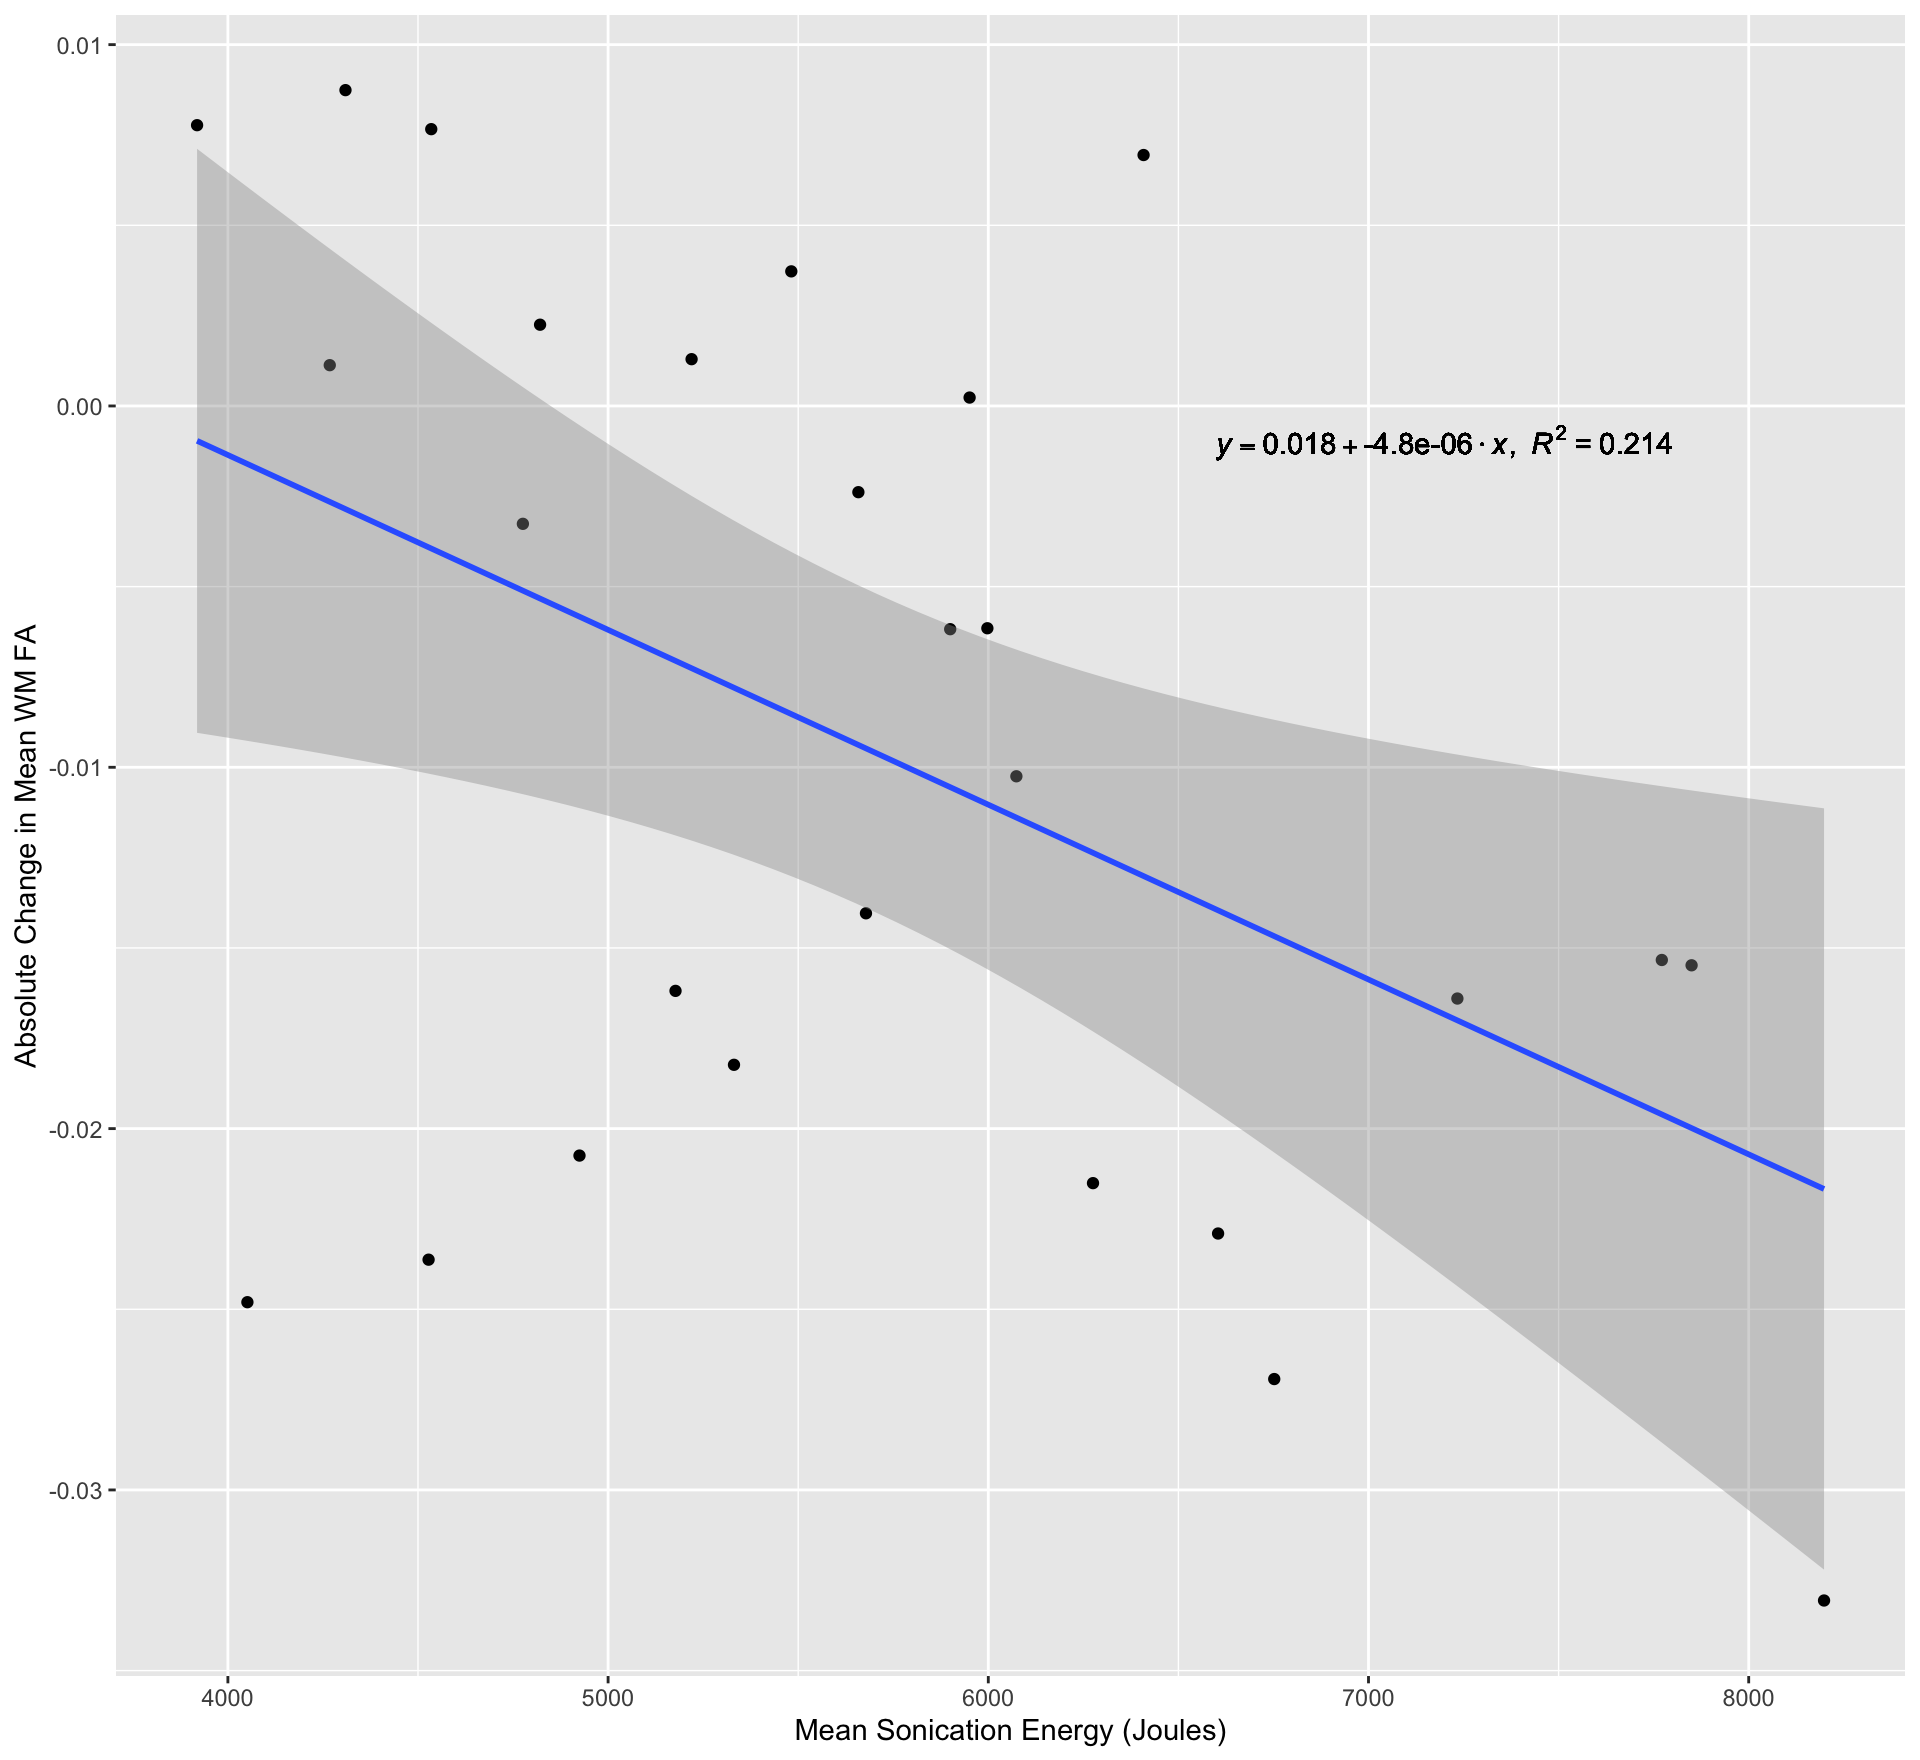
The mean (± SD) PBVC and PVVC following treatment with MRgFUS was -0.36 ± 0.96% and -0.39 ± 2.25%, respectively. Multiple linear regression did not reveal any relationships between PBVC and any structural or sonication parameters. PVVC was negatively correlated with the total sonication energy (Fig. 1) delivered during treatment (β = -0.322, p = 0.008).The mean change in WM FA and MD was -9.55 × 10⁻³ ± 1.23 × 10⁻² and -5.84 × 10⁻⁶ ± 2.59 × 10⁻⁵ mm2/s respectively. The change in FA and MD in the ablation site was -0.22 ± 0.06 and -1.76 × 10⁻⁵ ± 7.18 × 10⁻⁵ mm2/s, respectively. MD change in the WM and ablation site was not significantly related to any baseline structural metric or sonication parameter. Mean sonication energy was the best predictor (Fig. 2) of WM FA change (β= -0.463, p = 0.015). Mean power (β = -0.408, p = 0.018) and scaling factor (β = -0.409, p = 0.018) were the best predictors of FA change at the ablation site.
Discussion
The observed relationship between ventricular volume and total sonication energy may be a result of edema. Any swelling of brain tissue could lead to increased pressure on the ventricles, causing a shift of the ventricle border and a reduction in ventricular CSF volume. The relationship between increased sonication energy and edema has been established8; however, this has been typically observed on imaging acquired 1-7 days following treatment. Here we demonstrate that changes in ventricular volume can be detected less than an hour following treatment.However, we did not observe an increase in MD immediately following treatment, as might be expected if edema is linked with PVVC, and there was no relationship between energy and change in MD either globally or at the ablation site. This might be due to the relatively small sample size (N=27) of subjects with diffusion data. Nevertheless, our observation of a global FA reduction and the relationship between FA change and total sonication energy suggests that increased sonication energy might alter the diffusion properties of tissue outside of the ablated region. Further investigation of PVVC and diffusion metrics could reveal a relationship between edema and PVVC.
Conclusion
We have demonstrated that increases in the total sonication energy delivered during MRgFUS are associated with a decrease in ventricular CSF volume measured immediately following treatment. Furthermore, increased energy was also linked to decreases in global WM FA outside of the MRgFUS target. Given that intra-procedural target adjustments are typically less than 1mm, any changes in ventricular size, particularly in the vicinity of the third ventricle, could have implications for treatment strategy and targeting.Acknowledgements
The authors acknowledge the funding and expertise provided by GE Healthcare Australia, and the assistance provided by the team at St Vincent's Hospital Sydney.References
[1] A. Boutet et al., “Focused ultrasound thalamotomy location determines clinical benefits in patients with essential tremor,” Brain, vol. 141, no. 12, pp. 3405–3414, 2018, doi: 10.1093/brain/awy278.
[2] G. Zur, O. Lesman-segev, and I. Schlesinger, “Structural integrity following focused ultrasound thalamotomy and its correlation with tremor relief,” vol. 17, 2019.
[3] M. R. Walker et al., “Acute MR-guided high-intensity focused ultrasound lesion assessment using diffusion-weighted imaging and histological analysis,” Front. Neurol., vol. 10, no. OCT, pp. 1–13, 2019, doi: 10.3389/fneur.2019.01069.
[4] S. M. Smith et al., “Accurate, robust, and automated longitudinal and cross-sectional brain change analysis,” Neuroimage, vol. 17, no. 1, pp. 479–489, 2002, doi: 10.1006/nimg.2002.1040.
[5] P. A. Yushkevich et al., “User-guided 3D active contour segmentation of anatomical structures: Significantly improved efficiency and reliability,” NeuroImage (Orlando, Fla.), vol. 31, no. 3, pp. 1116–1128, 2006.
[6] Y. Zhang, M. Brady, and S. Smith, “Segmentation of brain MR images through a hidden Markov random field model and the expectation-maximization algorithm,” IEEE Trans. Med. Imaging, vol. 20, no. 1, pp. 45–57, 2001, doi: 10.1109/42.906424.
[7] J. D. Tournier et al., “MRtrix3: A fast, flexible and open software framework for medical image processing and visualisation,” Neuroimage, vol. 202, no. August, p. 116137, 2019, doi: 10.1016/j.neuroimage.2019.116137.
[8] A. Sinai et al., “Magnetic resonance–guided focused ultrasound thalamotomy for essential tremor: a 5-year single-center experience,” J. Neurosurg., vol. 133, no. 2, pp. 417–424, 2020, doi: 10.3171/2019.3.JNS19466.
Figures