2877
Exploring Myelin Imaging Biomarkers in Pelizaeus-Merzbacher Disease1Institut for Diagnostic and Interventional Neuroradiology, University Hospital Carl Gustav Carus, Dresden, Germany, 2Pediatrics and Adolescent Medicine, University Medicine Göttingen, Goettingen, Germany, 3Advanced Baby Imaging Lab, Memorial Hospital of Rhode Island, Pawtucket, RI, United States
Synopsis
Advanced MRI techniques bear great potential to explore myelination in hypomyelinating leukodystrophies such as Pelizaeus-Merzbacher disease (PMD) in-vivo. Quantitative imaging biomarkers which reflect myelin, its spatial distribution, and dynamics during brain maturation are not readily available i.e. to monitor natural disease courses. In a pilot study including three PMD patients, multi-component relaxation which enables the evaluation of relative myelination by estimating the myelin water fraction (MWF) was obtained from 56 region of interest (ROI). Determination of ROIs was facilitated by coregistration of the patients data to a pediatric atlas and compared to age matched healthy controls.
Introduction
Pelizaeus-Merzbacher disease (PMD) is a hypomyelinating white matter (WM) disease characterized by lack of myelination and markedly altered myelin microstructure. Quantitative magnetic resonance imaging (MRI) techniques could provide insights into myelination processes in-vivo, as a prerequisite for evaluating the natural disease course. Moreover, the imaging parameters will be crucial to establish biomarkers to monitor therapy efficacy in the future. This study assessed myelination in PMD subjects by means of quantitative MRI parameters in predefined region of interests (ROI) defined in a pediatric brain single subject atlas (JHU18m), https://cmrm.med.jhmi.edu/, JHU_Pediatric_SS_18Month.Methods
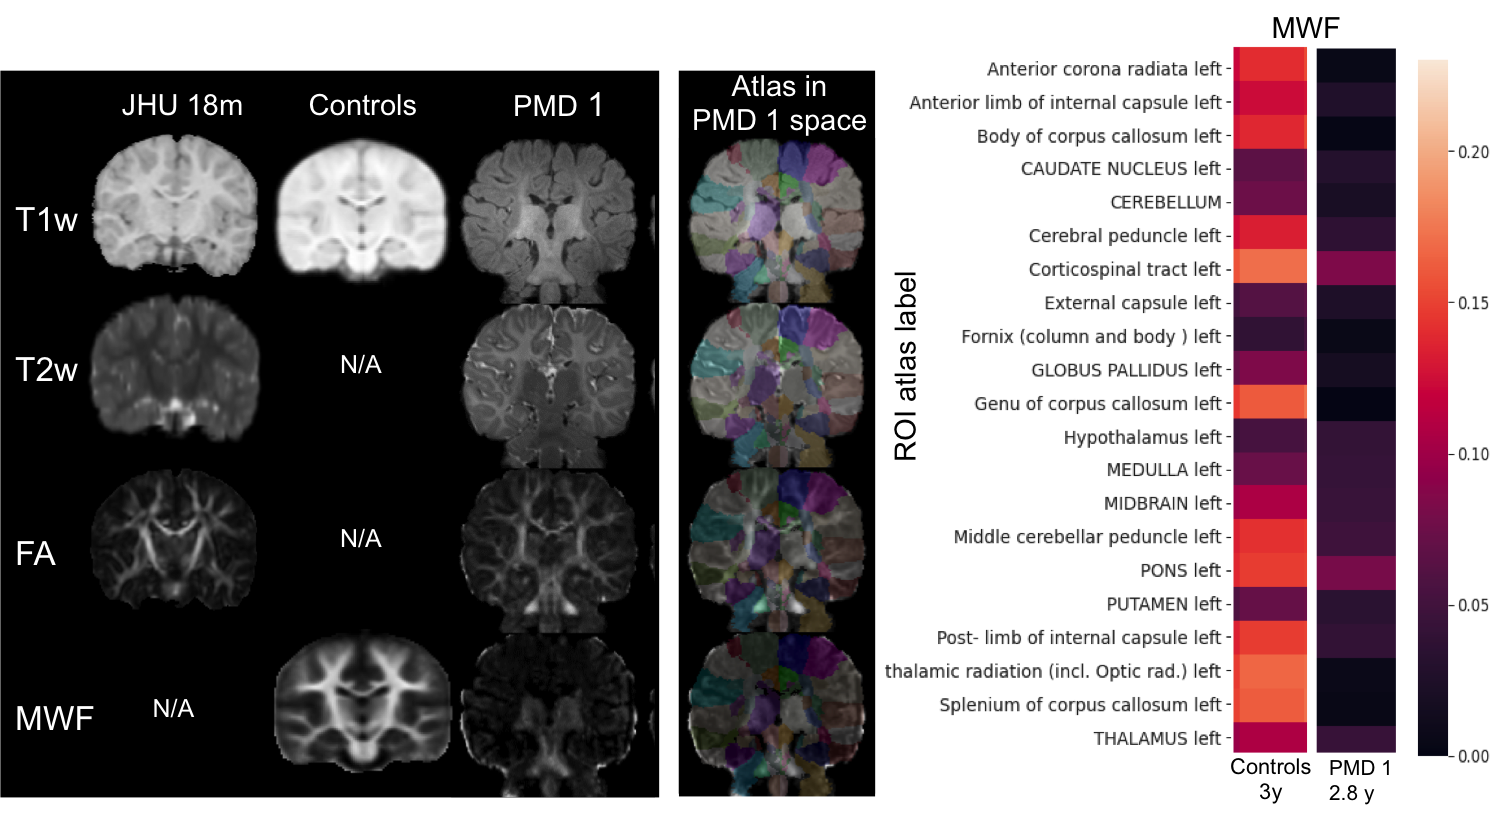
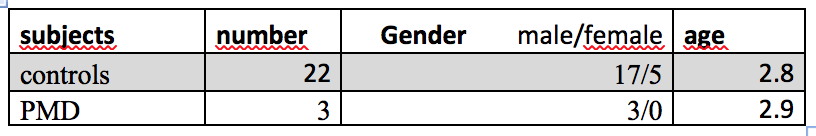
Three PMD subjects were scanned on a 3 Tesla scanner (Siemens, Trim Trio), demographics see Fig. 3. The MRI protocol consisted of conventional T1-, T2-weighted imaging as well as quantitative MRI including Diffusion Tensor Imaging (DTI) and multi-component relaxation derived from mcDESPOT [1]. Details of the MR protocol can be found on https://gitlab.ukdd.de/ koehlerca/leukodystrophies. The quantitative maps of the fractional anisotropy (FA) and myelin water fraction (MWF) were processed. Neuroimaging data were organized according to Brain Imaging Data Structure (BIDS) standard [4]. A post-processing pipeline was developed via nipype workflows [3] by sets of python scripts to automate the FMRIB Software Library (FSL) and ANTs toolbox [5].T2w, FA and MWF images of PMD patient were registered on their session T1w scan. Brain extraction was performed on T1w image by fsl using (BET) and the brain mask was applied on the co-registered images within the session. The atlas was warped in the patient session space. This was performed by applying the inverse transform of the multimodal registration based on T1w, T2w and FA on the atlas segmentation. The usage of a FA image enabled an accurate registration. Atlas segmentation labels served as ROIs to quantify their mean MWF (Fig. 1). ROIs were classified in regard to its WM tract as brain stem, projection fibers, association fibers and commissural fibers. 22 subjects, age 2.5-3 years, containing T1w images and MWF maps originally published in Deoni et al 2012 [2] served as healthy controls and were provided with permission. Atlas was warped in the healthy controls study template space by applying the inverse transform of the nonlinear registration based on T1w 18month image on the atlas. Nonparametric Mann-Whitney U rank test on two independent samples was performed to determine group differences between MWF of controls and PMD.Results
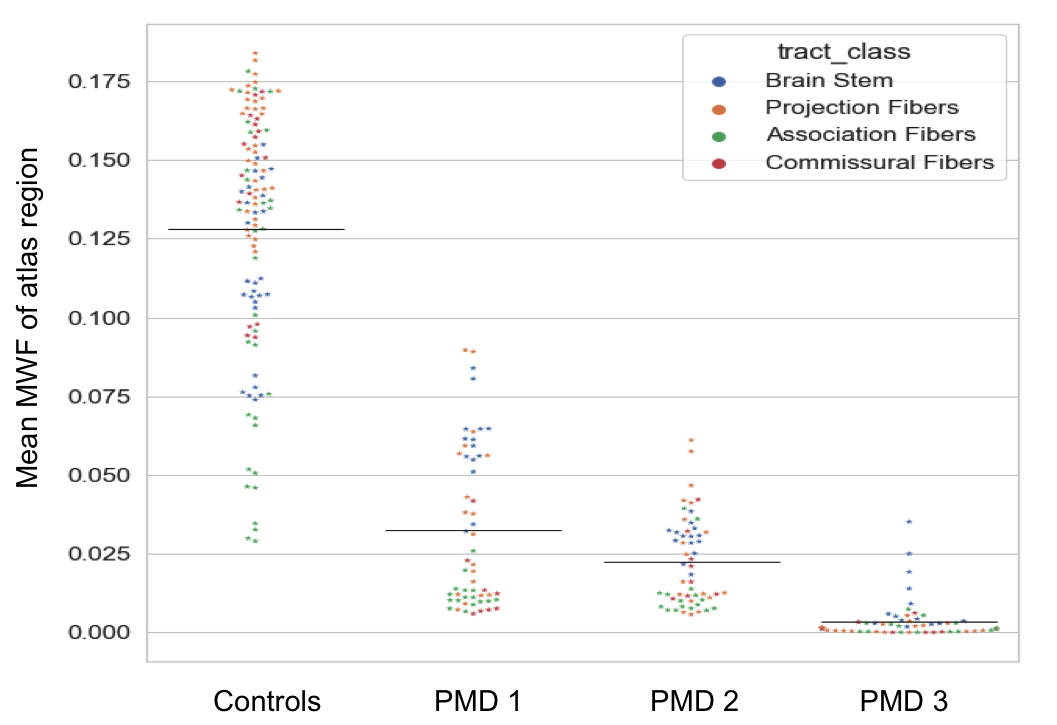
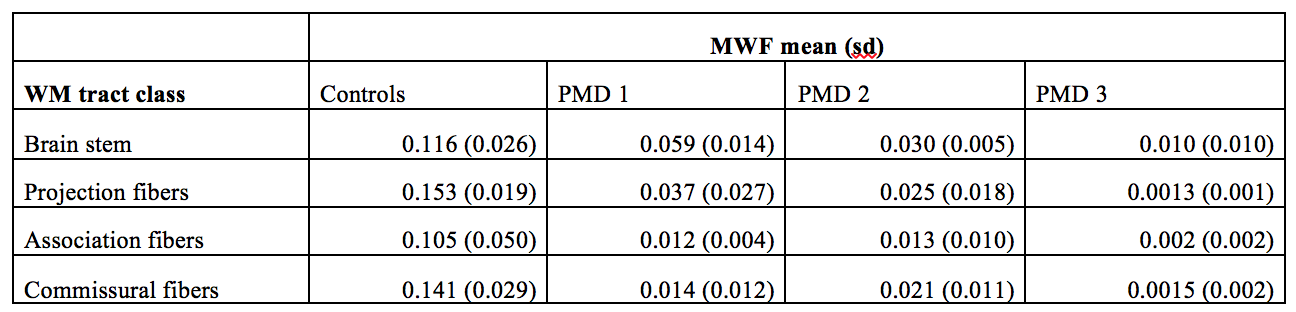
MWF distribution in WM regions of healthy controls and three PMD patients is illustrated in Fig. 2. MWF in PMD patient were significantly lower (p-value= 5.15*10-43) than in controls. Brain stem regions and some projection fibers especially corticospinal tract had highest MWF in PMD patients. Interestingly commissural fibers connecting right and left hemisphere showed low MWF values (Fig. 4). Inter-patient MWF variability was observed in PMD patients, with PMD 3 showing the lowest MWF levels and having the most severe neurological symptoms.Discussion
Myelination in healthy children begins in the brainstem and proceeds rapidly in early childhood in WM structures such as the connections of the cerebral cortex with the thalamus, pons and spinal cord (projection fibers), as well as cross-connections between brain hemispheres (commissural fibers). In contrast, in PMD patients, myelination processes are severely compromised and projection and commissural fibers lag behind brainstem myelination.Conclusion
MWI seems to be useful parameter to facilitate our understanding of myelination processes in WM diseases such as PMD in different brain regions. It could serve as a promising biomarker to further explore hypomyelinating disorders and to monitor myelin specific therapies.Acknowledgements
Supported by European Leukodystrophies Association (ELA) research grant 2019.References
[1] Deoni SC, Rutt BK, Arun T, Pierpaoli C, et al., Gleaning multicomponent T1 and T2 information from steady-state imaging data. Magn Reson Med. (2008); 6:1372-87
[2] Deoni SC, et al. (2012). Investigating white matter development in infancy and early childhood using myelinwater faction and relaxation time mapping. NeuroImage 63. (2012) 1038–1053
[3] Gorgolewski K, et al .. Nipype: a flexible, lightweight and extensible neuroimaging data processing framework in Python. Front. Neuroimform. 2011. 5:13
[4] Gorgolewski K, et al .. BIDS apps: Improving ease of use, accessibility, and reproducibility of neuroimaging data analysis methods. Plos Computational Biology.2017
[5] Avants B. et al. A reproducible evaluation of ANTs similarity metric performance in brain image registration. Neuroimage. 2011 Feb 1;54(3):2033-44.
Figures