2876
Longitudinal Fixel-Based Analysis of diffusion MRI in the zQ175 Huntington’s disease mouse model1Bio-Imaging Lab, University of Antwerp, Antwerp, Belgium, 2µNEURO Research Centre of Excellence, University of Antwerp, Antwerp, Belgium, 3Vision-Lab, University of Antwerp, Antwerp, Belgium, 4CHDI Management/CHDI Foundation, Princeton, NJ, United States
Synopsis
Huntington’s disease (HD) is a neurodegenerative disorder that affects motor and cognitive abilities. In this study, we present the outcome of a longitudinal multi-shell DWI investigation of the zQ175 HD mouse model using the diffusion tensor, diffusion kurtosis, and fixel-based analysis. This study reveals microstructural deficits at an early stage of the disease that mainly affect the diffusion tensor in corpus callosum and kurtosis in caudate putamen and grey matter, while fiber cross-section is reduced in major fiber bundles. At a late stage, many white matter fiber bundles show deficits that are indicative of differential myelination and potential axonal pathology.
Introduction
Huntington’s disease (HD) is a neurodegenerative disorder that affects motor and cognitive abilities. In this study, we present the outcome of a longitudinal multi-shell DWI investigation of the zQ175 HD mouse model using the diffusion tensor, diffusion kurtosis, and fixel-based analysis. This study reveals that, microstructural deficits are observed at an early stage of disease and mainly affect the diffusion tensor in corpus callosum and kurtosis in caudate putamen and grey matter, while fiber cross-section is reduced in major fiber bundles. At a late stage, many white matter fiber bundles show deficits that are indicative of differential myelination and potential axonal pathology.Methods
29 HD mice (zQ175+/-) and 29 healthy control littermates (zQ175-/-) were investigated at 3, 6 and 11 months of age (premanifest, disease onset and moderate manifest stage respectively) using multi-shell diffusion MRI. Animals were anesthetized with 1-2% isoflurane in a mixture of N2 and O2 during handling and image acquisition. Body temperature and breathing rate were monitored. Diffusion imaging was performed on a 7T Pharmascan 70/16 USR horizontal MR system (Bruker, Germany) using a multi-shell (b= 700, 1200 and 2800 s/mm2; δ= 4ms, Δ= 12ms) two-shot spin echo DW-EPI sequence with 60 unique diffusion directions across each shell (TE/TR= 23/7000ms). Per scan, 3 b0 images were acquired. Each scan contained 16 horizontal slices (500µm slice thickness) with an in-plane resolution of (200x200)µm2 and a matrix size of [108x100]. Images were pre-processed using Gibbs ringing correction and denoising (MRtrix3.0),4 motion- and distortion correction (FSL6.0), and bias-field correction (ANTs).5 Voxel-level modelling was performed using multi-tissue constrained spherical deconvolution6 in MRtrix3.0. A study-specific population template of the white matter (WM), gray matter (GM) and cerebrospinal fluid (CSF) compartment was built across all ages using iterative non-linear registration in ANTs. Data was statistically compared in Mrtrix3.0 using a fixel-wise two sample t-test. A similar processing pipeline was used before fitting the diffusion data to the DKI model, from which both diffusion tensor and kurtosis metrics were extracted. A voxel-wise two sample t-test was performed on the diffusion/kurtosis maps using FSL6.0 randomise.7 Mean values for each metric were extracted for Huntington vulnerable regions-of-interest (ROI) and statistically compared using a linear mixed model to test for age, genotype, and interaction effects, followed by FDR correction.Results
Voxel and fixel-wise analysis demonstrate widespread significant differences between zQ175-/- (WT) and zQ175+/- (HD) mice at 6 and 11 months of age (Fig.1). White matter structures have lower fractional anisotropy (FA) and axial diffusivity (AD), and increased RD at 11 months of age in zQ175+/- mice. Gray matter structures demonstrate widespread increased mean kurtosis (MK) and axial kurtosis (AK) at 6 months, while at 11 months MK and AK are decreased. In white matter fiber tracts, fiber bundle cross-section is lower in zQ175+/- mice at 6 and 11 months of age.Region-of-interest analysis of the diffusion tensor and kurtosis metrics in corpus callosum (CC), caudate putamen (CPu) and motor cortex which are relevant regions in HD pathology, shows that in zQ175+/- mice FA is lower, and RD increased in the CC at 6 and 11 months. No genotype differences except increases of mean kurtosis (MK) are found for the CPu. However, in the motor cortex MD and AD significantly decreased at 6 and 11 months (Fig.2-3), and FA significantly decreased at 11 months. The Tract-of-interest analysis reveals that FD increased and FC decreased in CPu at 3 months of age (Fig.4), which is earlier than the diffusion tensor and kurtosis metrics. FD and FC significantly decreased in CC, and FC significantly decreased in CPu at 6 and 11 months. FC significantly decreased in the motor cortex at 6 months.
Discussion & Conclusion
This longitudinal characterization of the zQ175+/- HD mouse model reveals that most structural deficits are present at 6 months of age when the animals exhibit their first motor deficits (Fig.5). At this stage, the structural phenotypes are best captured by decrease of FA and increase of RD in CC, increase of MK and decrease of FC in CPu, and decrease of FD and/or FC in major fiber bundles. At the moderate manifest stage (11 months), pathology has a more widespread effect on white matter fiber bundles, displayed as a decrease in FA and increase in RD, suggesting differential myelination. At the moderate manifest stage, the increase in the kurtosis parameters is no longer present, while FD, FC and FDC remain decreased, which suggests that the microstructural complexity and axon bundle density and cross-section are reduced. The non-linear changes in FA and kurtosis metrics are counterintuitive, however, such changes have been reported in fMRI in HD.8,9 DTI studies in Parkinson’s disease, which is also a neurodegenerative motor disorder, suggest potential (early) compensatory mechanisms could be involved.10 Immunohistochemistry is planned to investigate what is causing these microstructural deficits.Acknowledgements
This research was supported by the CHDI Foundation, Inc. The computational resources and services used in this work were provided by the HPC core facility CalcUA of the Universiteit Antwerpen, and VSC (Flemish Supercomputer Center), funded by the Research Foundation - Flanders (FWO) and the Flemish Government.References
1. Bates, G. P. et al. Huntington disease. Nat. Rev. Dis. Prim. 1, 1–21 (2015).
2. Estevez-Fraga, C., Scahill, R., Rees, G., Tabrizi, S. J. & Gregory, S. Diffusion imaging in Huntington’s disease: comprehensive review. J. Neurol. Neurosurg. Psychiatry jnnp-2020-324377 (2020).
3. Raffelt, D. A. et al. Investigating white matter fibre density and morphology using fixel-based analysis. Neuroimage 144, 58–73 (2017).
4. Tournier, J. D. et al. MRtrix3: A fast, flexible and open software framework for medical image processing and visualisation. Neuroimage 202, 116137 (2019).
5. Tustison, N., Avants, B., Cook, P., Zheng, Y., Egan, A., Yushkevich, P. & Gee, J. N4ITK: Improved N3 Bias Correction. IEEE Transactions on Medical Imaging, 29, 1310-1320 (2010).
6. Jeurissen, B., Tournier, J.D., Dhollander, T., Connelly, A. & Sijbers, J. Multi-tissue constrained spherical deconvolution for improved analysis of multi-shell diffusion MRI data. Neuroimage 103, 411-426 (2014).
7. Winkler, A. M., Ridgway, G. R., Webster, M. A., Smith, S. M. & Nichols, T. E. Permutation inference for the general linear model. Neuroimage 92, 381–397 (2014).
8. Pini, L., Jacquemot, C., Cagnin, A., Meneghello, F., Semenza, C., Mantini, D. & Vallesi, A. Aberrant brain network connectivity in presymptomatic and manifest Huntington's disease: A systematic review. Human Brain Mapping 41, 256-269 (2020).
9. Gregory, S., Long, J.D., Tabrizi, S.J. & Rees, G. Measuring compensation in neurodegeneration using MRI. Curr Opin Neurol 30, 380-387 (2017).
10. Moghaddam, H.S., Dolatshahi, M., Mohebi, F., Aarabi, M.H. Structural white matter alterations as compensatory mechanisms in Parkinson's disease: A systematic review of diffusion tensor imaging studies. J Neurosci Res. 98, 1398-1416 (2020).
Figures
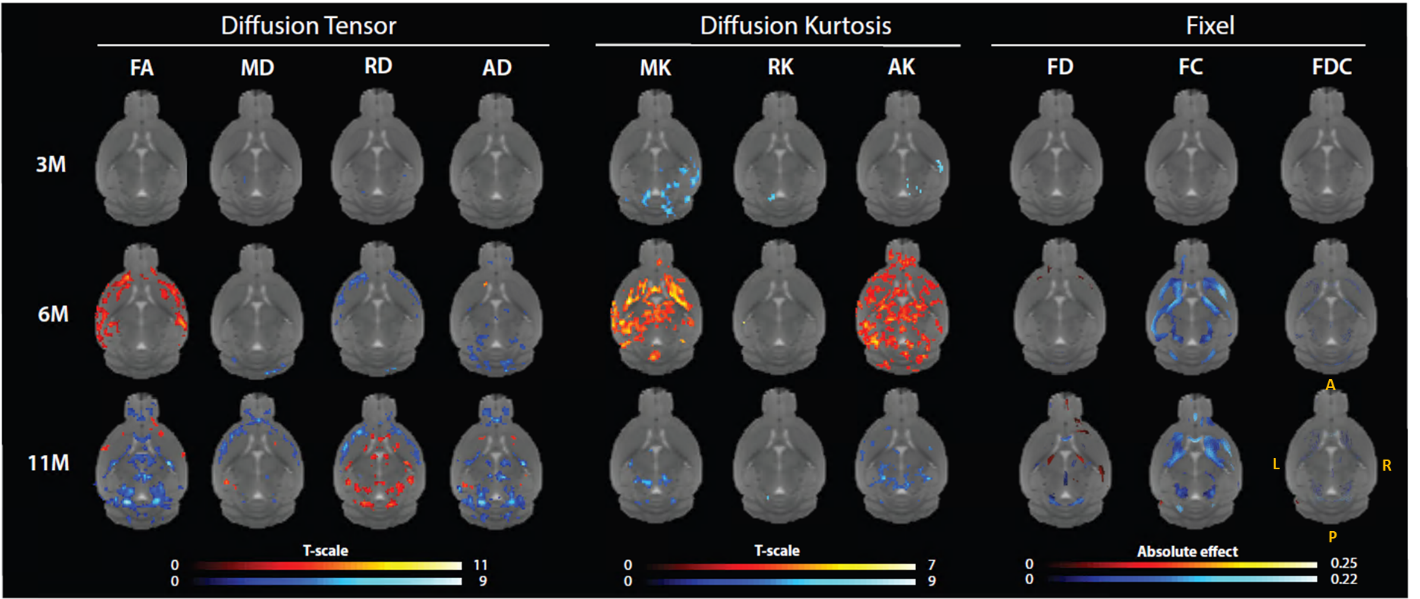
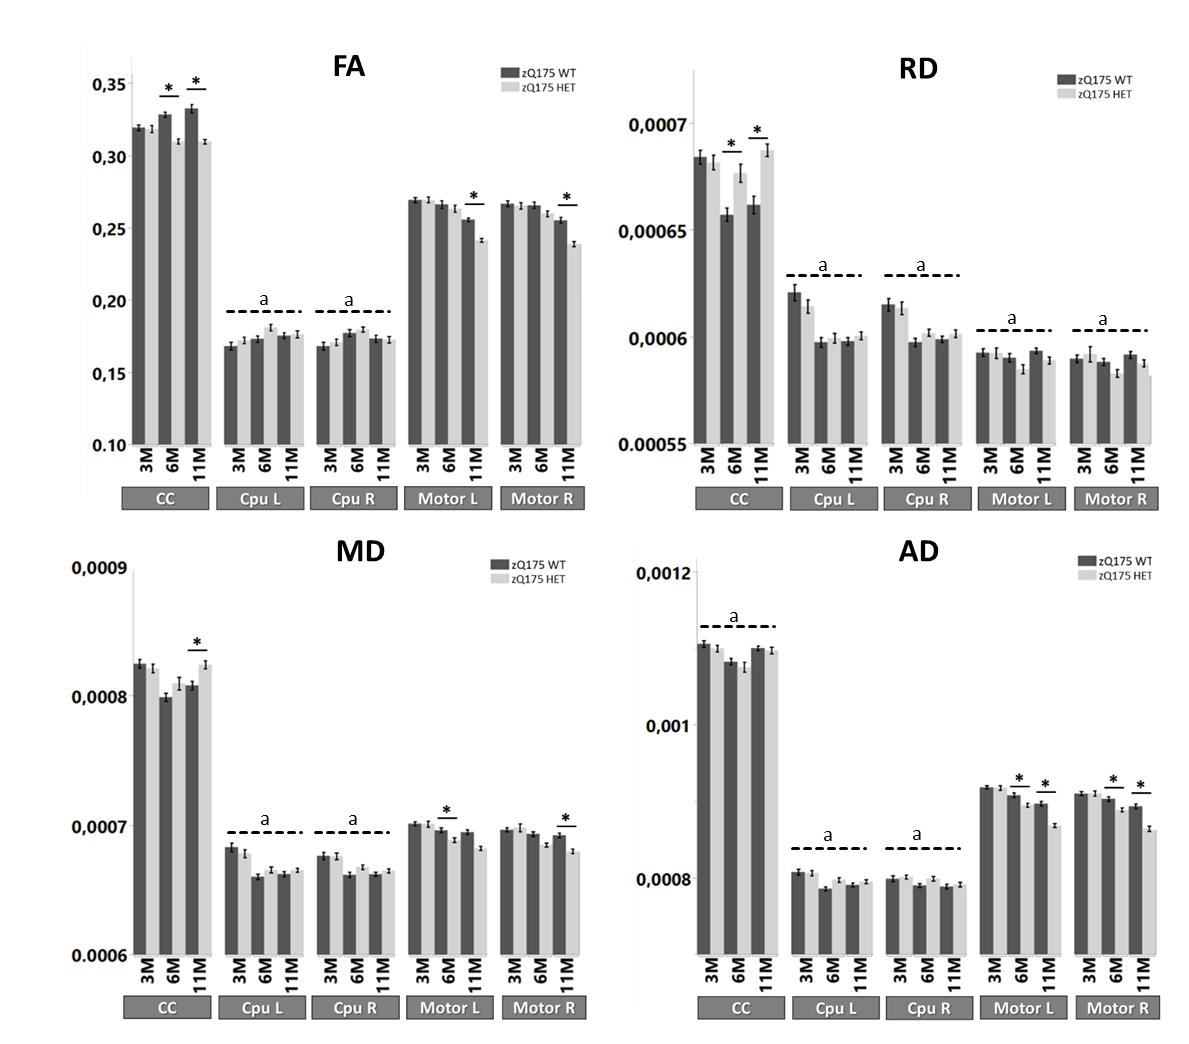
Figure 2: ROI-based analysis of diffusion tensor data in HD relevant regions. Analysis is performed separately for fractional anisotropy (FA), radial diffusivity (RD, 10-3 mm2/s), mean diffusivity (MD, 10-3 mm2/s), and axial diffusivity (AD, 10-3 mm2/s). zQ175-/- (WT) mice are shown in dark gray and zQ175+/- (HD) animals are shown in light grey. Asterisks indicate significant post-hoc differences (P<0.05) between genotypes per timepoint. Dotted lines labelled a indicate significant main effects of age (P<0.05), regardless of genotype. Error bars indicate the SEM.
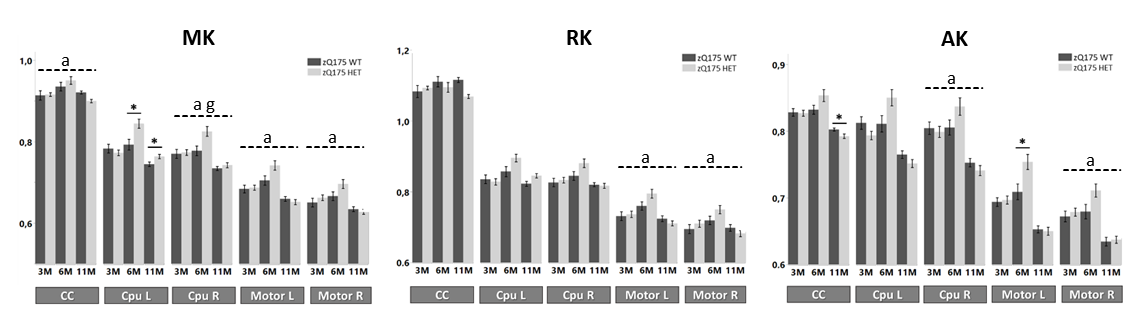
Figure 3: ROI-based analysis of diffusion kurtosis data in HD relevant regions. Analysis is performed separately for mean kurtosis (MK), radial kurtosis (RK) and axial kurtosis (AK). zQ175-/- (WT) mice are shown in dark gray and zQ175+/- (HD) animals are shown in light grey. Asterisks indicate significant post-hoc differences (P<0.05) between genotypes per timepoint. Dashed lines indicate a significant (P<0.05) main effect of age (a) or genotype (g). Error bars indicate the SEM.
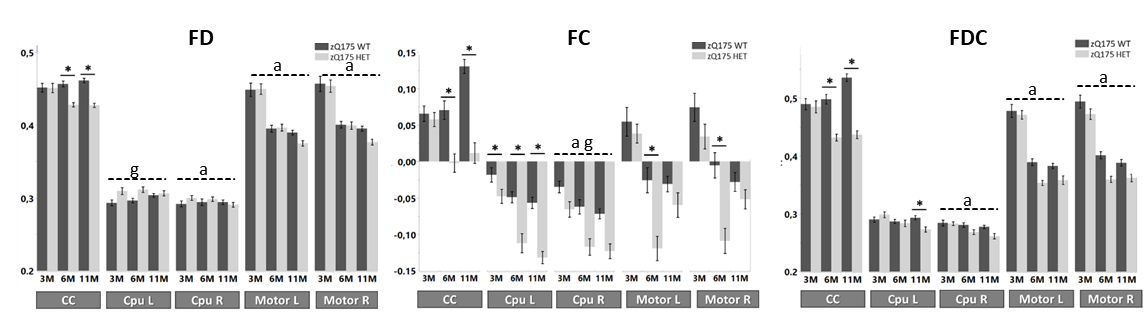
Figure 4: Tract-based comparison of fixel-based data in five HD relevant regions. Analysis is performed separately for fiber density (FD), fiber cross-section (FC) and fiber density x cross-section (FDC). zQ175-/- (WT) mice are shown in dark gray and zQ175+/- (HD) animals are shown in light grey. Asterisks indicate significant post-hoc differences (P<0.05) between genotypes per timepoint. Dashed lines indicate a significant (P<0.05) main effect of age (a) or genotype (g). Error bars indicate the SEM.
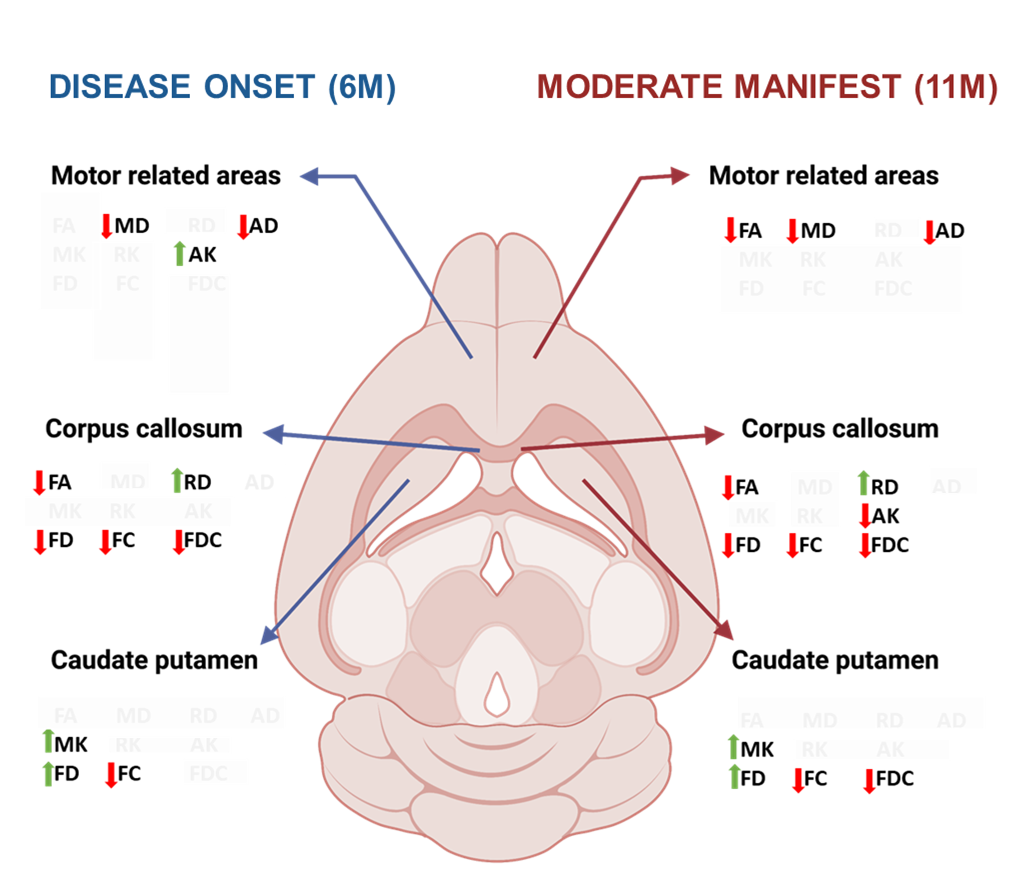
Figure 5: Schematic overview of pathological micro-and microstructural features in HD relevant regions. Comparisons are summarized from figures 2 – 4. Left side: changes in diffusion parameters in disease onset. Right side: changes in diffusion parameters in the moderate manifest stage. Significantly different parameters are paired with arrows indicating an increase (green) or decrease (red) for a specific metric. Figure created with BioRender.com.