2875
Characterising Brain White Matter Alterations in Type 2 Diabetes: A UK Biobank Study of Neurite Orientation Dispersion and Density Imaging.1Clinical Neurosciences, University of Nottingham, Nottingham, United Kingdom, 2Radiological Sciences, King Saud bin Abdulaziz University for Health Sciences, Riyadh, Saudi Arabia, 3Precision Imaging Beacon of Excellence, Nottingham, United Kingdom, 4Neurology, Cooper University Hospital, Camden, NJ, United States, 5NIHR Nottingham Biomedical Research Centre, Nottingham, United Kingdom
Synopsis
Type 2 diabetes is a metabolic disorder associated with subtle microstructural alteration of brain white matter. Diffusion tensor imaging (DTI) has been widely applied to evaluate white matter microstructural pathology in type 2 diabetes; however, DTI has limitations and lacks specificity. Using UK Biobank data, we applied neurite orientation dispersion and density imaging (NODDI) as an alternative advanced diffusion method to overcome DTI limitations. In this study, NODDI showed its potential role in giving a better biophysical characterisation of white matter neuroaxonal pathology in type 2 diabetes compared to DTI.
Background
Type 2 diabetes mellitus impacts the brain microstructural environment. Diffusion tensor imaging (DTI) has been widely used to characterize white matter microstructural abnormalities in type 2 diabetes1,2 but fails to fully characterise disease effects on complex white matter tracts3,4. Neurite orientation dispersion and density imaging (NODDI) has been proposed to characterize white matter microstructures precisely5. Although NODDI has not been widely applied in diabetes, this diffusion model has the potential for investigating the complexity of white matter pathology. Aims and objectives: (1) to investigate brain white matter alterations in patients with type 2 diabetes using NODDI; (2) to assess the association between white matter changes in diabetes with disease duration and glycated haemoglobin (HbA1c).Methods
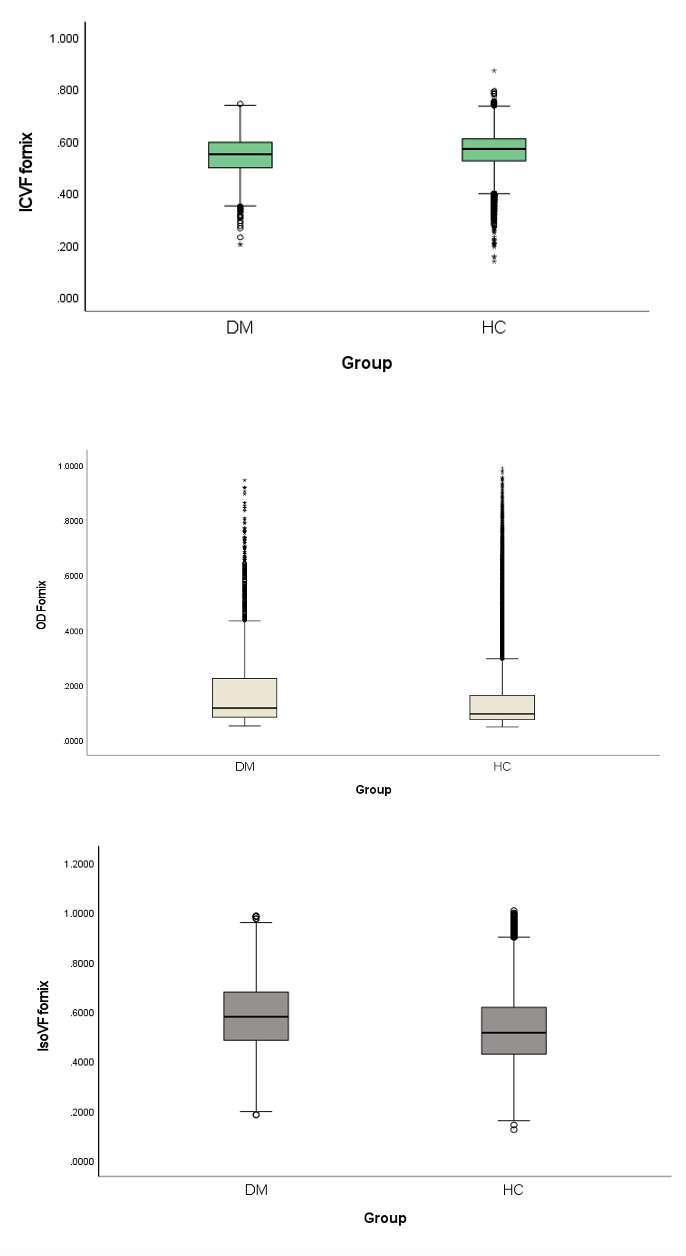
We examined 48 white matter tracts separately using diffusion measures derived from the UK Biobank in 3338 patients with type 2 diabetes (36.34% women, mean age 65.85 years) and 31471 healthy controls (53.92% women, mean age 63.71 years). Participants underwent 3.0T multiparametric brain imaging (T1 weighted imaging and diffusion imaging for NODDI). Region of interest analysis of orientation dispersion index (ODI), intracellular volume fraction (ICVF) and isotropic water fraction (IsoVF) was conducted to assess white matter abnormalities. A general linear model was performed after controlling for age and sex to evaluate intergroup white matter differences and their association with the metabolic profile.Result
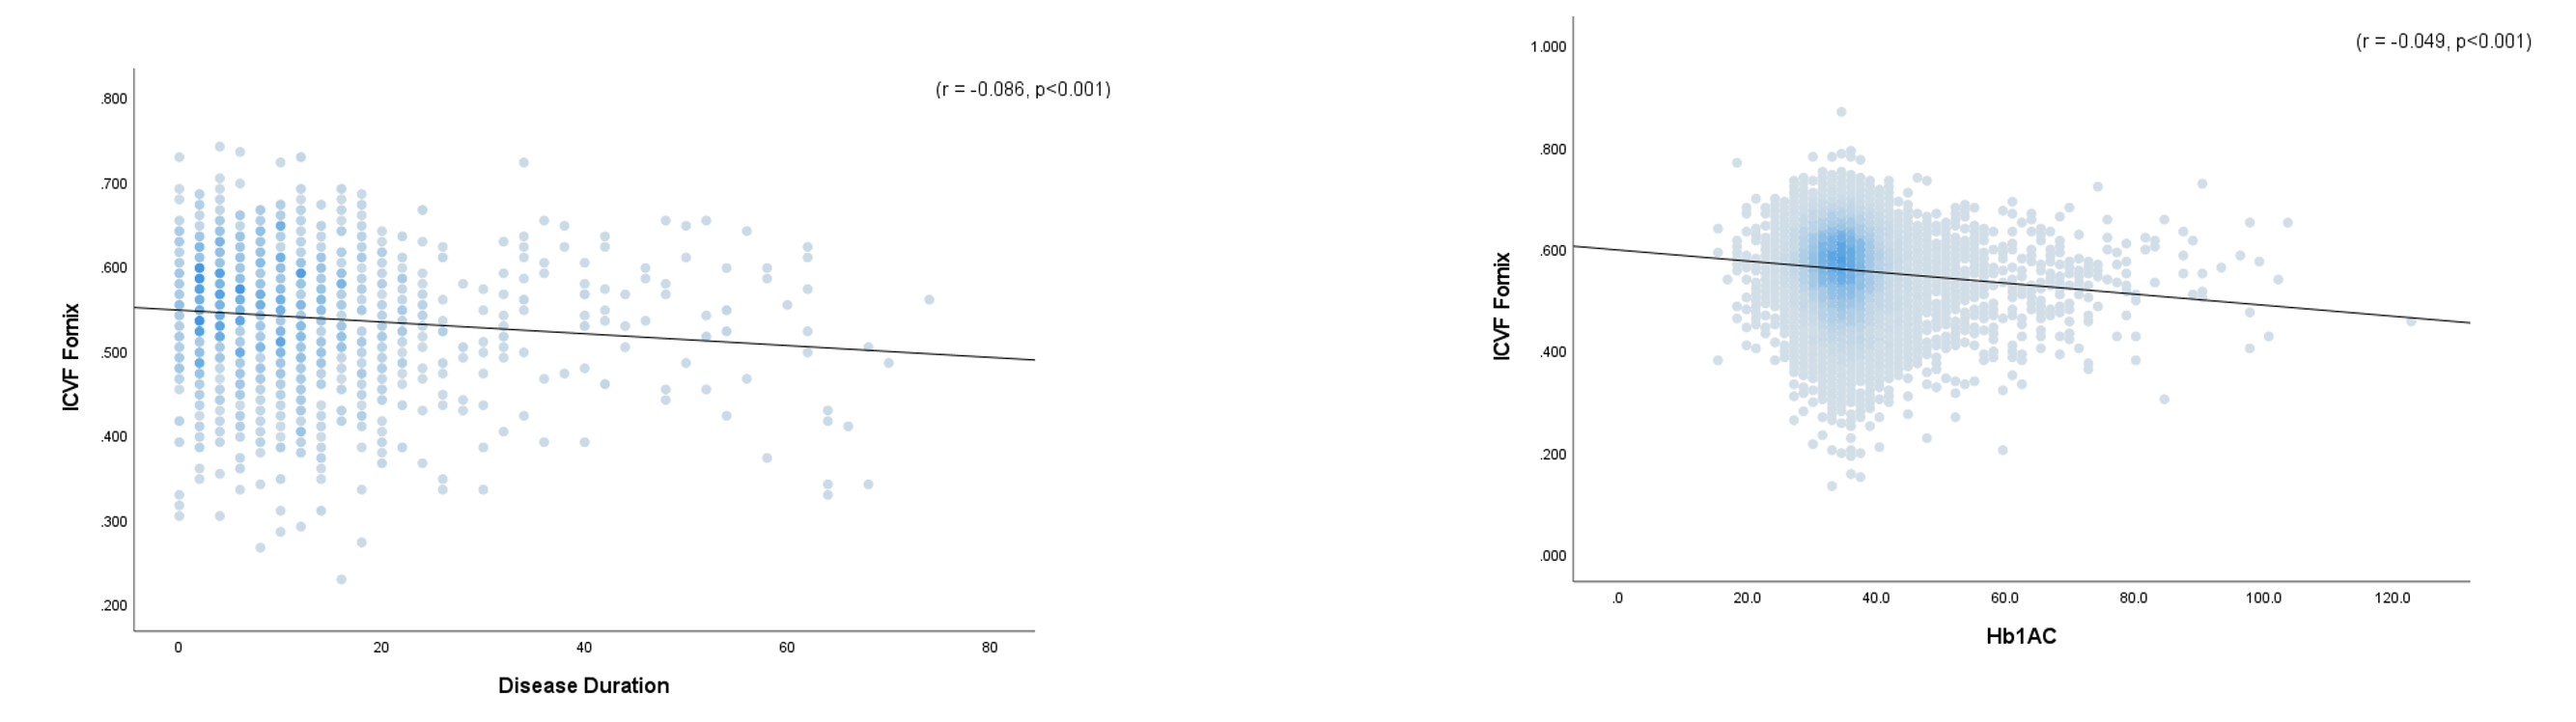
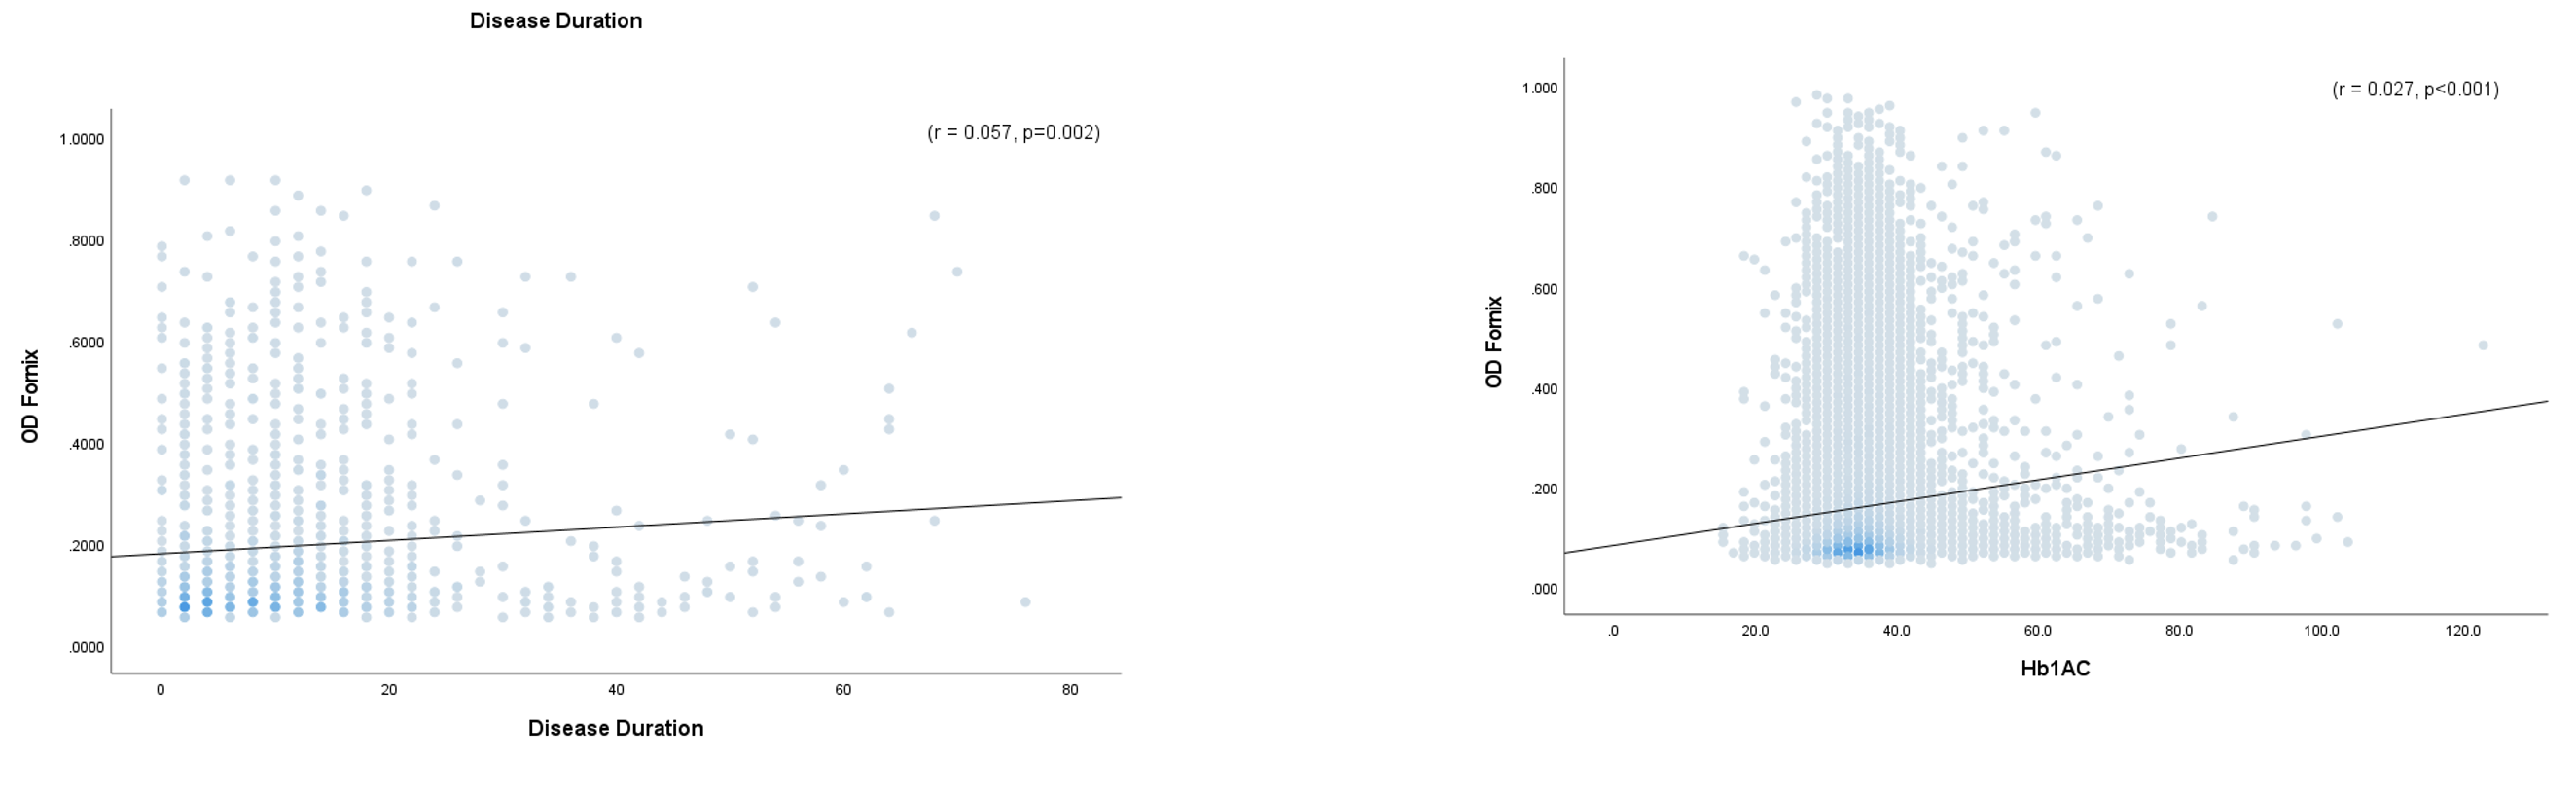
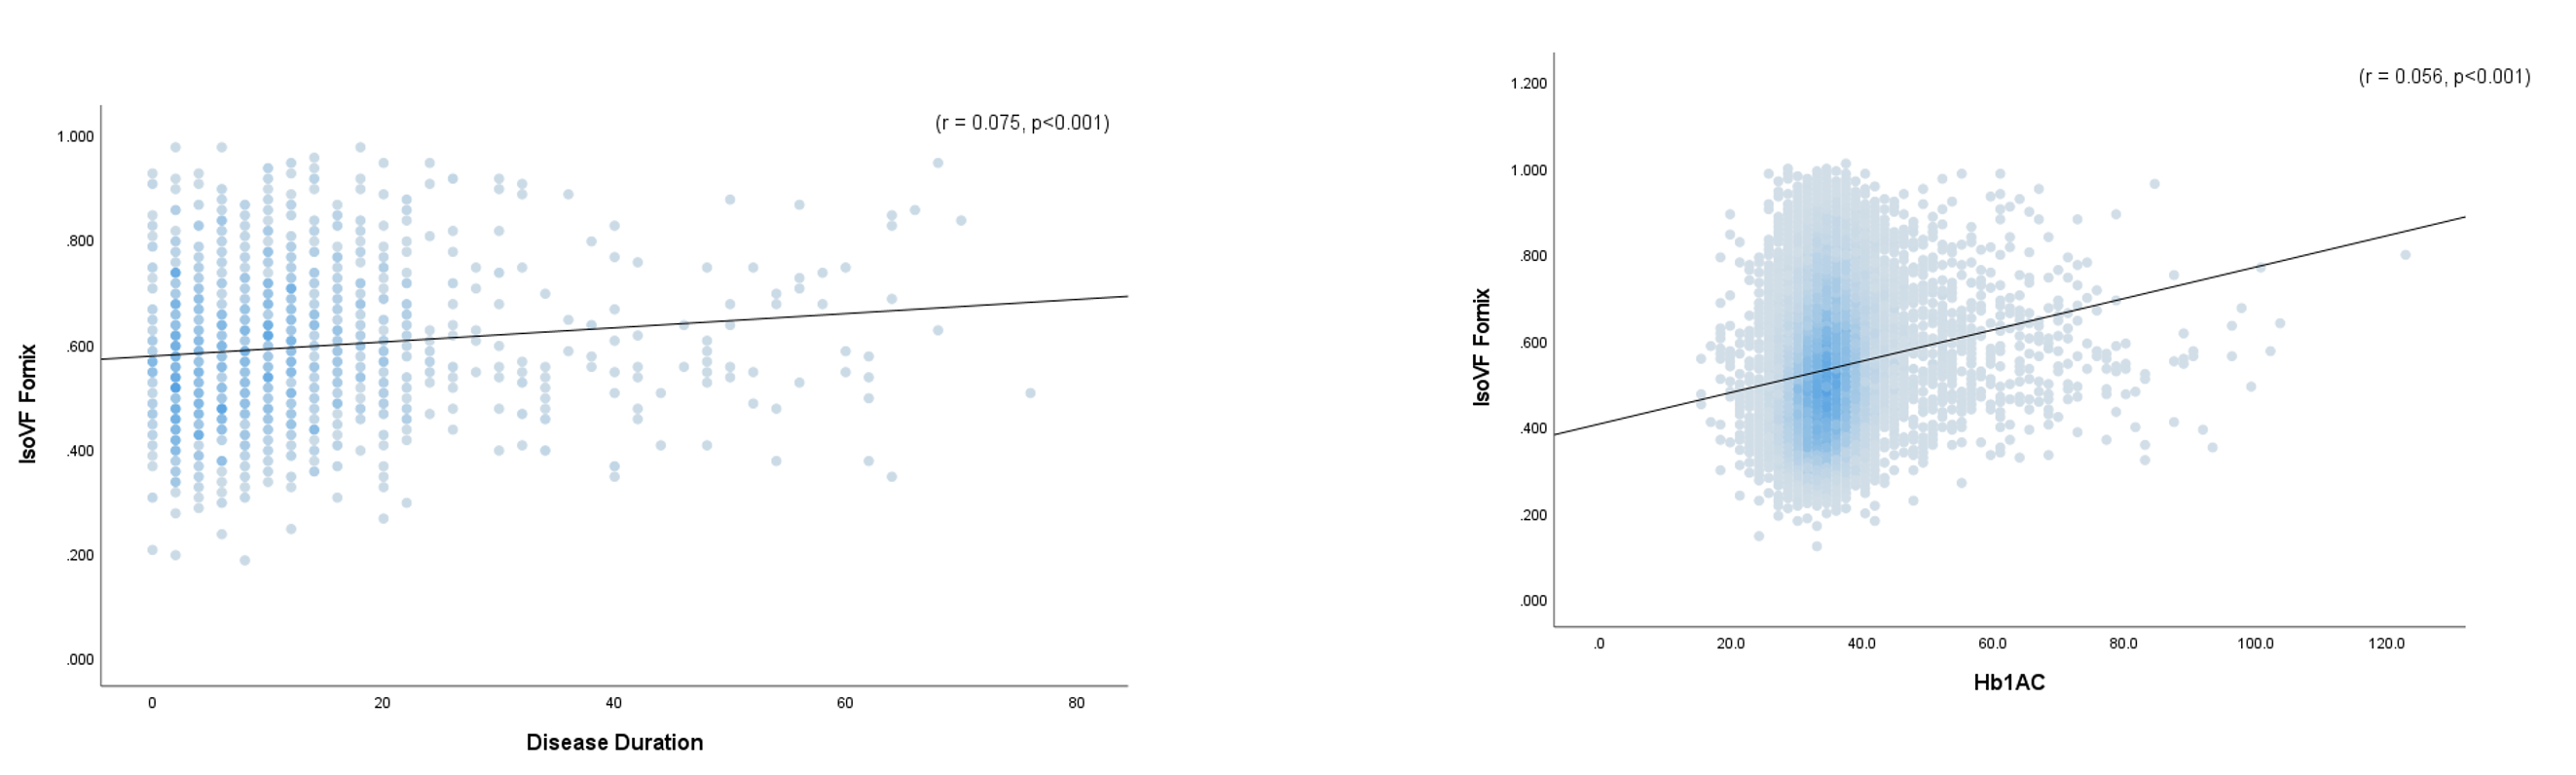
Reduced ICVF, increased ODI, and increased IsoVF values were observed in patients with type 2 diabetes (P<0.05). Reduced ICVF in most white matter tracts had a weak negative correlation with disease duration and HbA1c. However, HbA1c had a positive association with increased ICVF in the right cerebral peduncle (r = .027, p≤0.001) and left cerebral peduncle (r =.022, p≤0.001). Increased ODI in most white matter tracts was associated negatively with disease duration; however, a positive correlation was found in the fornix (r = .057, p≤0.002), right and left posterior thalamic radiation (r = .050, p≤0.005). ODI was positively correlated with HbA1c in most white matter tracts. However, negative association was seen in right superior corona radiata (r = -.017, p≤0.003) and left superior corona radiata (r = -.018, p≤0.001). Also, IsoVF correlated positively and negatively with disease duration and HbA1c.Discussion
NODDI detected microstructural changes of brain white matter in patients with type 2 diabetes. The abnormalities revealed included lower axonal density, less coherence of fibre orientation, and edema, which correlated with longer disease duration and an index of poorly-controlled blood sugar. NODDI showed white matter differences in complex tracts such as pontine crossing, bilateral medial lemniscus, bilateral limbs of internal capsules, and bilateral cingulum and hippocampus.Conclusion
Type 2 diabetes can cause white matter microstructural abnormalities that have associations with the metabolic profile. The NODDI diffusion model allows characterisation of white matter neuroaxonal pathology in type 2 diabetes, giving biophysical information for understanding the impact of type 2 diabetes on brain microstructure and providing a potential imaging biomarker for monitoring type 2 diabetes progression.Acknowledgements
This work was supported in part by the ongoing Multimodal Analysis of the UK Biobank Neuroimaging Data project, which has been led by Dr. Stam Sotiropoulos. Also, it has been financially supported by Nottingham Hospitals Charity (APP 1666/N0185), and King Saud Bin Abdul-Aziz University for Health Sciences in Saudi Arabia.References
1. Alotaibi A, Tench C, Stevenson R, et al. brain sciences Review Investigating Brain Microstructural Alterations in Type 1 and Type 2 Diabetes Using Diffusion Tensor Imaging: A Systematic Review. Published online 2021. doi:10.3390/brainsci110201402.
2. Sanjari Moghaddam H, Ghazi Sherbaf F, Aarabi MH. Brain microstructural abnormalities in type 2 diabetes mellitus: A systematic review of diffusion tensor imaging studies. Front Neuroendocrinol. Published online 2019. doi:10.1016/j.yfrne.2019.1007823.
3. Alexander AL, Hasan KM, Lazar M, Tsuruda JS, Parker DL. Analysis of partial volume effects in diffusion-tensor MRI. Magn Reson Med. 2001;45(5):770-780. doi:10.1002/mrm.11054.
4. Xiong Y, Sui Y, Zhang S, et al. Brain microstructural alterations in type 2 diabetes: diffusion kurtosis imaging provides added value to diffusion tensor imaging. Eur Radiol. 2019;29(4):1997-2008. doi:https://dx.doi.org/10.1007/s00330-018-5746-y5.
5. Zhang H, Schneider T, Wheeler-Kingshott CA, Alexander DC. NODDI: Practical in vivo neurite orientation dispersion and density imaging of the human brain. Neuroimage. 2012;61(4):1000-1016. doi:10.1016/j.neuroimage.2012.03.072
Figures