2871
Motion-Dependent Low-Order Predictive Linear Model for Patient Safety Assessment at 7T with Technically Feasible Coil Models1Biomedical Engineering Department, School of Biomedical Engineering and Imaging Sciences, King's College London, LONDON, United Kingdom, 2London Collaborative Ultra high field System (LoCUS), London, United Kingdom, 3Centre for the Developing Brain, School of Biomedical Engineering and Imaging Sciences, King's College London, London, United Kingdom
Synopsis
Establishing a comprehensive model that addresses patient safety at UHF MRI with respect to motion is a non-trivial task because of the underlying computationally expensive frameworks. Using MARIE we computed a large number of pose simulations of 3 feasible coil models (birdcage, 4-channel and 8-channel pTx) in proximity to Duke body model to allow the parameter space to be well explored. It is found that a low order linear model can capture most of the variation in cpB1+. We also observe low variations in cpSAR for 2 realistic coil models across the conditions examined, with 8-channel coil being most robust.
Introduction
Patient safety assessment for parallel transmit (pTx) at ultra-high field (UHF) MRI with respect to different patient positioning is difficult to capture comprehensively, since most governing protocols rely on computationally expensive electromagnetic (EM) simulations, though a few studies have tackled the problem[5,6,7]. The most comprehensive such study to date investigates patient head motion for an 8-channel coil model with different shims[5] and shows that safety metrics, such as head-averaged SAR (hdSAR) and peak local SAR (plSAR), may significantly vary with the motion parameters, especially along certain directions. We have previously shown[8,9] that for a 4-channel coil, plSAR can deviate up to 2-fold, so being able to predict field variabilities is of great interest to the community at the moment. This study aims to assess spatial variability of RF magnetic field (B1+) and SAR to patient's head motion in 6 degrees of freedom (DOFs) for technically feasible coils and propose a low-order linear model to address the variability.Methods
EM simulations were performed using MARIE [1] with MR Green’s Functions (MRGFs) that enable fast coil simulations for a given body model (here Duke[4]). We simulated a 2-channel shielded birdcage coil (2chBCC), 4-channel (4chPTX) and 8-channel (8chPTX) planar loop arrays, which were tune-and-matched to 298MHz using circuit-co-simulation[2,3]. Patient motion is modelled by displacing/rotating the coils and keeping the model fixed. The coils are displaced independently across 6DOFs to simulate on-axis motion, providing a total of 126 positions with respect to head for every coil model. We focused our analysis on the circularly polarized (CP) shim computed for the central coil position for a mid-brain slice. B1+ variation with coil position is modelled using a 1st order Taylor expansion model:$$B_1^+(\mathbf{r})=B_1^0+\alpha\mathbf{\Delta{}r}\quad\quad\quad[1]$$
The robustness of the 1st order linear model applied separately to the shift in x and y is tested against the actual 2D motion data that was simulated in off-axis transverse plane. In total, we simulated 126 on-axis and 384 off-axis coil positions for the realistic coil models (8chPTX and 2chBCC), and a total of 1847 off-axis coil perturbations for the simplistic 4chPTX to investigate SAR variability. We look at the linearity maps per degree or mm to help visualise the variation.
We also acquired experimental cpB1+ maps of a healthy volunteer’s brain on a 7T scanner (MAGNETOM Terra, Siemens Healthcare) using 8TX-32RX head coil (Nova Medical, Wilmington MA, USA) with AFI[10]. The AFI maps were reconstructed using sensitivity weighted coil combined parallel images[11] and then registered with rigid registration using 6 motion parameters.
Results and Discussion
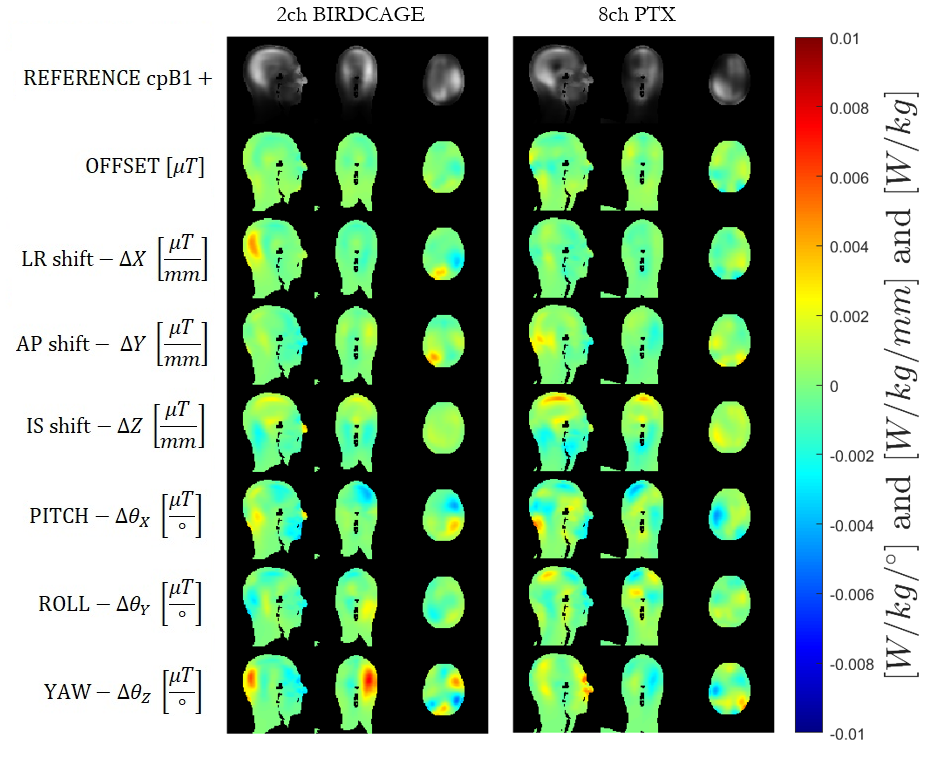
Figure 1 illustrates maps of linear coefficients 𝜶. B1+ variations are quite small in general, but larger for rotations (per degree) than translations (per mm). The highest variation appears at the back of the head, while the highest similarity among the two simulated coils and the experiment is for the LR shifts. The simulations were computed from ideal on-axis motion, while the experimental data was regressed from situations in which the volunteer’s head moved in all DOFs, so may contain some systematic errors. Furthermore, the simulated coil models are very simplistic.Figure 2 shows simulated B1+ for the model shifted by 10 mm in x and y, compared with the linear model prediction applied to both dimensions separately (i.e. ignoring cross terms). The 1st order model is adequate to describe small perturbations. The linear model appears to slightly better describe cpB1+ variation for birdcage coil than for the 8chPTX. Another study[6] showed that a model can be trained to learn cpB1+ variation using machine learning techniques and further demonstrated that pulse design changes with small variations in B1+.
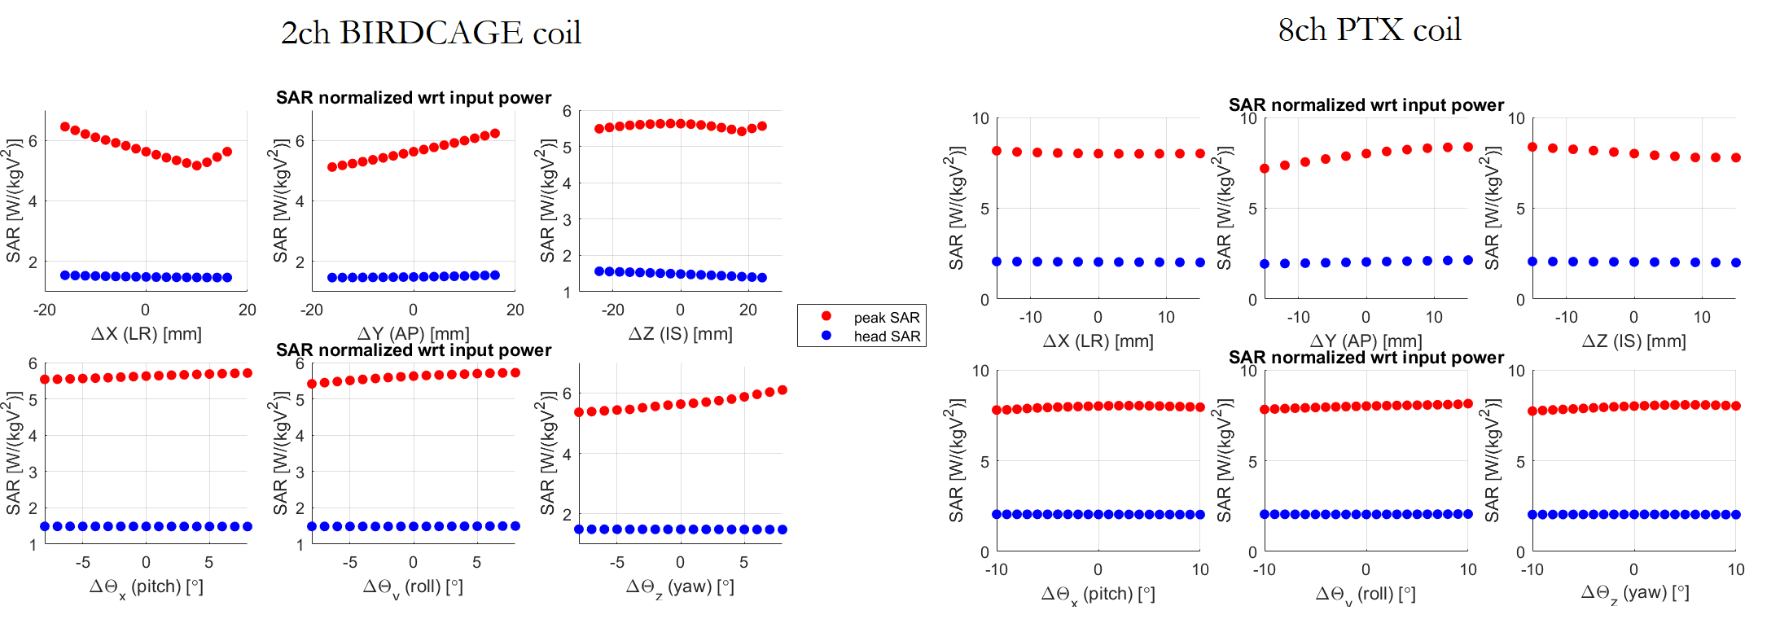
Fig.3 illustrates the variation in 10g-averaged SAR(SAR10g) for both coil models (pTx coil is in CP mode). Yaw (rotations around z) and LR shifts give the largest variation in SAR10g for the birdcage coil, while the 8chPTX is generally less variable apart from shifts in IS direction. Variation is highest at the back of the head for LR shifts and rotations around IS axis for the 2chBCC and top of the head, neck and ear areas for the 8chPTX.
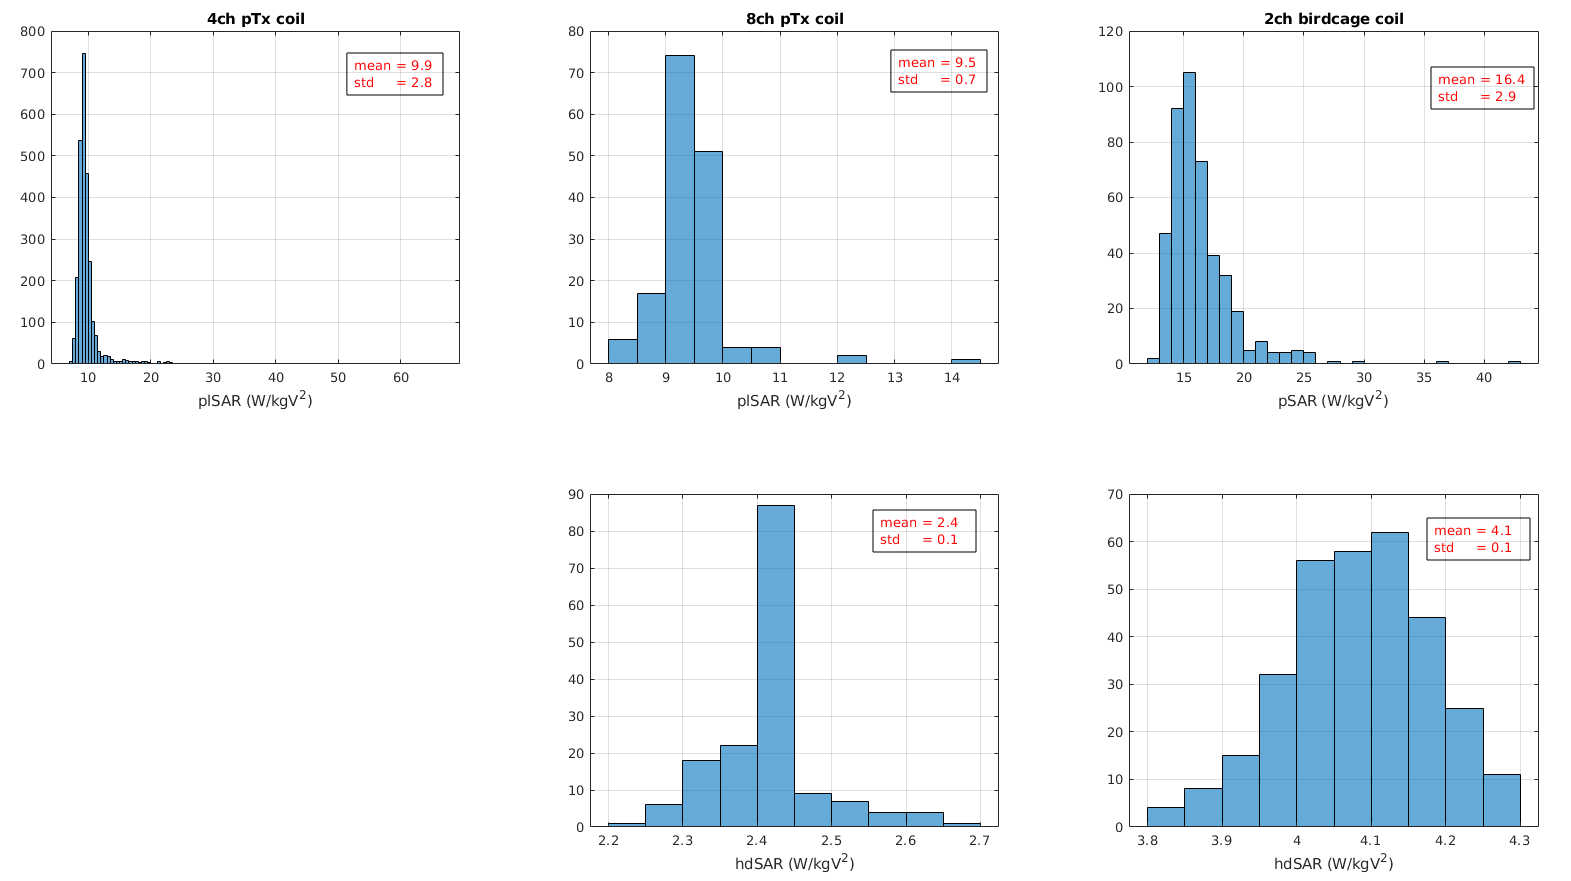
Quantitative analysis of the plSAR and hdSAR in Fig.4 shows that the variations are below 10% of the central pose plSAR. Furthermore, the ratios of the plSAR to the hdSAR remain around 4, suggesting that for both coil models, plSAR should be the limiting factor in addressing patient safety rather than hdSAR, though this would change in first level control mode. Interestingly, Kopanoglu[5] showed higher variation in AP direction for 8chPTX coil than our study shows, but similarly agrees on the shifts along IS axis. Further investigation on normalizations and coil-body parameters would be needed to understand where these differences come from. Finally, Fig.5 further demonstrates that, of the 3 models explored, the 8chPTX plSAR is the most robust to off-axis changes, with mean in plSAR observed to be the highest in 2chBCC.
Conclusion
We computed a large number of pose simulations to allow the parameter space to be well explored for 3 different coil types. A low order linear model captured most of the variation in cpB1+. We observed low variations in cpSAR for 2 realistic coil models across the conditions examined.Acknowledgements
The authors wish to thank Alexis Amadon and Franck Mauconduit (NeuroSpin, CEA Paris-Saclay, Gif-sur-Yvette, France) for providing the AFI sequence and reconstruction.
This work is funded by the King’s College London & Imperial College London EPSRC Centre for Doctoral Training in Medical Imaging (EP/L015226/1). This work was supported by the core funding from the Wellcome/EPSRC Centre for Medical Engineering [WT203148/Z/16/Z] and by the National Institute for Health Research (NIHR) Biomedical Research Centre based at Guy’s and St Thomas’ NHS Foundation Trust and King’s College London and/or the NIHR Clinical Research Facility. The views expressed are those of the author(s) and not necessarily those of the NHS, the NIHR or the Department of Health and Social Care.
References
[1] Villena, J F, Polimeridis A G, Eryaman Y, Adalsteinsson E, Wald L L, White J K, Luca Daniel D. (2016). Fast Electromagnetic Analysis of MRI Transmit RFCoils Based on Accelerated Integral Equation Methods. IEEE Transactions on Biomedical Engineering, 63(11), 2250-2261.;
[2] Kozlov M, Turner R. (2009). Fast MRI coil analysis based on 3‐D electromagnetic and RF circuit co‐simulation. J Magn Reson. 200, 147–152.
[3] Beqiri A, Hand J W, Hajnal J V, Malik S J, Comparison between simulated decoupling regimes for speciffic absorption rate prediction in parallel transmit MRI. Magn. Reson. Med., 74(5), 1423–1434.
[4] Christ A et al. (2009).The Virtual Family—development of surface-based anatomical models of two adults and two children for dosimetric simulations. Phys. Med. Biol. 55 N23
[5] Kopanoglu E, Deniz CM, Erturk MA, Wise RG. Specific absorption rate implications of within-scan patient head motion for ultra-high field MRI. Magn Reson Med. 2020 Nov;84(5):2724-2738.
[6] Plumley A, Watkins L, Murphy K, and Kopanoglu E (2020). Motion-resolved B1+ prediction using deep learning for real-time pTx pulse-design. ISMRM-2021.
[7] Malik SJ, Hand JW, Satnarine R, Price AN, Hajnal JV. (2021). Specific absorption rate and temperature in neonate models resulting from exposure to a 7T head coil. Magn Reson Med. Sep;86(3):1299-1313.
[8] Ajanovic A, Hajnal J, Malik S. (2020). Positional Sensitivity of Specific Absorption Rate in Head at 7T. ISMRM-2020.
[9] Ajanovic A, Tomi-Tricot R, Hajnal J, Malik S. (2021). Motion and Pose Variability of SAR Estimation with Parallel Transmission at 7T. ISMRM-2021.
[10] Hurley, S.A., Yarnykh, V.L., Johnson, K.M., Field, A.S., Alexander, A.L. and Samsonov, A.A. (2012), Simultaneous variable flip angle–actual flip angle imaging method for improved accuracy and precision of three-dimensional T1 and B1 measurements. Magn. Reson. Med., 68: 54-64.
[11] Uecker, M., Lai, P., Murphy, M.J., Virtue, P., Elad, M., Pauly, J.M., Vasanawala, S.S. and Lustig, M. (2014), ESPIRiT—an eigenvalue approach to autocalibrating parallel MRI: Where SENSE meets GRAPPA. Magn. Reson. Med., 71: 990-1001.
Figures
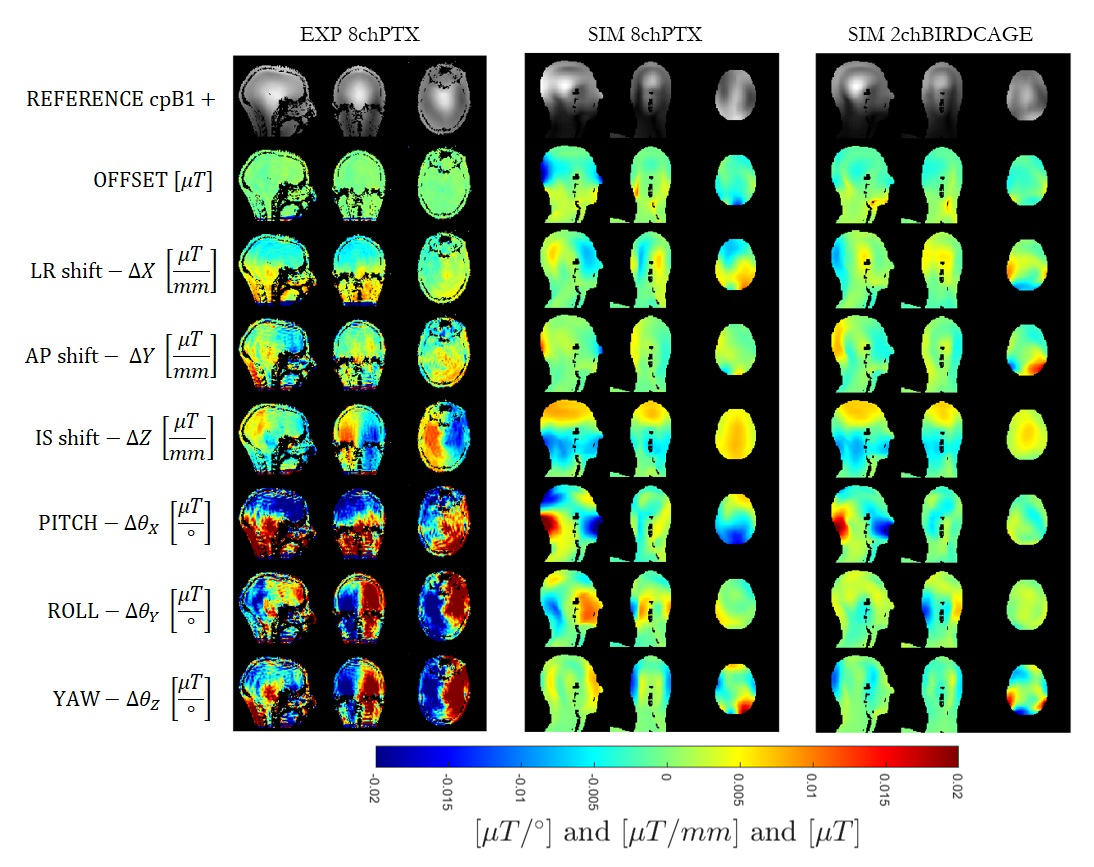
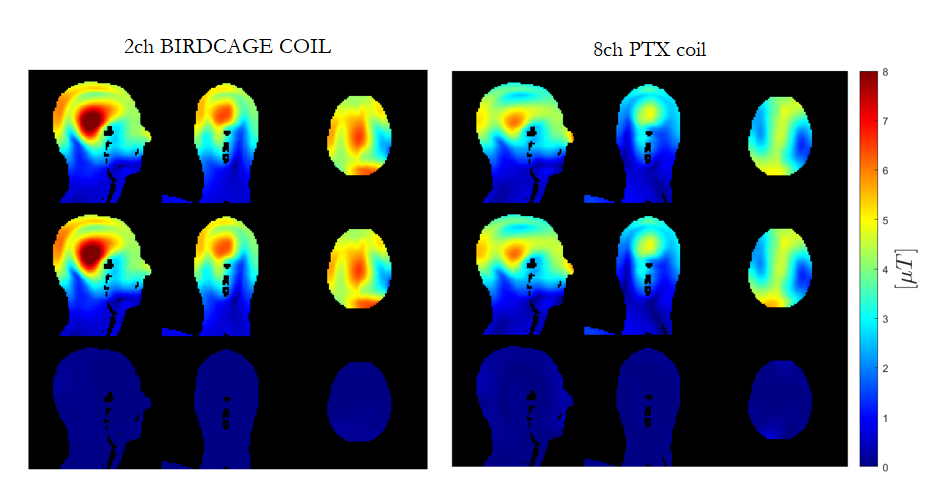
Figure 2: |cpB1+| prediction using linear model on x and y shifts independently versus the simulation in 2 dimensions for the 2-channel birdcage coil (left) and the 8-channel PTX coil (right). Top row: simulated cross-motion in transverse plane (x and y both variable). Middle row: the linear model described by:
B1(X,Y)=B1_{offset}+c1X+c2Y where c1 and c2 are the linear coefficients in $$\mu{}T/mm$$. Bottom row: the difference.