2867
Calibration of saturation prepared turbo FLASH B1+ maps by actual flip angle imaging at 7T.1Centre for the Developing Brain, School of Biomedical Engineering & Imaging Sciences, King’s College London, London, United Kingdom, 2Biomedical Engineering Department, School of Biomedical Engineering & Imaging Sciences, King’s College London, London, United Kingdom, 3London Collaborative Ultra high field System (LoCUS), London, United Kingdom, 4Radiology Department, Great Ormond Street Hospital for Children, London, United Kingdom, 5MR Research Collaborations, Siemens Healthcare Limited, Frimley, United Kingdom, 6Paris-Saclay University, CEA, CNRS, BAOBAB, NeuroSpin, Gif-sur-yvette, France
Synopsis
A fast and accurate B1+mapping method is essential for making proper use of a parallel transmit array with high number of coil elements in a clinical setting. The saturation-prepared turbo FLASH method offers this capability and is implemented in the fully automated pre-scan adjustments of the currently only clinical ultra-high magnetic field strength MRI system. However, some parallel transmit methods require an even higher accuracy. This can be achieved by calibrating the fast B1+measurements with a more accurate but longer B1+mapping method.
INTRODUCTION
A fast and accurate B1+mapping method is essential for making proper use of a parallel transmit array with high number of coil elements in a clinical setting (1). The saturation-prepared turbo FLASH method (sat.prep.TFL) (2) offers the capability to map the B1+field in a few seconds, but lacks high accuracy required by many imaging methods using parallel transmit like the DiSCoVER method (3). However, it is still implemented in the fully automated pre-scan adjustments of a current generation ultra-high magnetic field strength MRI system. The purpose of this work is to report means to calibrate the sat.prep.TFL B1+measurements by a more accurate but slower B1+mapping method which will enable improved performance while retaining the workflow benefits of the fully automated and fast pre-scan adjustments of the scanner.METHODS
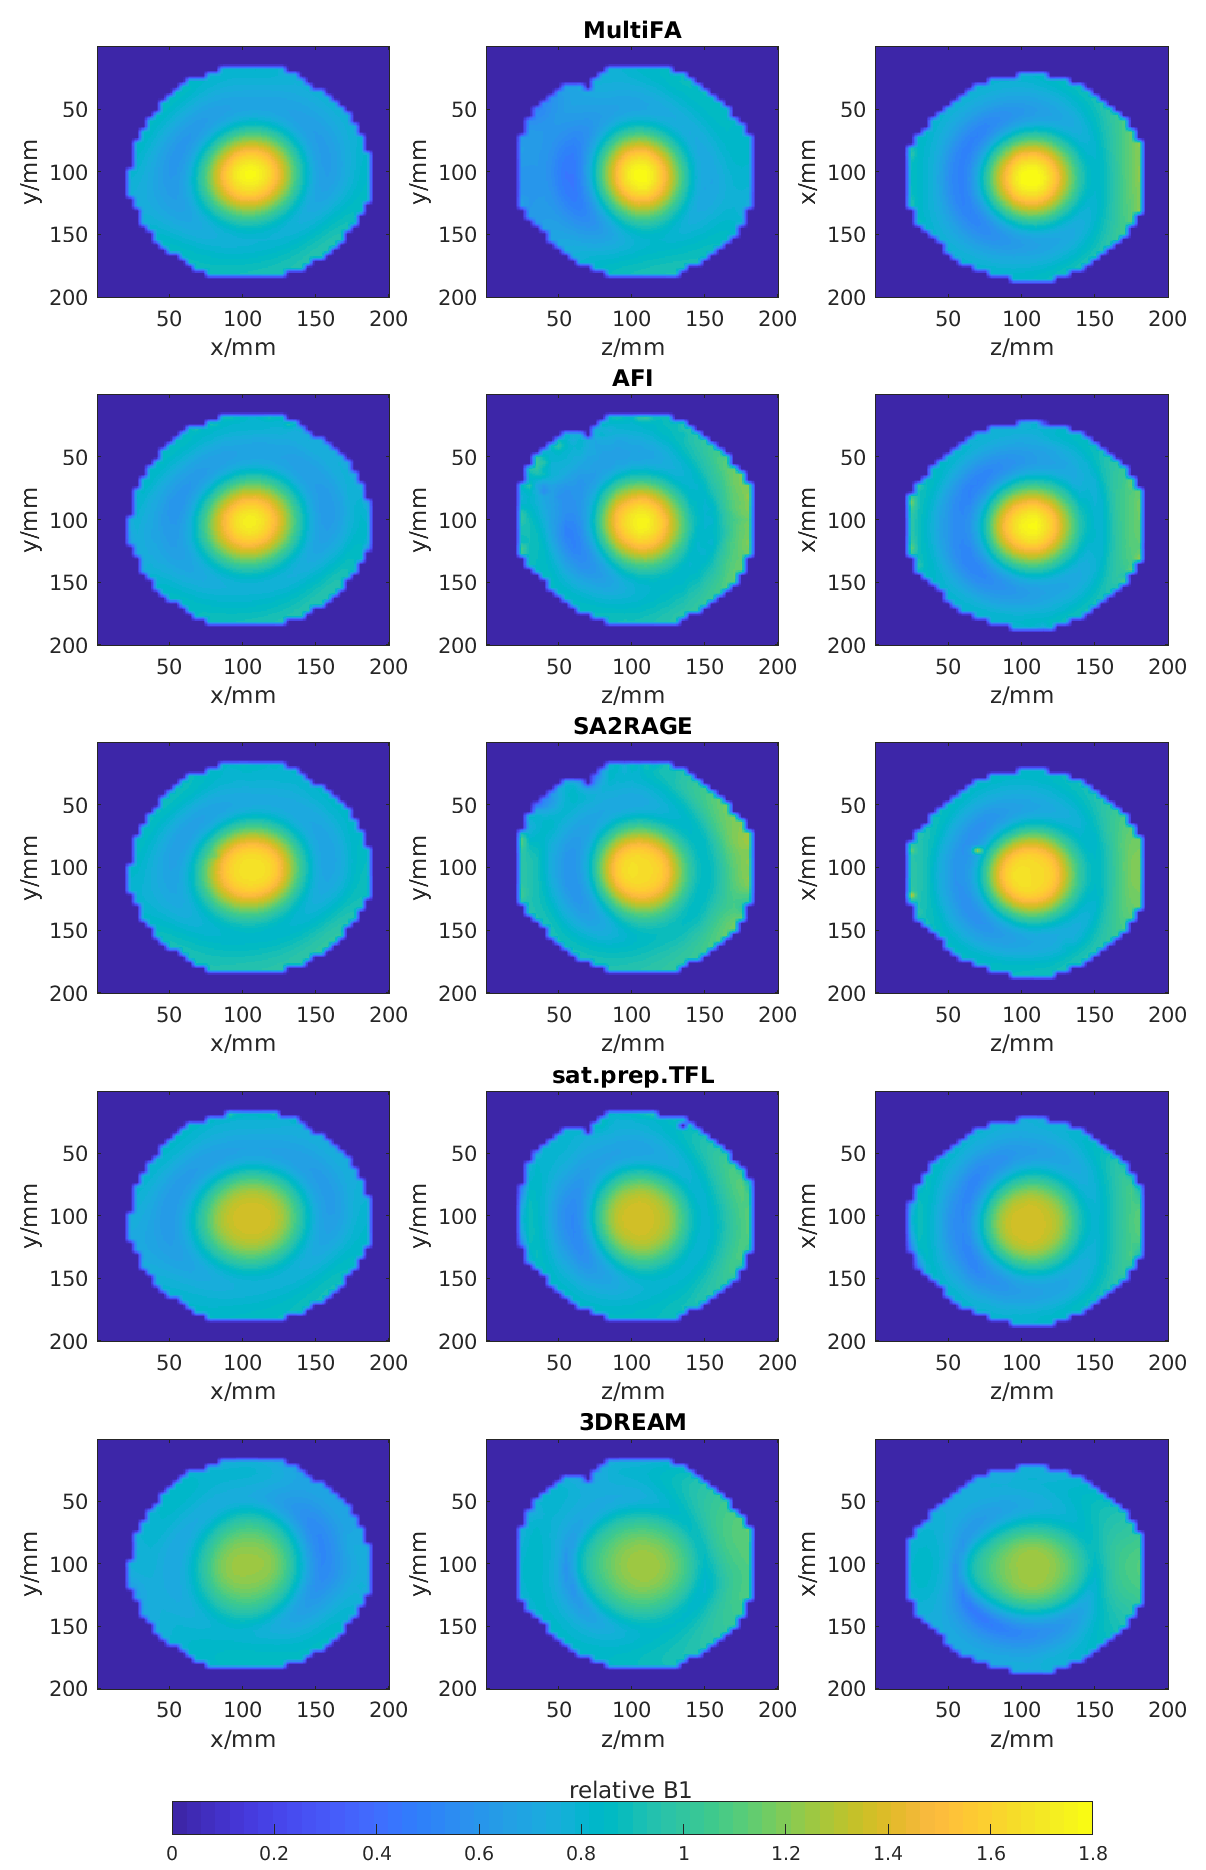
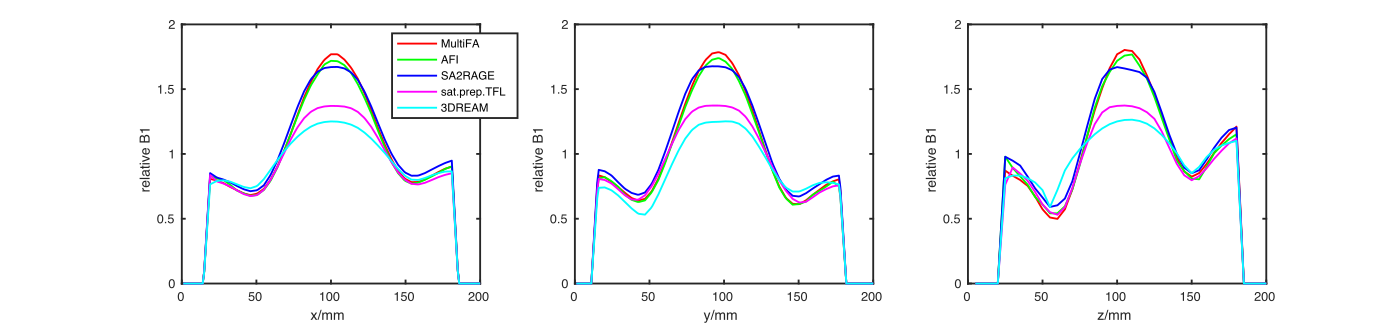
12 healthy subjects (5 female, age range 25-43 years) and one spherical phantom filled with water, 1% Agarose, 0.5% NaCl and 0.03mM MnCl (resulting in T1=1.9s at room temperature) were scanned on a 7T scanner (MAGNETOM Terra, Siemens Healthcare, Erlangen, Germany) with a 1Tx-32Rx-channel head coil (Nova Medical, Wilmington MA, USA) transmitting in Circular-Polarised (CP) mode. Human subject scanning was approved by the Institutional Research Ethics Committee (HR-18/19-8700).The phantom was scanned by the following B1+mapping techniques: solving the signal equation for the spoiled gradient echo sequence with 3D Multiple Flip Angles (MultiFA) (4) with FA=5-90°, ΔFA=5°, T1=1.9s and acquisition time (TA)=31:10min; 3D Actual Flip angle Imaging (AFI) (5) with FA=50°, TR1/TR2=40ms/200ms and TA=3:36min; 3D SAturation-prepared 2 RApid Gradient Echoes (SA2RAGE) (6) with TA=1:41min; 2D sat.prep.TFL (2) with 42 phase encoding steps, 21 slices, TR=5s, saturation FA=90° and TA=10s and 3D Dual Refocusing Echo Acquisition Mode (3DREAM) (7) with TA=5s. Imaging position, matrix size and field of view (voxel size=4.5x4.5x5mm^3) were matched for all mapping methods of the phantom. The B1+maps of all methods were compared to the B1+map derived from the MultiFA scan. All B1+values are reported relative to the target B1+value, i.e., the nominal flip angle of the respective mapping method.
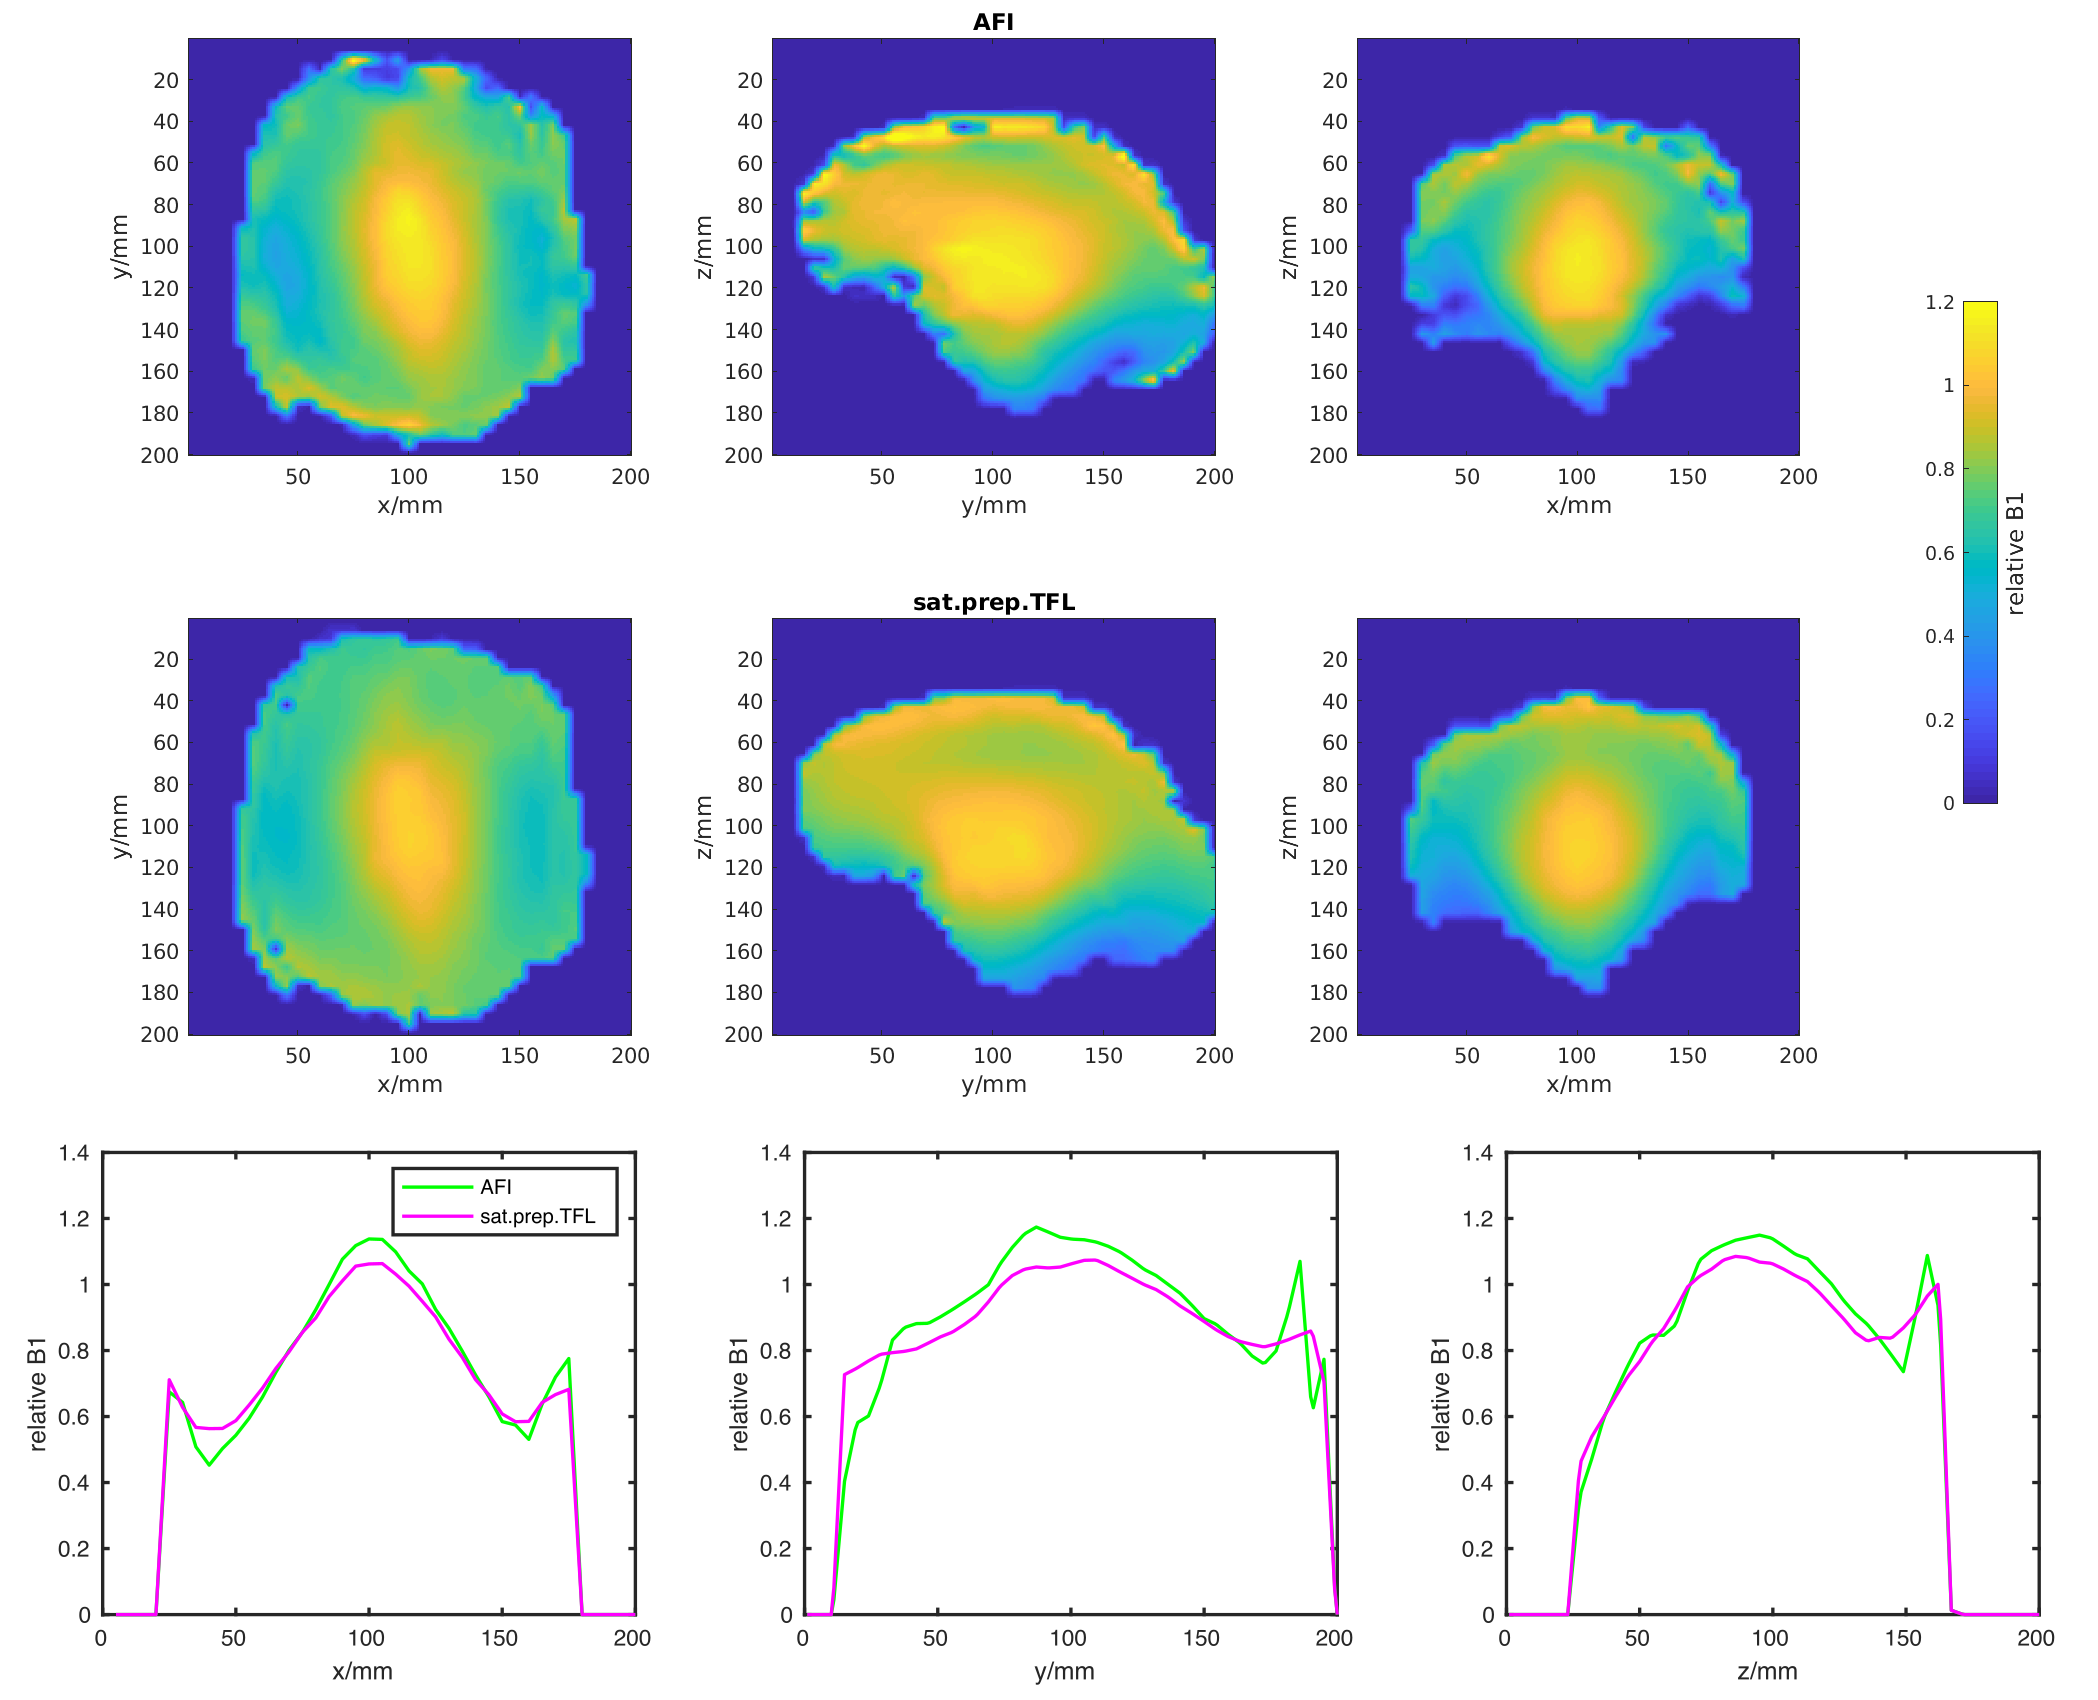
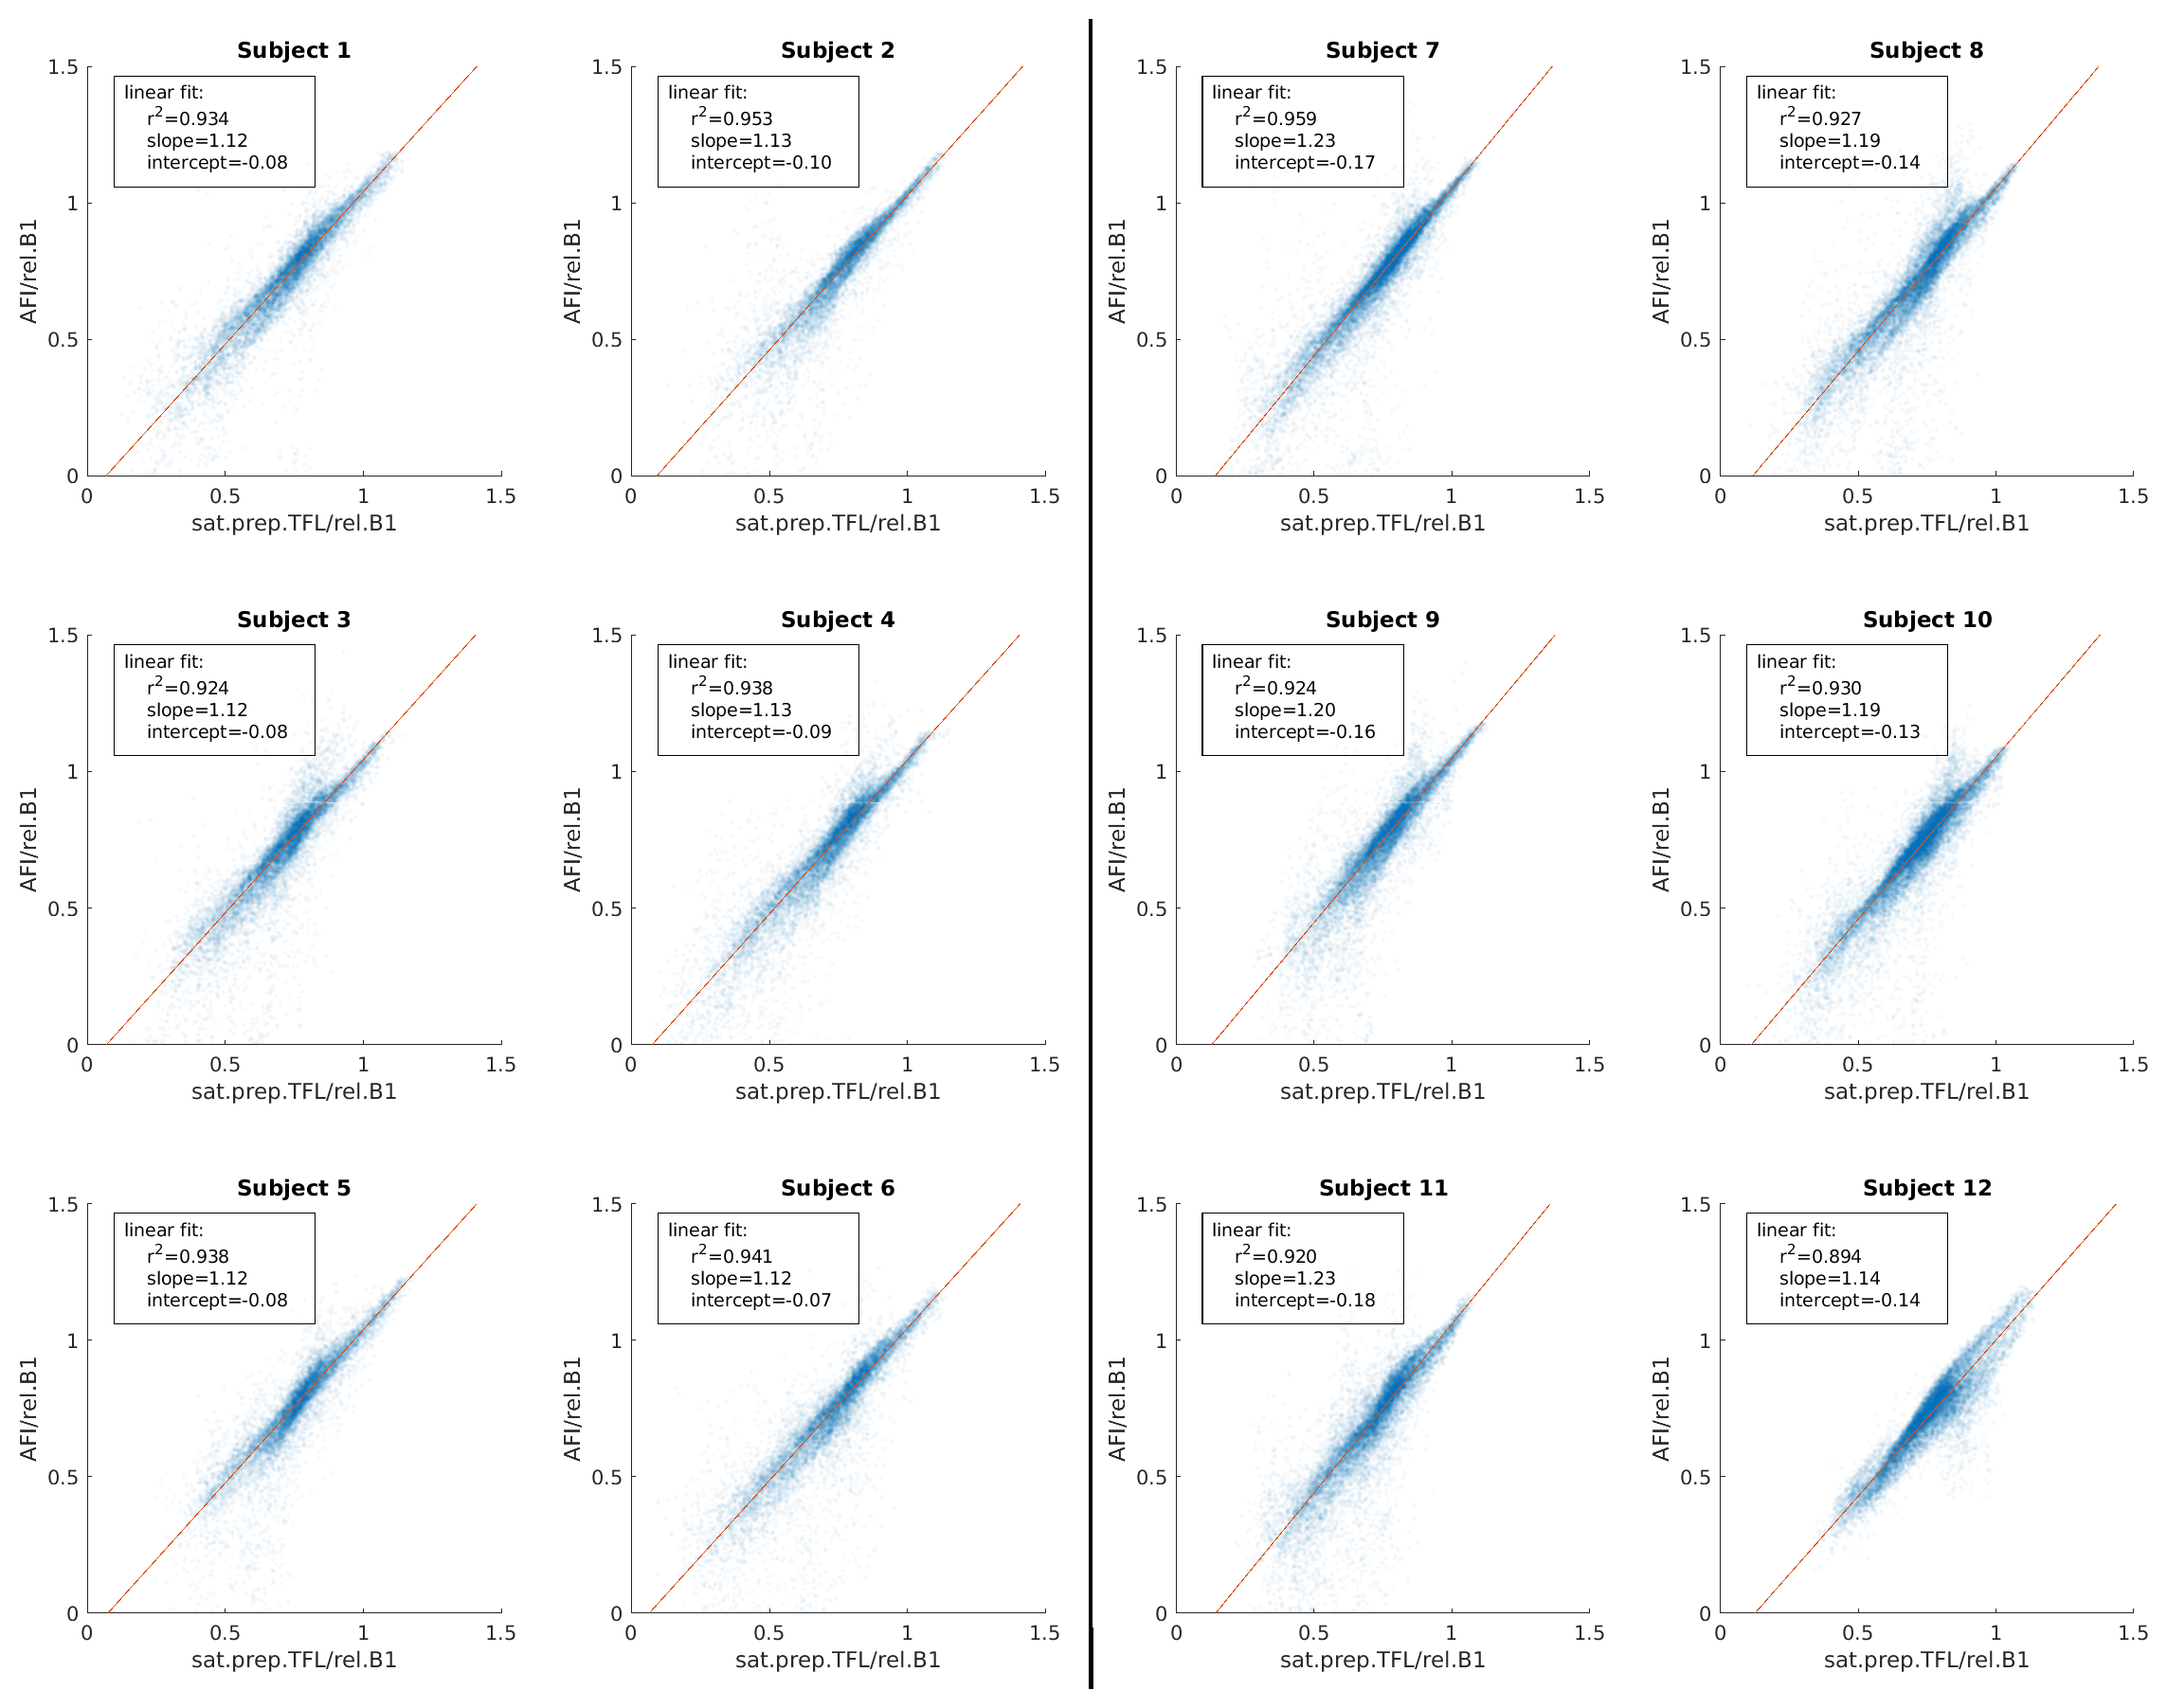
Following assessment of performance, in vivo B1+maps were acquired by the AFI and sat.prep.TFL methods only. The sat.prep.TFL method was acquired with 64 phase encoding steps causing a longer readout echo train for subjects 1-6. The same sat.prep.TFL imaging parameters as for the phantom were used for subjects 7-12. The AFI imaging parameters were the same for all subjects and for the phantom. Only voxels within the brain, extracted using the FSL brain extraction tool (8), were taken into account for the calibration analysis.
RESULTS
All B1+mapping methods showed high B1+values in the centre of the phantom which is characteristic for transmitting in CP-mode at 7T. The B1+values measured by the AFI method most closely match the values measured by the gold standard MultiFA method. The sat.prep.TFL method shows a large difference with much lower B1+values in the centre of the phantom (Fig.2).The in vivo B1+maps also show this characteristic pattern for transmitting in CP-mode at 7T (Fig.3). The sat.prep.TFL method shows lower B1+values than the AFI method in the centre region but the mismatch is much smaller as compared to the phantom. Scatter-plots and linear regression of the B1+values of the sat.prep.TFL and AFI methods show good linear correlation but slightly different linear slopes and intercepts for the sat.prep.TFL method depending on the readout echo train length (Fig.4).
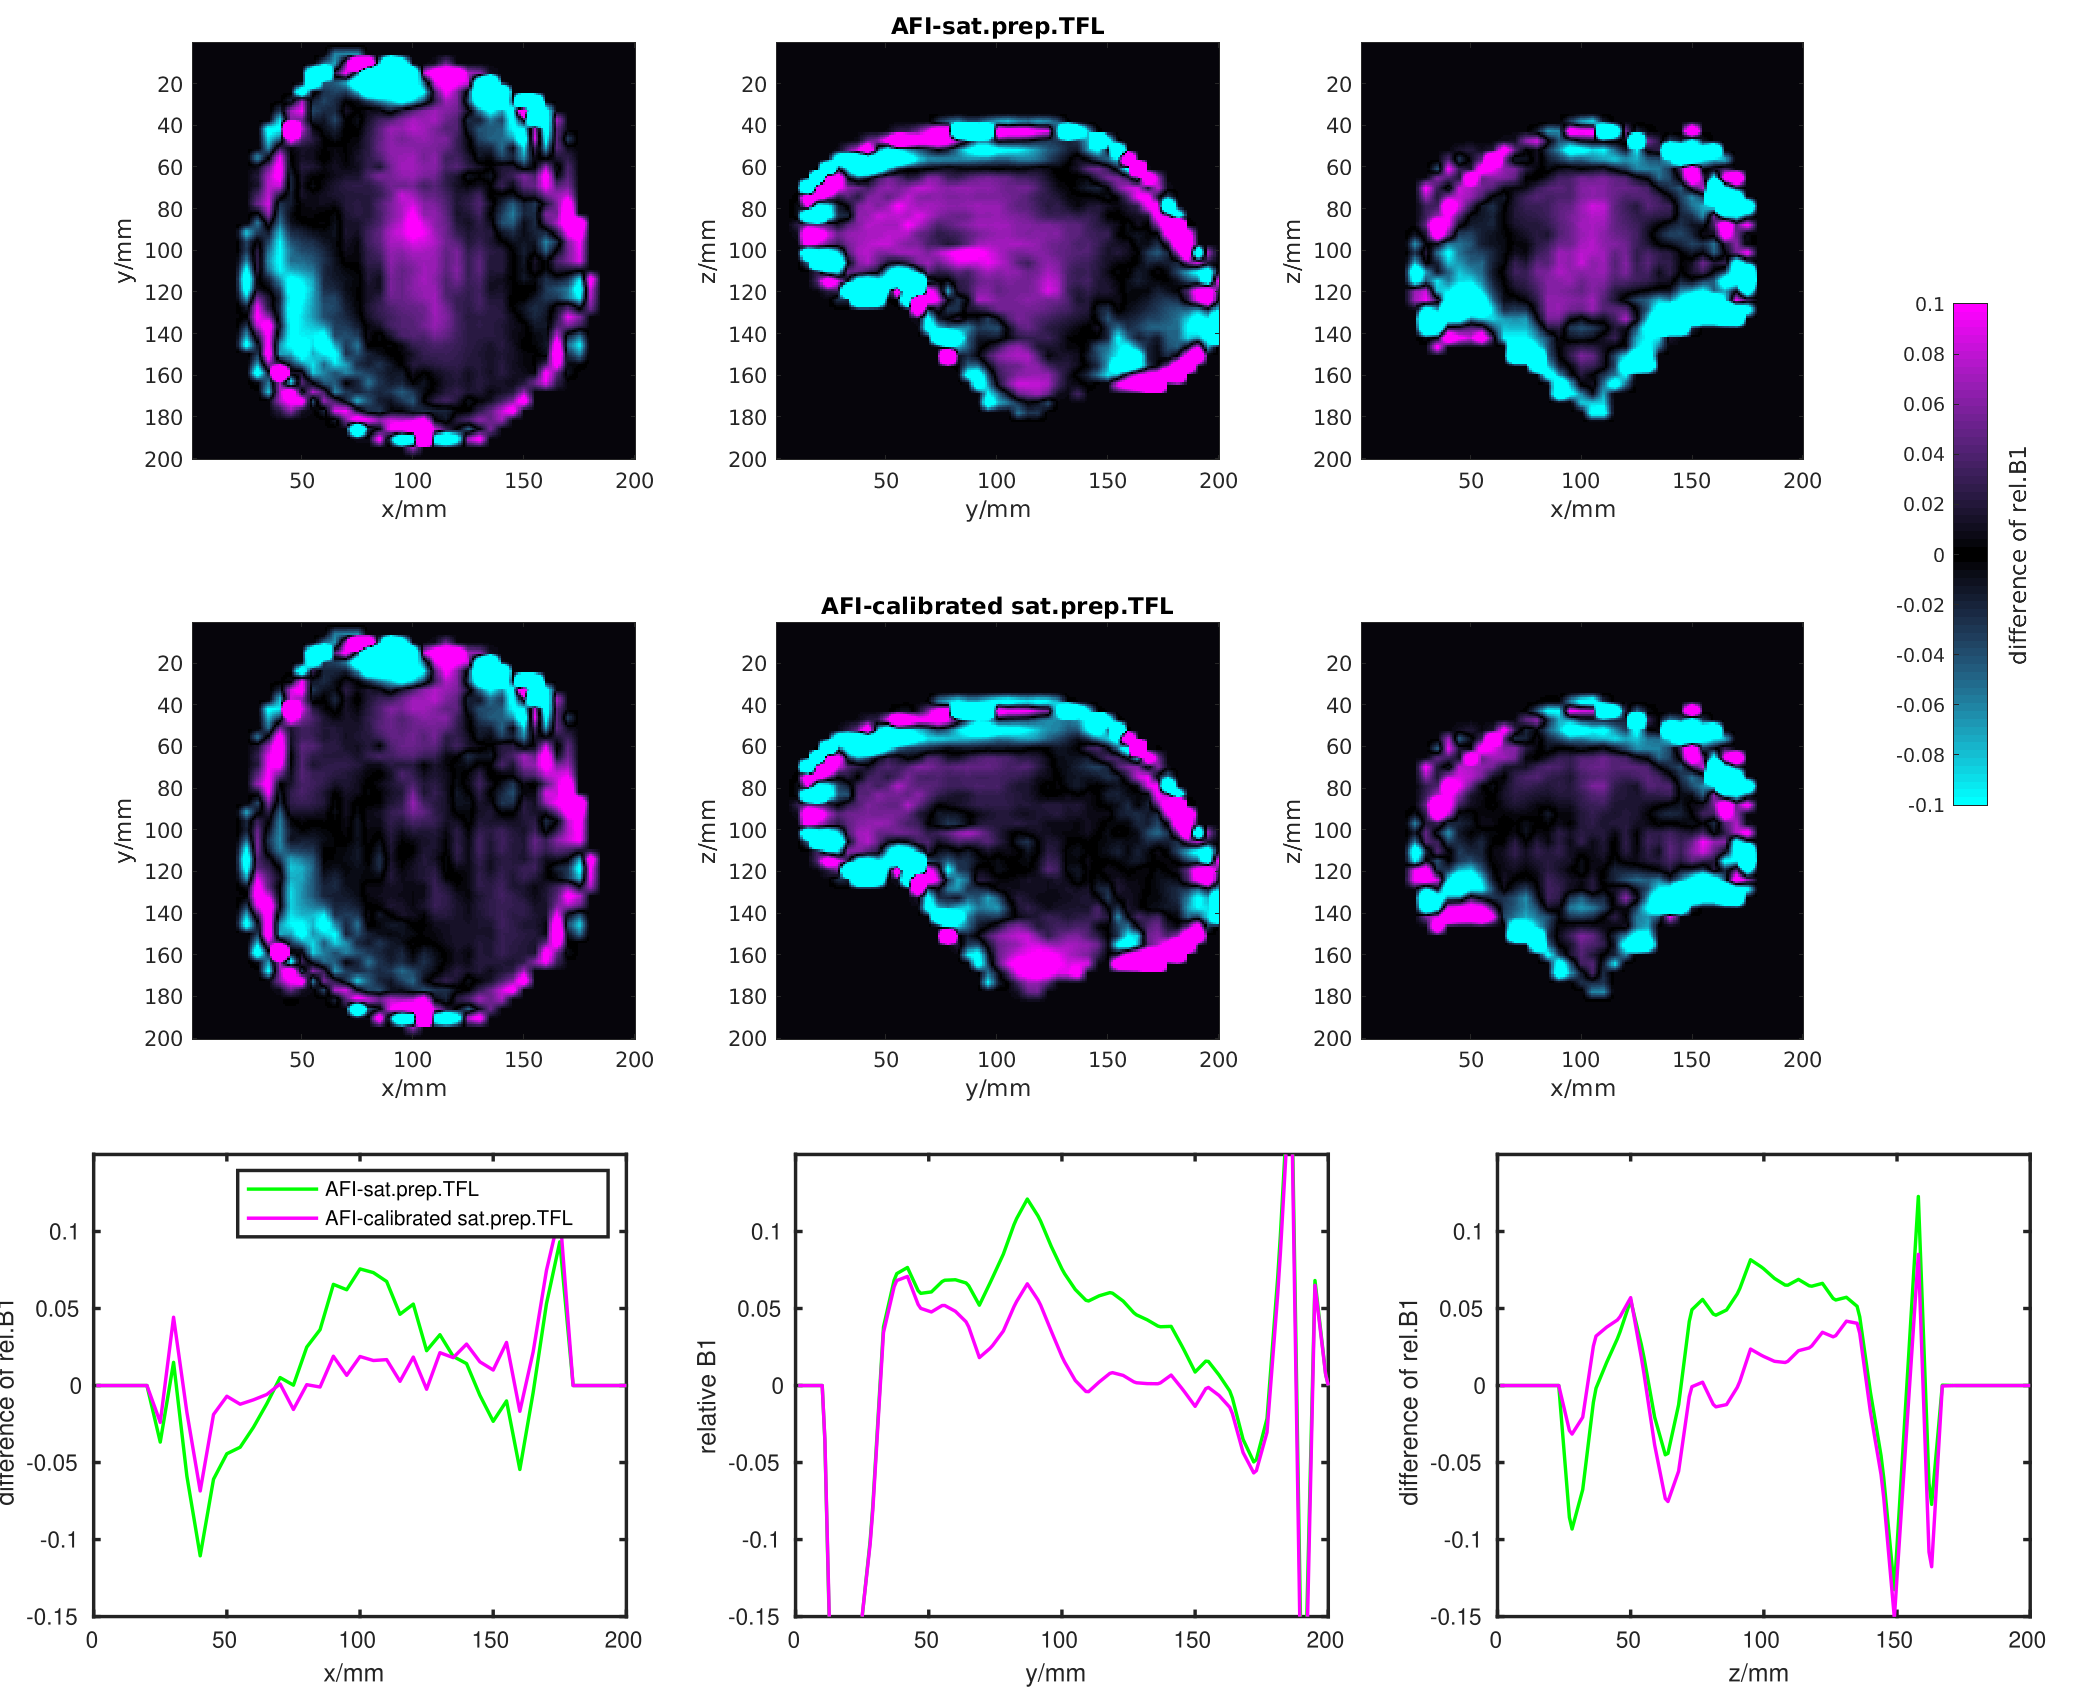
Calibrating the B1+values of the sat.prep.TFL method with the average linear slope and intercepts lowers the root mean square error (RMSE) to the AFI method by about 2.4±1.3% or 6.0±1.9% for the sat.prep.TFL scan acquired with 64 or 42 phase encoding steps, respectively. For brain regions with relative B1+values greater than 1, the RMSE is lowered by 16±5.6% or 10±3% for the sat.prep.TFL scan acquired with 64 or 42 phase encoding steps, respectively. The difference map between the AFI and sat.prep.TFL B1+maps also show that the calibration reduces the mismatch between these methods especially for regions in the centre of the brain with high B1+values (Fig.5).
DISCUSSION
The very similar B1+values measured by the MultiFA and AFI methods in the phantom show the high accuracy of the AFI method compared to other B1+mapping methods. This also demonstrates the soundness of choosing the AFI method for the in vivo scans. The mismatch between AFI and sat.prep.TFL is much less pronounced in vivo than in the phantom. This is caused by the very high B1+values in the centre of the phantom where the sat.prep.TFL method is inaccurate. Furthermore, the calibration depends on the imaging parameters of the sat.prep.TFL method, such as the readout echo train length, due to the transient state of the longitudinal magnetisation after the saturation preparation (2). The successful application of such a calibration was already shown in a previous work (3).CONCLUSION
The accuracy of the sat.prep.TFL method, as currently implemented in the fully automated pre-scan adjustments of the clinical ultra-high magnetic field MRI scanner, can be increased by linear calibration from in vivo measurements averaged over multiple subjects. Regions with high B1+values in the centre of the brain show the biggest improvement. Such a calibration will facilitate routine 7T scanning of parallel transmit imaging methods which require high accuracy B1+maps.Acknowledgements
This work was supported by core funding from the Wellcome/EPSRC Centre for Medical Engineering [WT203148/Z/16/Z] and by the National Institute for Health Research (NIHR) Biomedical Research Centre based at Guy’s and St Thomas’ NHS Foundation Trust and King’s College London and/or the NIHR Clinical Research Facility. The views expressed are those of the author(s) and not necessarily those of the NHS, the NIHR or the Department of Health and Social Care.References
1. Fautz H-P, Vogel M, Gross P, Kerr A, Zhu Y. B1 Mapping of Coil Arrays for Parallel Transmission. ISMRM 2008;16:1247. Available from: https://cds.ismrm.org/protected/08MProceedings/PDFfiles/01247.pdf
2. Klose U. Mapping of the radio frequency magnetic field with a MR snapshot FLASH technique. Med Phys. 1992 Aug;19(4):1099–104.
3. Tomi-Tricot R, et.al. Fully Integrated Scanner Implementation of Direct Signal Control for 2D T2-Weighted TSE at Ultra-High Field. ISMRM 2021;29:0621. Available from: https://index.mirasmart.com/ISMRM2021/PDFfiles/0621.html
4. Ernst RR, Anderson WA. Application of Fourier Transform Spectroscopy to Magnetic Resonance. Rev Sci Instrum. 1966 Jan 1;37(1):93–102.
5. Yarnykh VL. Actual flip-angle imaging in the pulsed steady state: a method for rapid three-dimensional mapping of the transmitted radiofrequency field. Magn Reson Med. 2007 Jan;57(1):192–200.
6. Eggenschwiler F, Kober T, Magill AW, Gruetter R, Marques JP. SA2RAGE: a new sequence for fast B1+ -mapping. Magn Reson Med. 2012 Jun;67(6):1609–19.
7. Ehses P, Brenner D, Stirnberg R, Pracht ED, Stöcker T. Whole-brain B1 -mapping using three-dimensional DREAM. Magn Reson Med. 2019;82(3):924–34.
8. Smith SM.
Fast robust automated brain extraction. Human Brain Mapping,
17(3):143-155, November 2002.
Figures