2861
Field dependence of T2* contrast in human substantia nigra1Department of Neurophysics, Max Planck Institute for Human Cognitive and Brain Sciences, Leipzig, Germany, 2Leipzig University, Leipzig, Germany, 3Center for Cognitive Neuroscience Berlin, Freie Universität Berlin, Berlin, Germany, 4Medical Physics Group, Institute of Diagnostic and Interventional Radiology, University Hospital Jena, Jena, Germany, 5Felix Bloch Institute for Solid State Physics, Leipzig University, Leipzig, Germany, 6Paul Flechsig Institute of Brain Research, Leipzig University, Leipzig, Germany, 7Department for Low and Medium Energy Physics, Jožef Stefan Institute, Ljubljana, Slovenia, 86University Clinic and Outpatient Clinic for Radiology, University Hospital Halle (Saale), Halle (Saale), Germany
Synopsis
MRI holds high promise to diagnose Parkinson’s disease (PD) at clinical field strength B0. However, it remains unclear which B0 optimizes T2* contrast in substantia nigra, which provides high diagnostic accuracy. We used quantitative MRI at B0=1.5T-9.4T, MR microscopy, and histochemistry to characterize the field dependence of the major contributors to R2* (1/T2*): dopaminergic neurons, ferritin, and myelin. R2* maps were similar at B0=3T-9.4T, and all contributions scaled approximately linearly with B0. Hence, the contrast mechanisms are similar across currently available MRI field strengths in vivo, which informs the design of novel PD biomarkers.
Introduction
MRI promises to monitor the depletion of dopaminergic neurons (DN) in the substantia nigra (SN)1, which causes the motor symptoms of Parkinson’s disease (PD)2,3. In particular, changes on T2*-weighted images (T2*-WI) indicate PD with above 90% sensitivity and specificity1. The DN’s contribution to effective transverse relaxation rate R2*=1/T2* has been studied using MRI on postmortem tissue4-6. Three major R2* contributors with complex, overlapping spatial distributions were identified: Iron-rich DN somata, other, mainly ferritin-bound iron, and myelinated fibers4-8.However, it remains unclear at which field strength B0 the DN in SN is mapped best. Non-linear scaling of R2* contributions with B0 may change the DN's T2* contrast. Such scaling may result from the contributors’ magnetism. While ferritin-bound iron9 and myelin10 show a linear dependence of magnetization on B0, the dependence of DN is unknown. Moreover, for magnetic inclusions such as iron-rich cells and myelinated fibers, R2* scales quadratically with B0 in the motional narrowing regime and linearly with B0 in the static dephasing regime, depending on how fast water diffuses across magnetic inclusions11. It is therefore unknown how different R2* contributions scale with B0.
Here, we characterize R2* relaxation in SN, by combining quantitative MRI at B0=1.5T-9.4T, ultra-high-field MR microscopy at cellular resolution, and histochemistry on postmortem human brain tissue. We examined the B0-dependence of R2* originating from DN, ferritin-bound iron, and myelin using rescaled R2* maps and general linear models. Our results enable a more informed optimization of SN MRI for effective PD biomarker development.
Methods
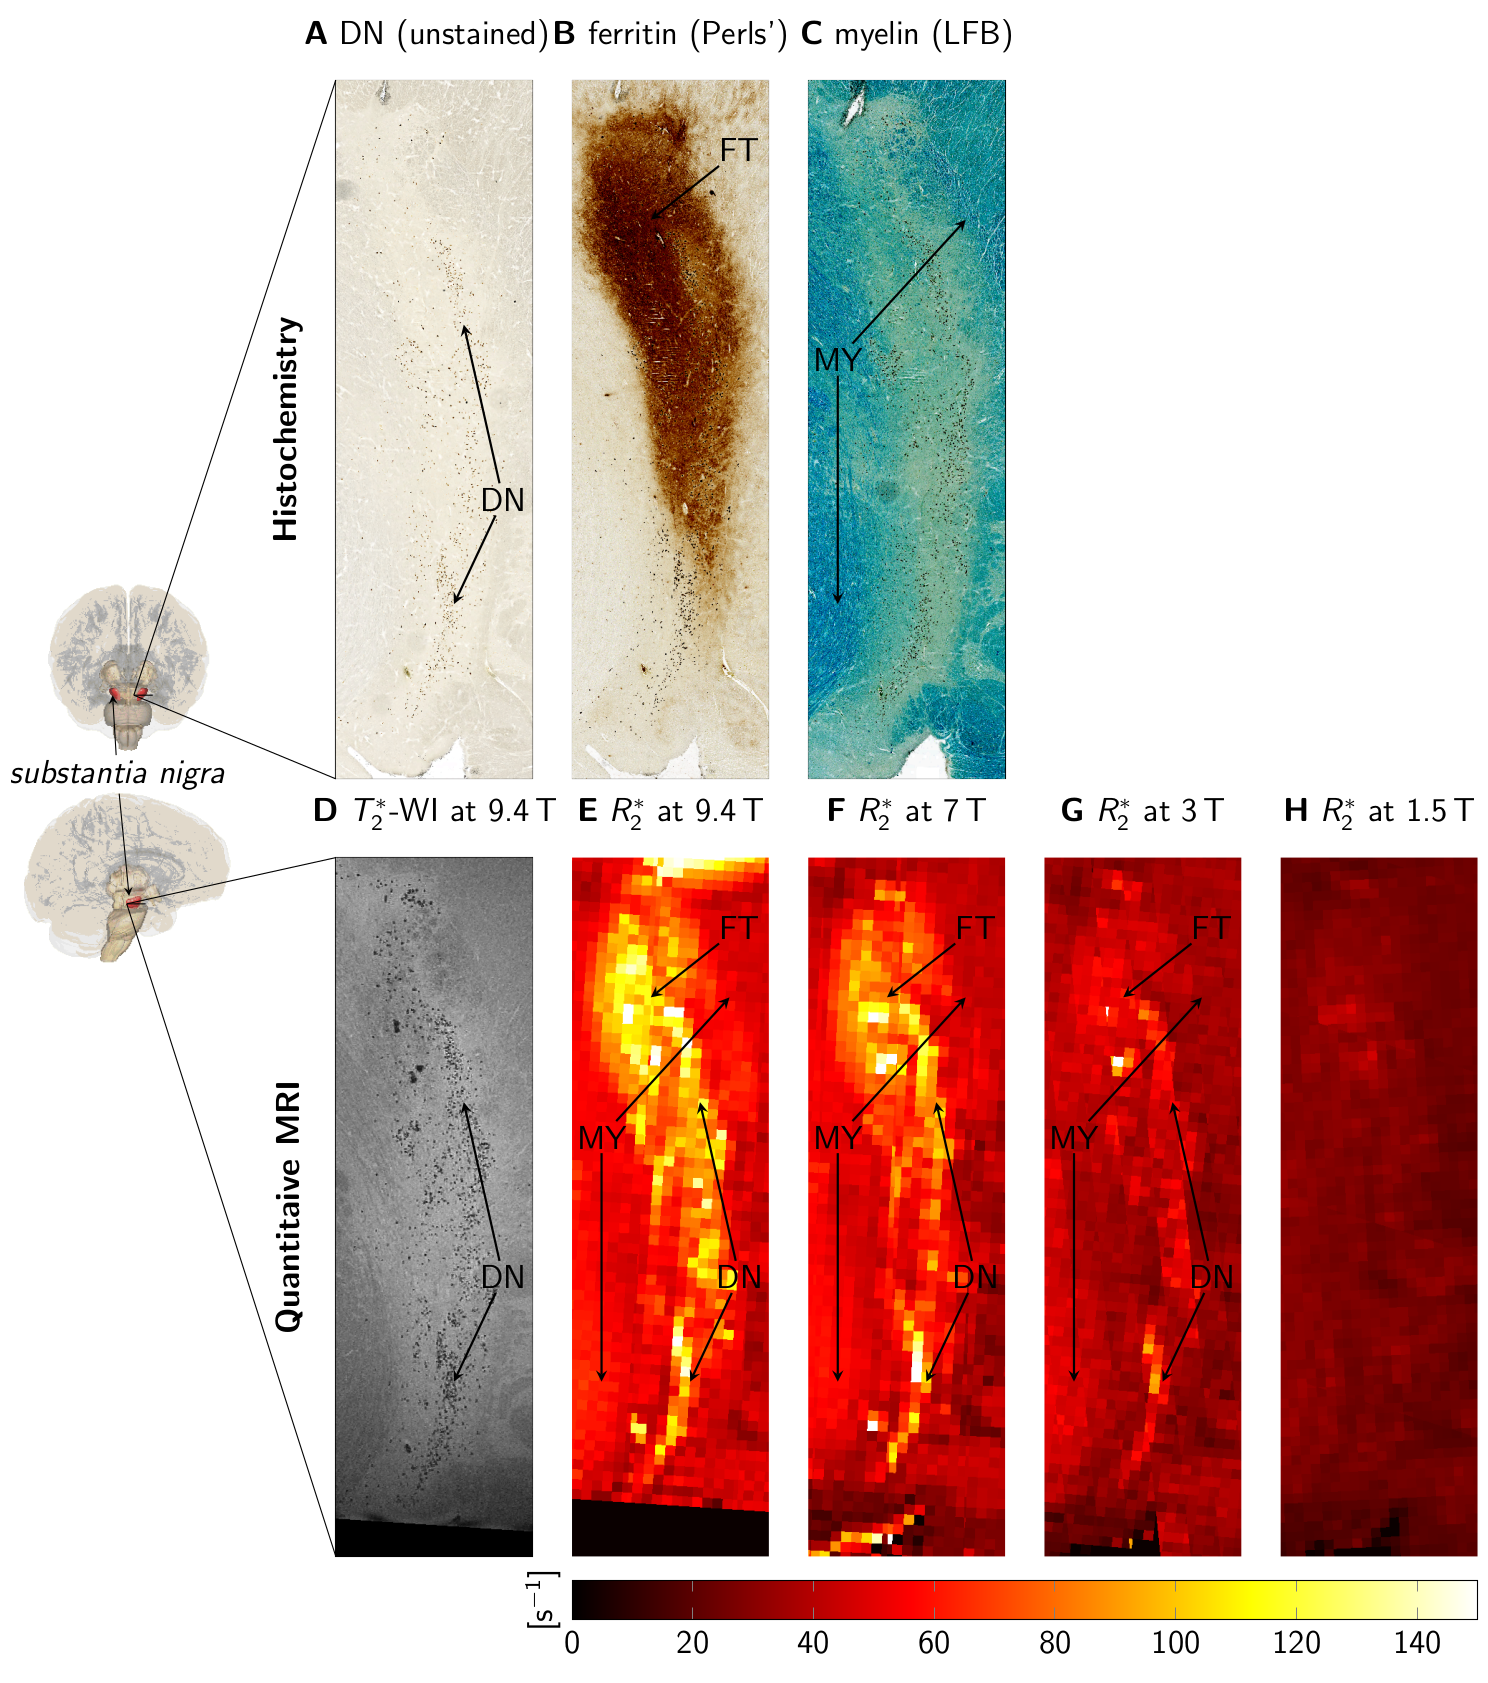
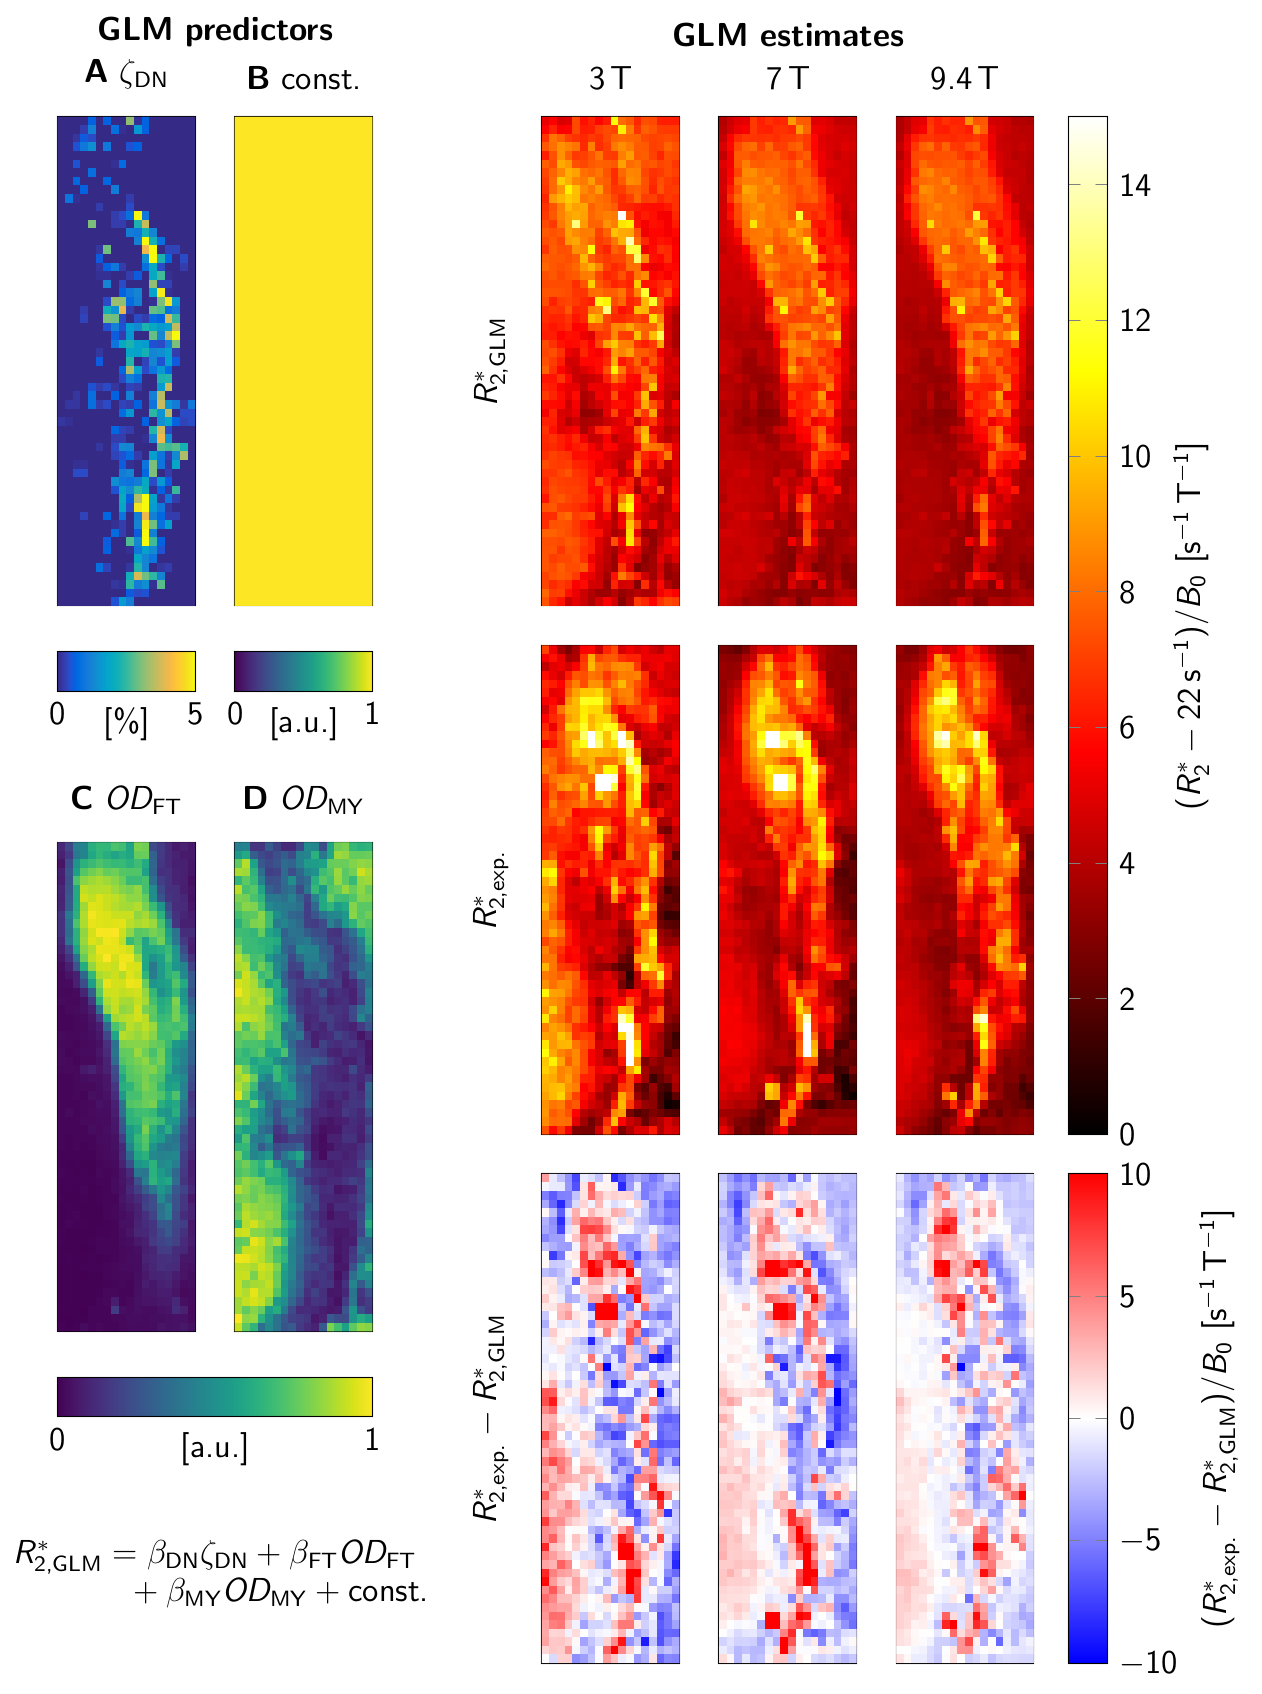
Quantitative MRI measurements were performed on tissue blocks containing SN from two human postmortem brains (86y and 61y) at B0=1.5T-9.4T (parameters in Fig. 1). Ultra-high-resolution 3D T2*-WI with 22µm isotropic resolution were obtained at 9.4T for registration between MRI and histological data (Fig. 2D)12. These data were downsampled in Fourier space to an isotropic resolution of 220µm to obtain high-resolution T2*-WI, as acquired at lower B0. Quantitative R2* maps were estimated from the magnitude images using a non-linear least-squares fit of exponential decay and Rician noise floor (Fig. 2E-H).Thereafter, tissue blocks were paraffin-embedded, cut into 10-µm-thick sections, and histologically processed6. Sections were left unstained for detection of pigmented DN (Fig. 2A), stained with Perls’ method for ferritin-bound iron (Fig. 2B), and stained with Luxol fast blue (LFB) for myelin (Fig. 2C)6. DN were segmented to estimate their volume fraction ζDN. Optical density maps of ferritin-bound iron (ODFT) and myelin (ODMY) were obtained using Lambert-Beer’s law.
MRI data and histology were affinely registered, using vessels and DN on ultra-high-resolution T2*-WI and unstained sections as landmarks. High-resolution T2*-WI were registered using a rigid registration in ANTs13.
A general linear model (GLM) of R2* was used to predict R2* at B0=3T-9.4T, based on ζDN, ODFT, and ODMY (Fig. 4). For visually assessing R2*, a second GLM provided a field-independent R2* (Fig. 3).
Results
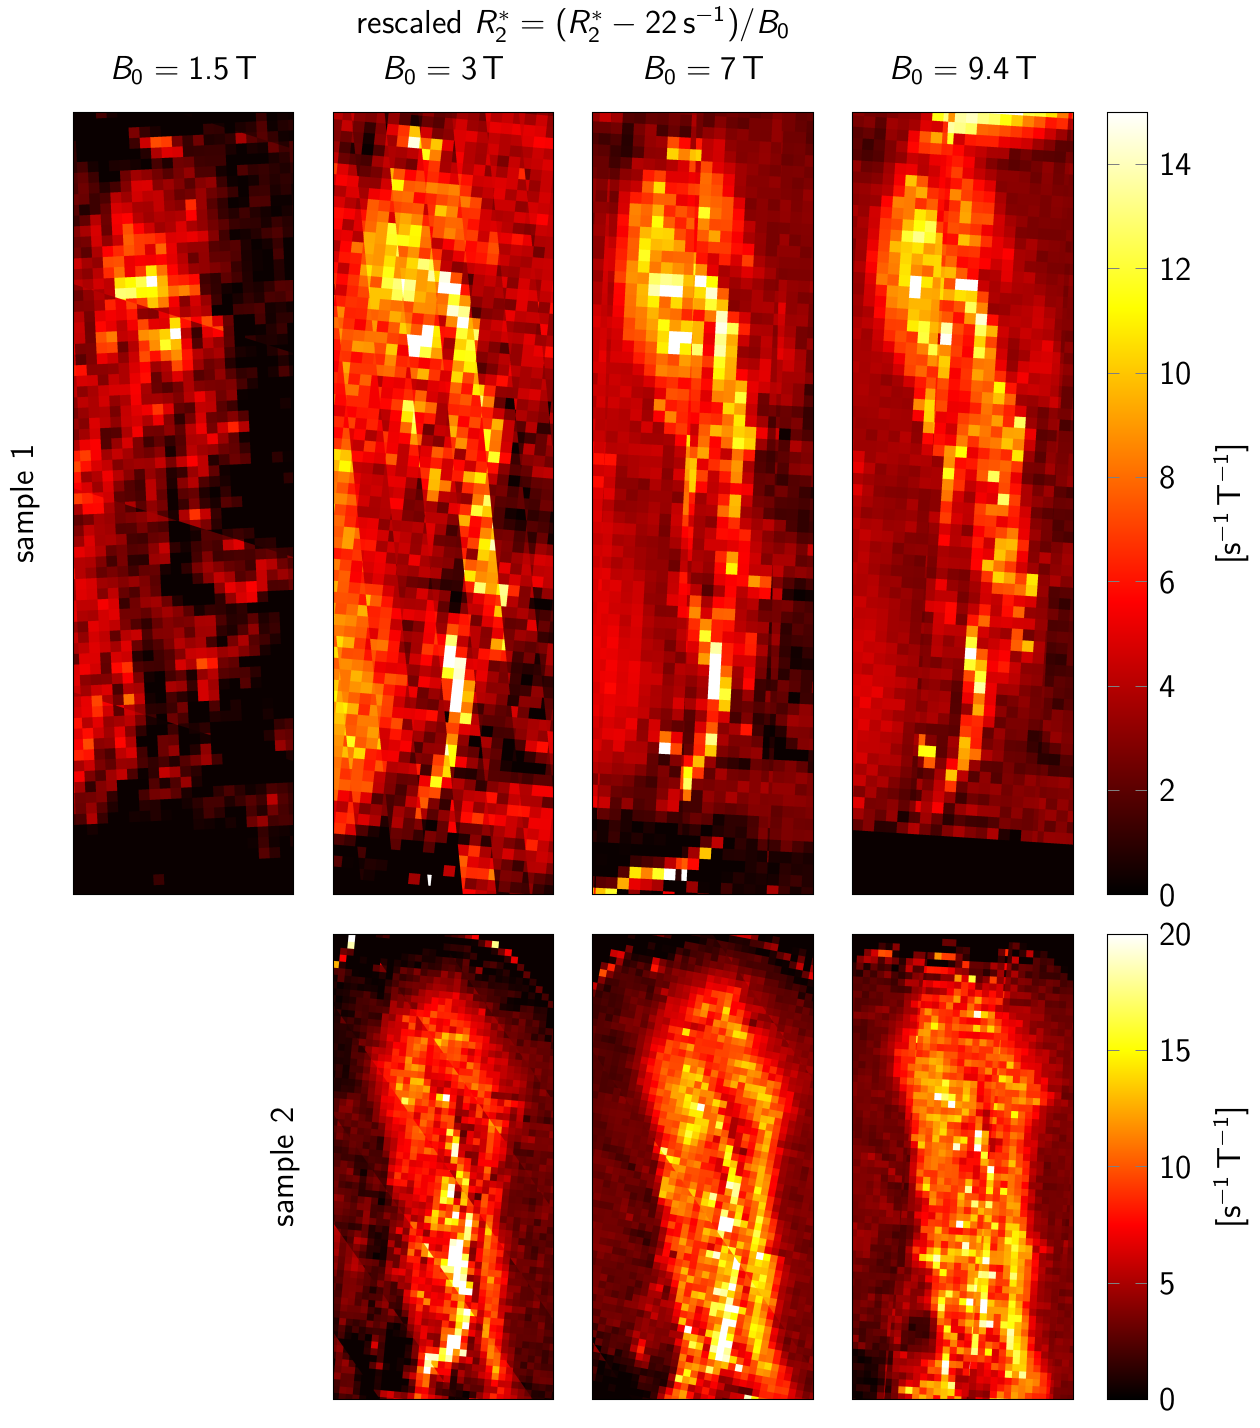
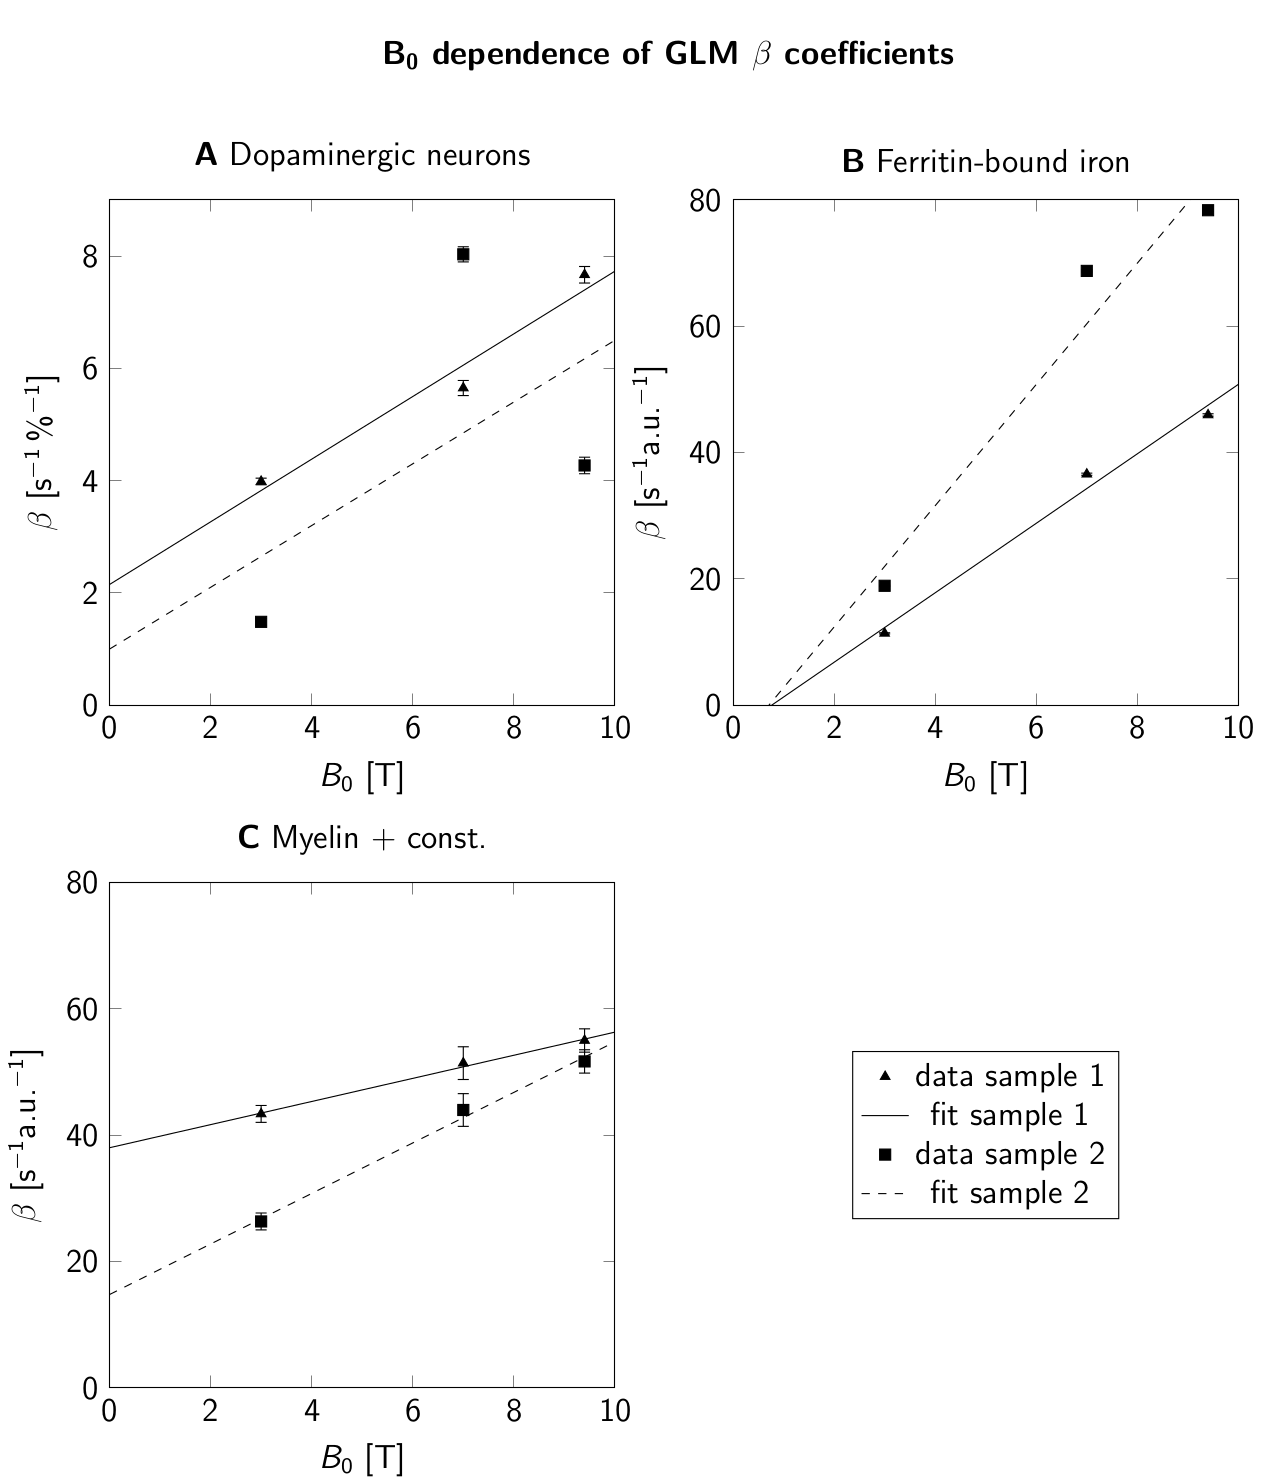
For B0=1.5T-9.4T, R2* maps showed an increase of R2* with B0 (Fig. 2E-H). Similar contrast patterns were present at B0=3T-9.4T. R2* maps were rescaled by normalizing by B0, after subtracting a field-independent R2* (Fig. 3). These rescaled R2* maps were highly similar at B0=3T-9.4T, indicating approximately linear scaling of R2* and similar contrast mechanisms. Areas of increased R2* strongly resembled the spatial distribution of DN and ferritin and somewhat the distribution of myelin.R2* maps predicted using GLMs at B0=3T-9.4T showed an overall high correspondence to experimental R2* maps (Fig. 4). GLMs underestimated R2* in areas of increased ζDN and overestimated R2* in areas of increased ODFT. The B0-dependence of the GLM ꞵ parameters indicated a linear scaling of ferritin-induced R2* (Fig. 5A). The contribution of myelin and the constant term scaled linearly with a non-zero field-independent contribution varying between the samples (Fig. 5B). For DN, a linear scaling was observed for sample 1, whereas sample 2 showed inconsistent behavior (Fig. 5C).
Discussion and Conclusion
We characterized R2* rates in SN at B0 ranging from 1.5T-9.4T to determine the optimal field strength for SN mapping.R2* maps at B0=3T-9.4T showed similar features within SN, implying that 3T MRI, clinically widely available, is capable of mapping SN’s rich substructure. Nevertheless, higher SNR at higher fields is beneficial to achieve higher spatial resolutions.
The GLM ꞵ parameters indicated a linear dependence of R2* rates on B0=3T-9.4T. Hence, the R2* contributions of ferritin-bound iron and myelin are well described by the static dephasing limit14. Moreover, these results are in line with field-independent magnetic susceptibilities of both contributors9,10. The two-fold higher ꞵ parameter of ferritin-bound iron for sample 2 corresponds well to a 2.5-fold higher concentration of ferritin-bound iron in this sample6.
The inconsistent GLM results for the DN contribution to R2* did not allow us to assess the B0-dependence of DN susceptibility. Due to the small extent of DN-rich regions, this estimate is most affected by registration errors. Moreover, the DN volume fraction derived from a 10-µm-thick section may not accurately reflect the DN density in 220-µm-thick MRI slices. The mismatch of R2* in areas of increased ODFT could indicate that mesoscopic relaxation, driven by the spatial gradient of ODFT, plays a role15.
Our results are an important step towards more informed SN MRI, interpretation, and optimization of putative PD biomarkers.
Acknowledgements
We acknowledge the former Brain Banking Centre Leipzig of the German Brain-Net, operated by the Paul Flechsig Institute of Neuropathology and Brain Research, Medical Faculty, and Leipzig University for providing post mortem brain samples. The entire procedure of case recruitment, acquisition of the patient's personal data, the protocols and the informed consent forms, performing the autopsy, and handling the autopsy material have been approved by the responsible authorities (Approval # WF-74/16, Approval # 282-02 and Approval # 205/17-ek).
The research leading to these results has received funding from the European Research Council under the European Union's Seventh Framework Program (FP7/2007-2013) / ERC grant agreement n° 616905. This project has also received funding from the BMBF (01EW1711A & B) in the framework of ERA-NET NEURON. Work at JSI was supported by the Slovenian research agency (ARRS) grants J7-9398, N1-0090, P1-0112, I0-0005 and EU H2020 project no. 824096 “RADIATE”.
The Max Planck Institute for Human Cognitive and Brain Sciences has an institutional research agreement with Siemens Healthcare. NW holds a patent on acquisition of MRI data during spoiler gradients (US 10,401,453 B2). NW was a speaker at an event organized by Siemens Healthcare and was reimbursed for the travel expenses. M. Brammerloh has received funding from the International Max Planck Research School on Neuroscience of Communication: Function, Structure, and Plasticity.
References
Figures
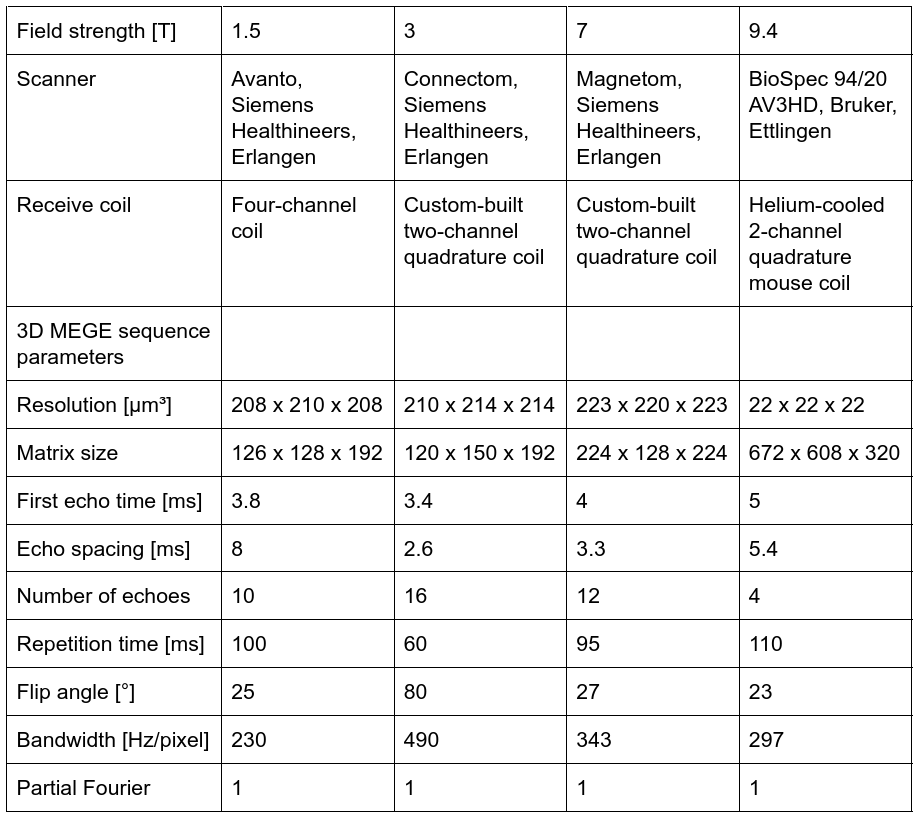
Overview of MRI sequence parameters at different static magnetic field strengths.