2860
Orientation Dependence of Myelin Water Fraction as Measured by MET21Biomedical Engineering, Vanderbilt University, Nashville, TN, United States, 2Vanderbilt University Institute of Imaging Science, Nashville, TN, United States
Synopsis
This study investigated the orientation dependence of myelin water fraction (MWF) as evaluated with a 3D multiple-spin echo sequence (MSE). MSE and diffusion tensor scans were acquired at 7-T from two excised rat brains at three different orientations with respect to the main magnetic field. Region of interest analysis of the corpus callosum and the internal capsule revealed that there is no clear orientation dependency for MWF in these white matter tracts. This result is also evidenced by the minimal orientational modulation of the T2 spectra for both ROIs across both brains.
Introduction
A field of study has evolved in magnetic resonance imaging (MRI) centered around investigating the effects that arise due to variations in the orientation angle of tracts in the brain with respect to the main magnetic field (B0). One of the most well-established relationships is that between R2* and orientation to B0. While orientation is known to have varying effects on relaxation (T2*1,2, T13, T22,4), it is unclear whether the myelin water fraction (MWF) from multi-exponential T2 (MET2) analysis depends on fiber orientation. We investigated this question in ex vivo rat brains.Methods
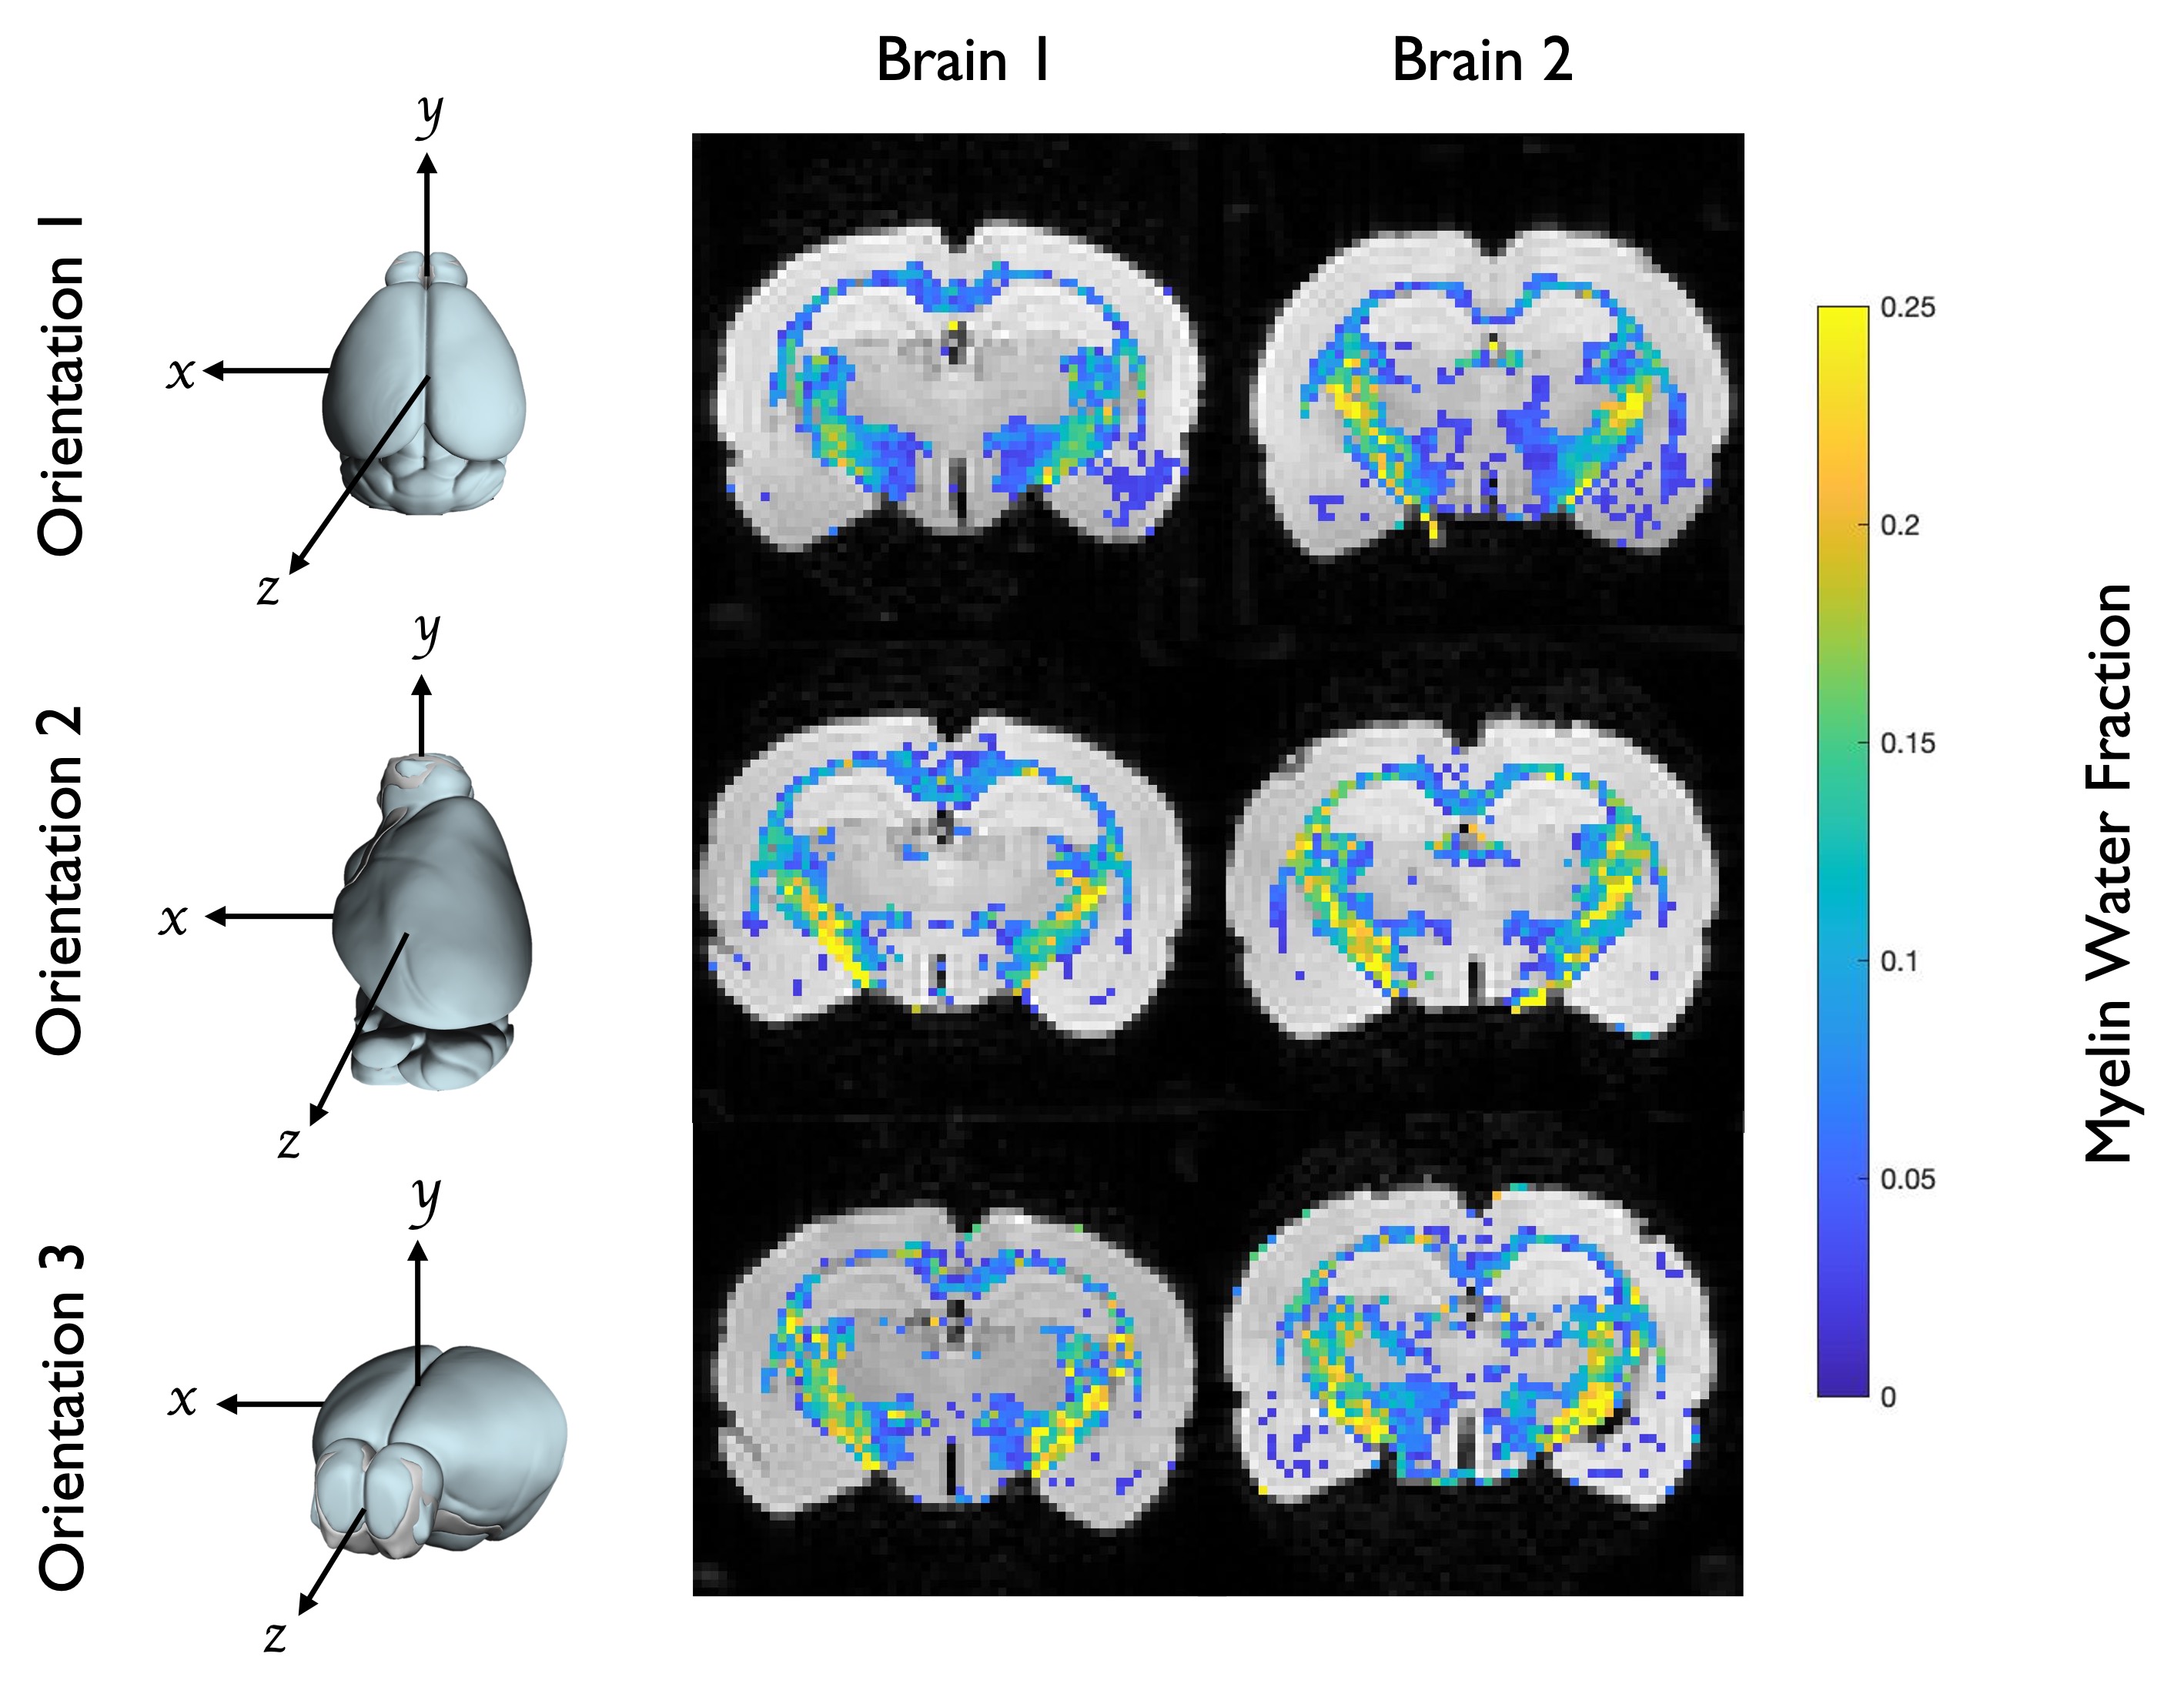
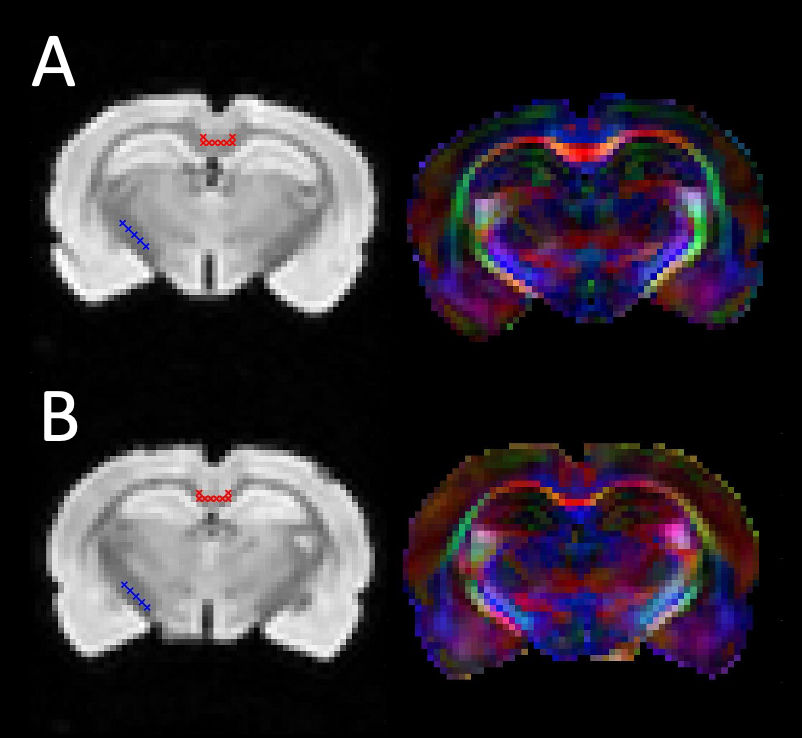
Two rat brains were perfusion fixed and excised, using 2% PFA + 2.5% Glutaraldehyde and 1 mmol/mL gadolinium contrast agent to reduce the sample T1. The olfactory bulb and cerebellum were removed and brains were loaded into a 3D printed holder that allowed rotation along the X/Y/Z axes independently, and the void-space was filled with Fomblin. MRI was performed on a 7-T 16 cm horizontal bore Bruker (Rheinstetten, Germany) BioSpec scanner, using a 38 mm diameter volume coil. Transverse relaxation was measured with a 3D-multiple spin echo (MSE) sequence, similar to previous work5; TR = 800 ms, TE = 6 ms, NE = 24, and NA = 8. Diffusion tensor imaging (DTI) was performed using a diffusion-weighted 3D RARE sequence; TR = 200 ms, TE = 7.5 ms, b = 3000 s/mm2, and 12 diffusion encoding directions. Scans were encoded with a 64×64×64 matrix over a 16×16×16 mm3 FOV, providing 250 µm isotropic resolution. The total scan time for both MSE and DTI was ≈13 hr. For each brain, the MSE and DTI scans were repeated at three orientations, as depicted in Figure 1.Diffusion tensor and MET2 analyses were performed voxel wise. From the diffusion tensor, the angle between B0 and the primary fiber orientation was computed6, and relaxometry provided a T2 spectrum and MWF. Two regions of interest (ROI) – the corpus callosum (CC) and internal capsule (IC) – were manually defined in a coronal slice, ≈ 4 mm caudal to the bregma, in which fiber orientations in the CC and IC were approximately perpendicular to each other (Figure 2). Within each ROI, the mean T2 spectrum, MWF, and fiber angle were computed.
Results
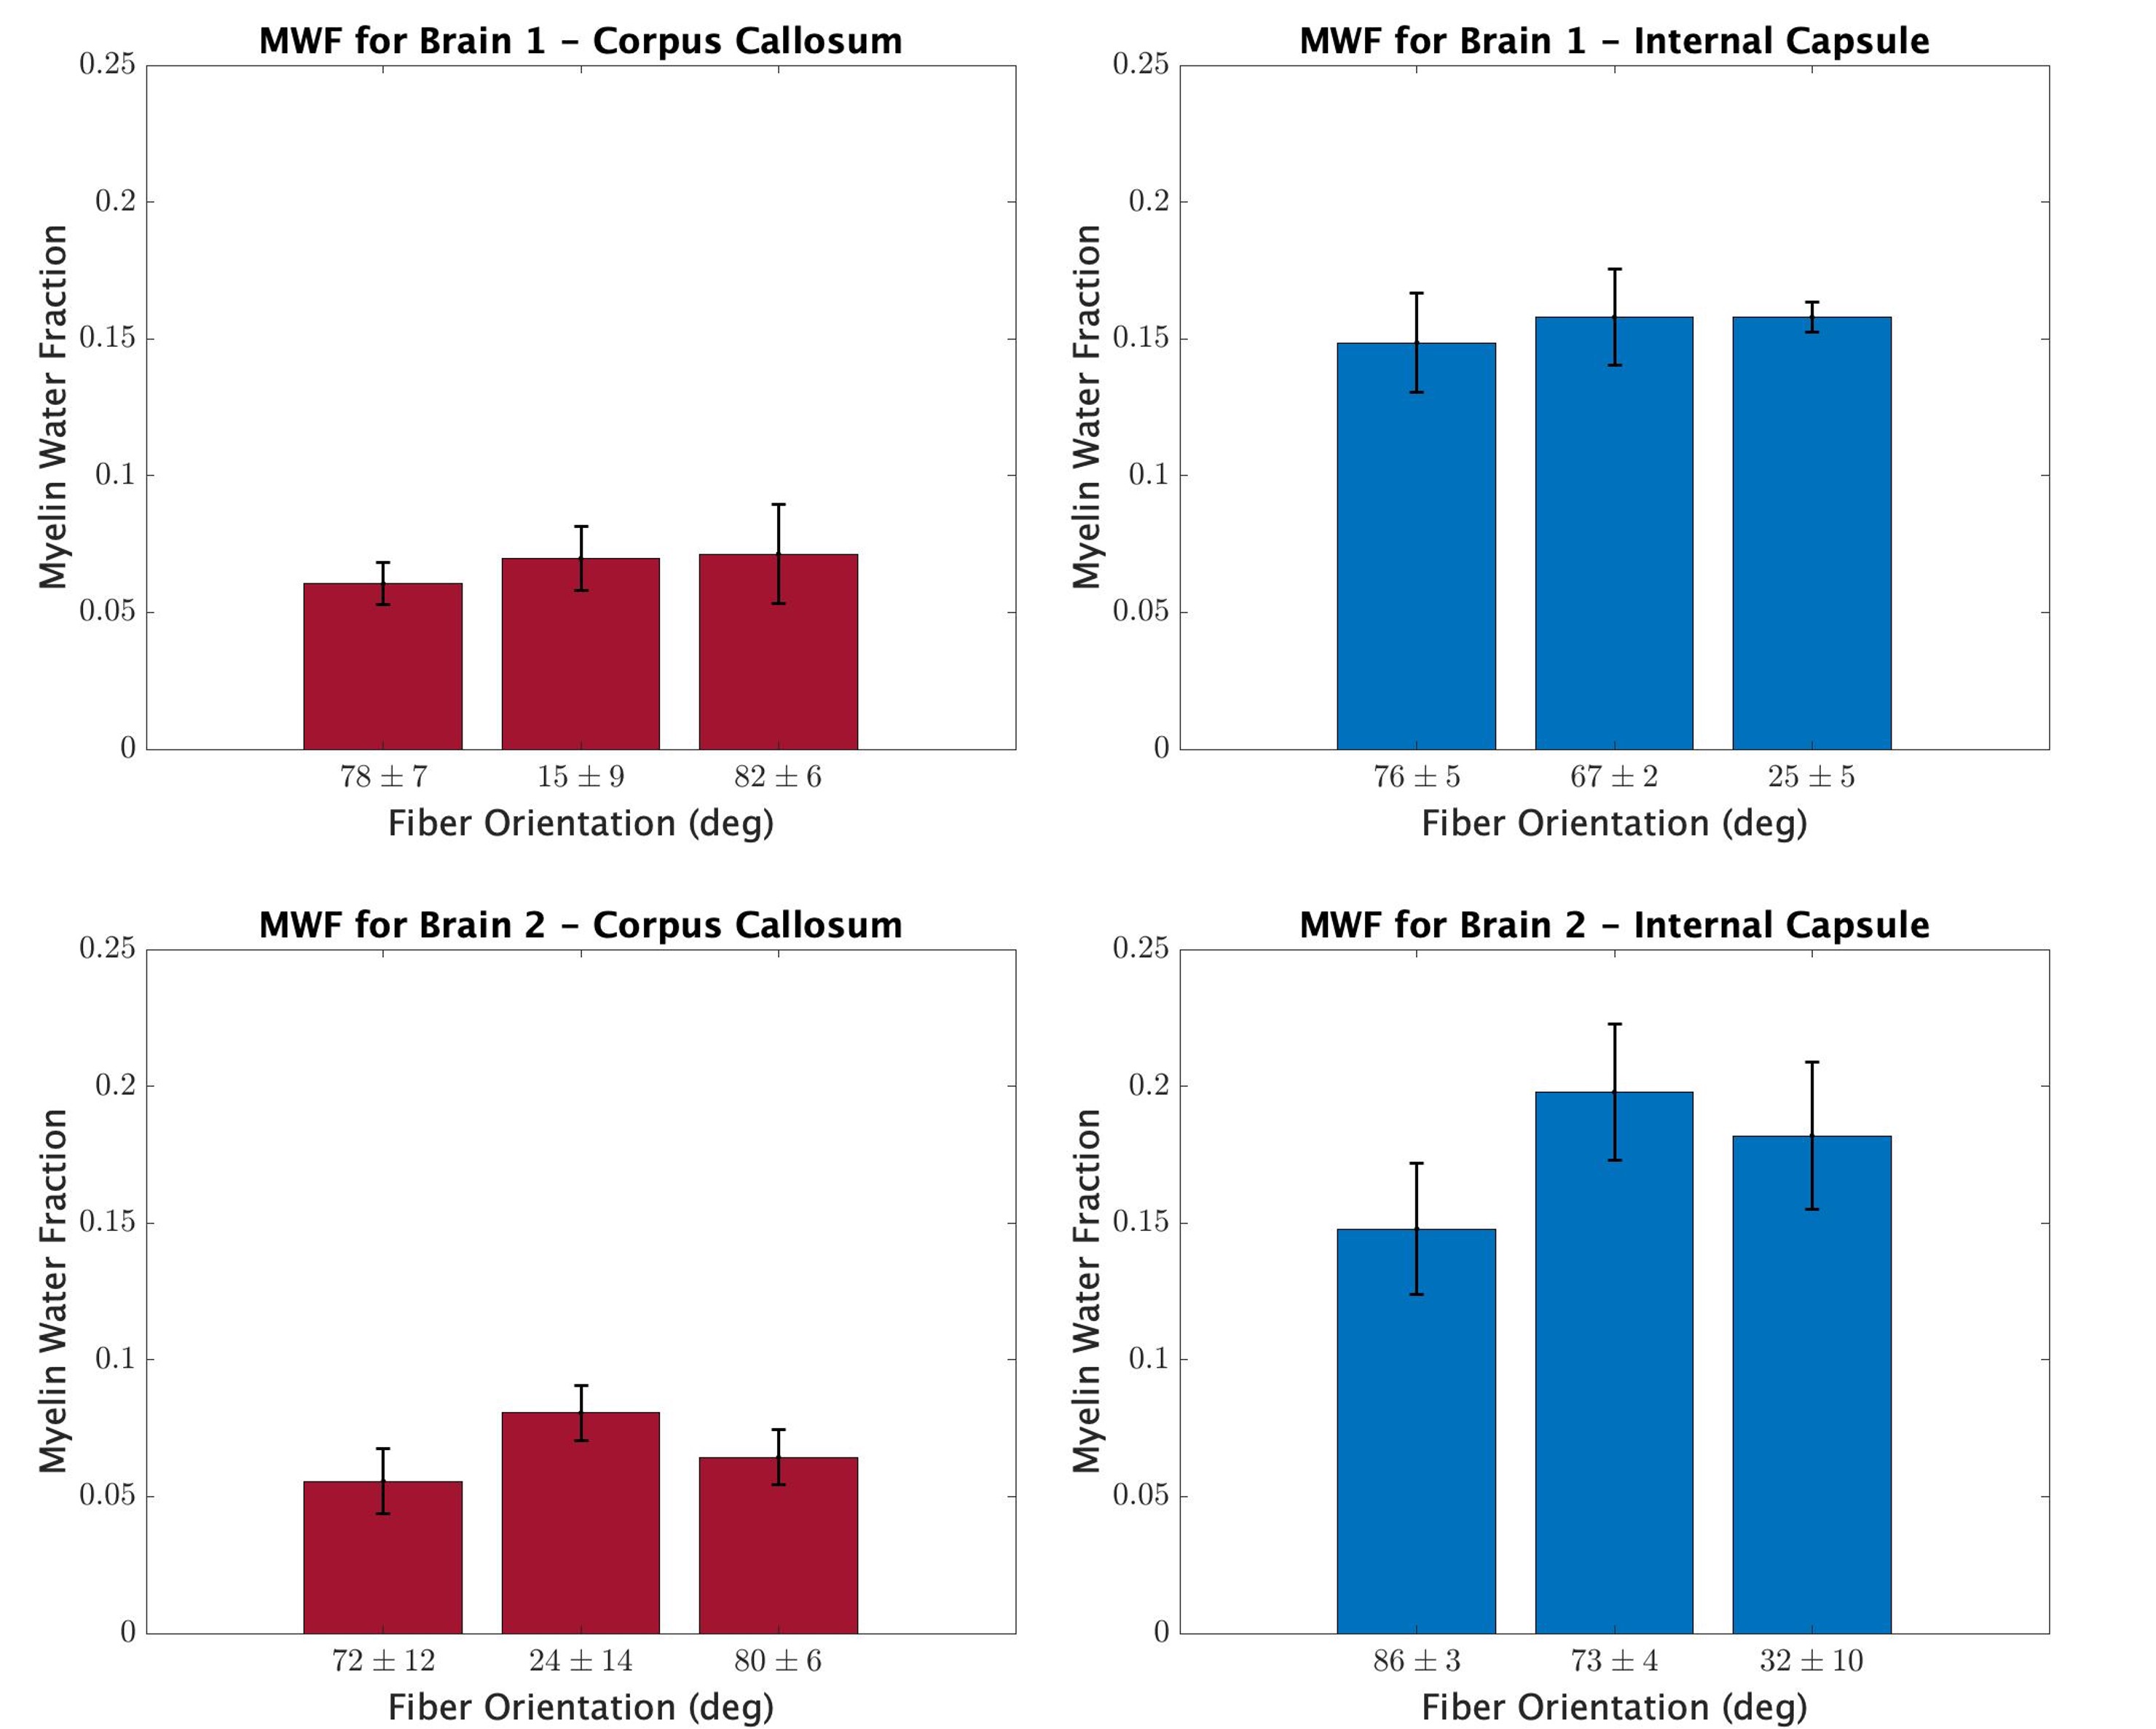
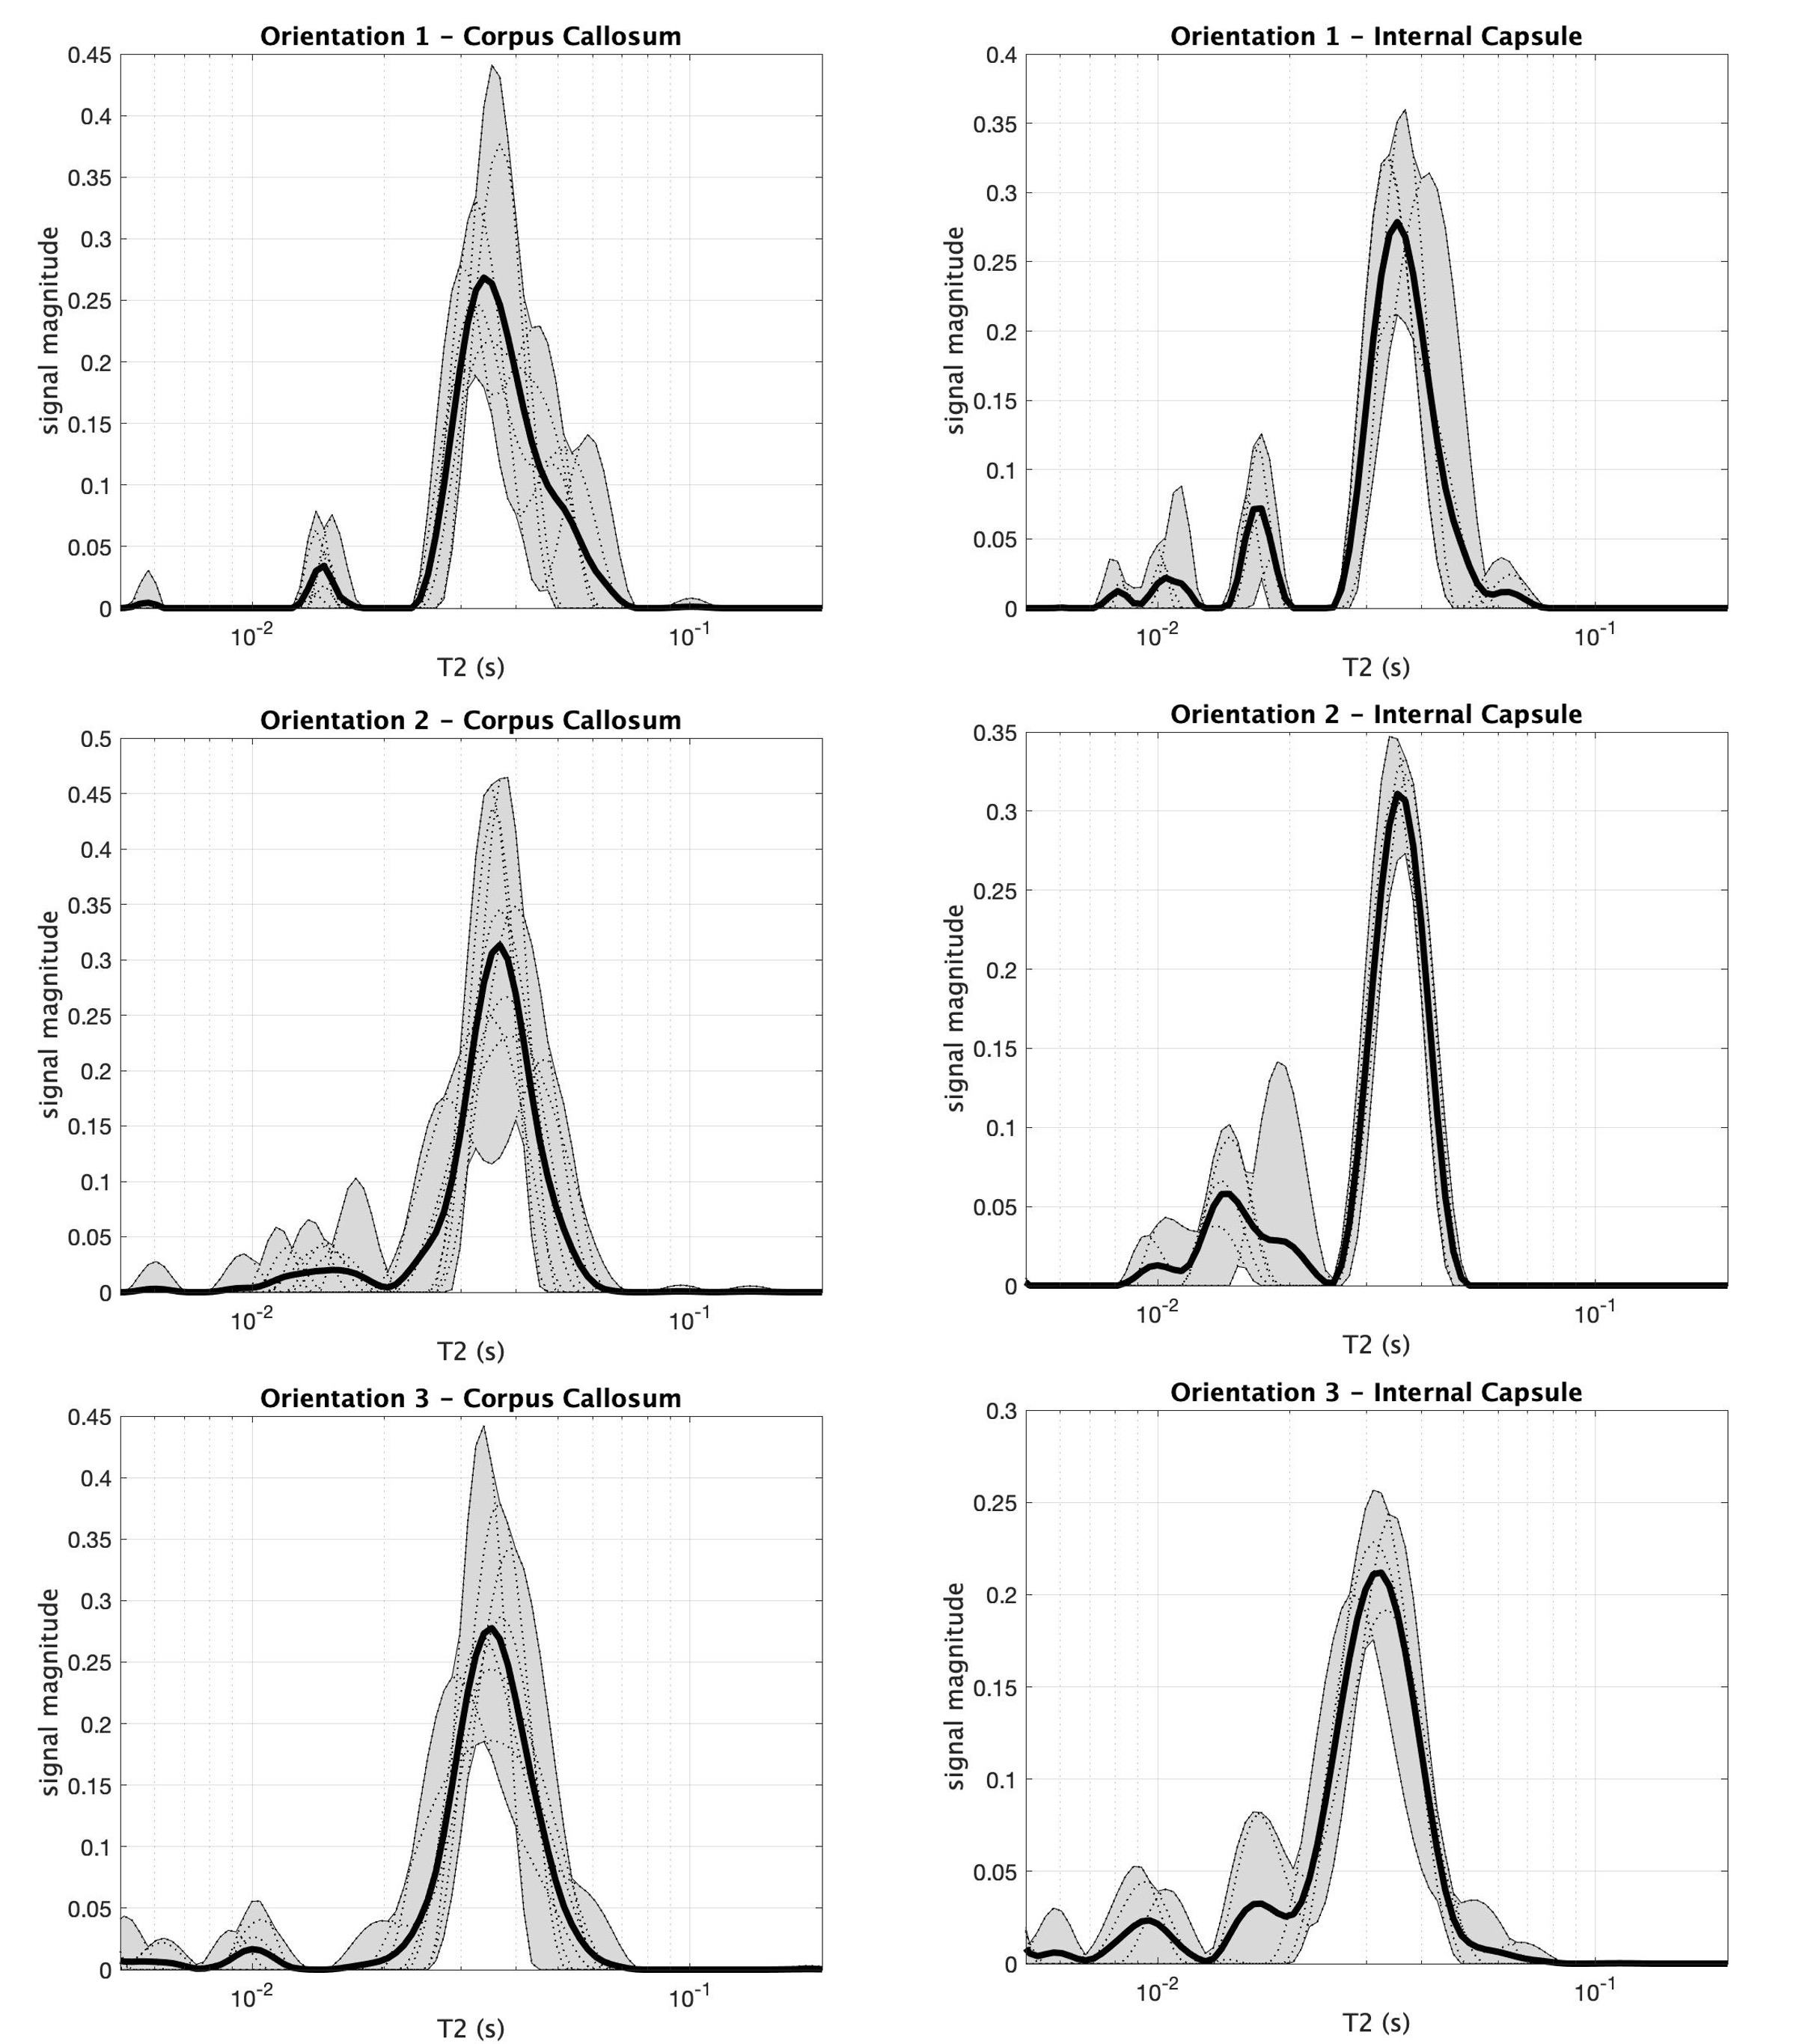
The mean MWF and fiber angle from each ROI and brain orientation are shown in Figure 3. As expected, and in agreement with previous work5, MWFs were consistently higher in the IC compared to the CC. However, across orientations in both ROIs, there was no consistent dependence of MWF on fiber orientation with respect to B0. This result is further supported by the T2 spectra in Figure 4, which show little dependence on fiber orientation.Discussion
Magnetic susceptibility is heavily implicated as the source of orientation dependence observed in T2* measurements, but its potential influence on T2 and, importantly, MWF, is less clear. This study found no orientation modulated variations in the T2 spectra or MWF from the CC, which is in good agreement with a study of fixed human corpus callosum samples1. There was a slight shift in the long T2 component for orientation 3 in the IC (Figure 4); however, as shown in Figure 3, this shift did not result in a substantially different MWF.Recently, Birkl and colleagues7 reported large MWF orientation dependence and in human subjects at 3-T. That study involved a voxel wise evaluation of MWF across the whole brain, and the variation in fiber orientation was a consequence of anatomy not independent rotation of the brain. As such, they could not account for anatomically induced variation in MWF between tracts. In contrast, our study focused on two heavily myelinated ROIs and used physical rotation of the brain. Narrowing the scope of investigation to specific white matter tracts and evaluating MWF at different physical orientations of those same tracts allowed for the direct assessment of orientation dependency. That said, the present study was done at 7-T on excised and fixed rat brains and interpreting the results in the context of in vivo human imaging should be done with some caution. Also, variance in MWF measurements due to finite precision MET2 analysis and manual ROI definitions across scans may have masked some orientation dependence of MWF. Additionally, we note that selection of different T2 domain for distinguishing myelin water signal in the T2 spectrum, accompanied with any minor shifts in T2 spectra, may further conceal any underlying orientational dependencies.
Conclusion
For the purpose of ex vivo rodent brain imaging, at least, this work demonstrates no appreciable influence of fiber orientation on MWF as measured by T2 relaxometry.Acknowledgements
Funding: National Science Foundation Graduate Research Fellowship, Vanderbilt University School of Engineering Faculty Funds
3D printed brain holder: Gary Drake, Senior Imaging Design Engineer
References
1. Oh, S. H., Kim, Y.B., Cho, Z. H. & Lee, J. Origin of B0 orientation dependent R2* (=1/T2*) in white matter. NeuroImage 73, 71-79 (2013).
2. Lee, J. et al. An R2* model of white matter for fiber orientation and myelin concentration. NeuroImage 162, 269-275 (2017).
3. Schyboll, F., Jaekel, U., Petruccione, F. & Neeb, H. Origin of orientation-dependent R1 (=1/T1) relaxation in white matter. Magnetic Resonance in Medicine 84, 2713-2723 (2020).
4. Tax, C.M. W. et al. Measuring compartmental T2-orientational dependence in human brain white matter using tiltable RF coil and diffusion-T2 correlation MRI. NeuroImage 236, 117967 (2021).
5. West, K. L. et al. Myelin volume fraction imaging with MRI. NeuroImage 182, 511-521 (2018).
6. Denk, C., Torres, E. H., MacKay, A. & Rauscher, A. The influence of white matter fibre orientation on MR signal phase and decay. NMR in Biomedicine 24, 246-252 (2011).
7. Birkl, C., Doucette, J., Fan, M., Hernández-Torres, E. & Rauscher, A. Myelin water imaging depends on white matter fiber orientation in the human brain. Magnetic Resonance in Medicine 85, 2221-2231 (2021).
Figures