2859
Practical and readily-available relaxometry method1Radiology, Brigham and Women's Hospital, Harvard Medical School, Boston, MA, United States, 2Computer Science and Engineering, National Sun Yat-sen University, Kaohsiung, Taiwan
Synopsis
Although many methods already exist to map T1, T2 and M0, these often involve special sequences not readily available on clinical scanners and/or may require long scan times. In contrast, the proposed method can run on most scanners, it offers flexible tradeoffs between scan time and image quality, and it generates spatially-aligned parameter maps. Validation was performed in gel phantoms with varying concentrations of contrast agents, and in vivo examples are presented from three neuroradiology patients. Compared to other quantitative mapping methods, the present method is meant to stand out in terms of its practicality and availability.
Introduction
Relaxometry methods are typically designed to generate quantitative maps of T1, T2 and/or T2*. However, many existing methods such as Look-Locker (1), SyMRI (2-4), MR fingerprinting (MRF) (5,6), DESS (7) or TESS (8) involve special sequences that are not readily available on most clinical scanners. Using separate acquisition methods to map T2 (9-14) and T1 (1,15-17) may lead to maps that are not accurately aligned with each other, and may lead to long overall acquisition times. While DESPOT (18,19) could allow the simultaneous mapping of both T1 and T2, its compatibility with faster echo planar imaging (EPI) sequences is not straightforward.In the context of our own work we found ourselves in need of a relaxometry method meeting these requirements: 1) can readily run on most scanners, 2) reaches reasonably-high acquisition rates, 3) offers flexible tradeoffs between imaging speed and image quality, and 4) generates maps of T1, T2 and M0 that spatially agree. We based our approach on the multi-shot spin-echo (SE) echo-planar imaging (EPI) sequence, derived the signal equation, and developed strategies to solve it. We performed validation in gel phantoms and present in vivo mapping examples in three neuroradiology patients.
Methods
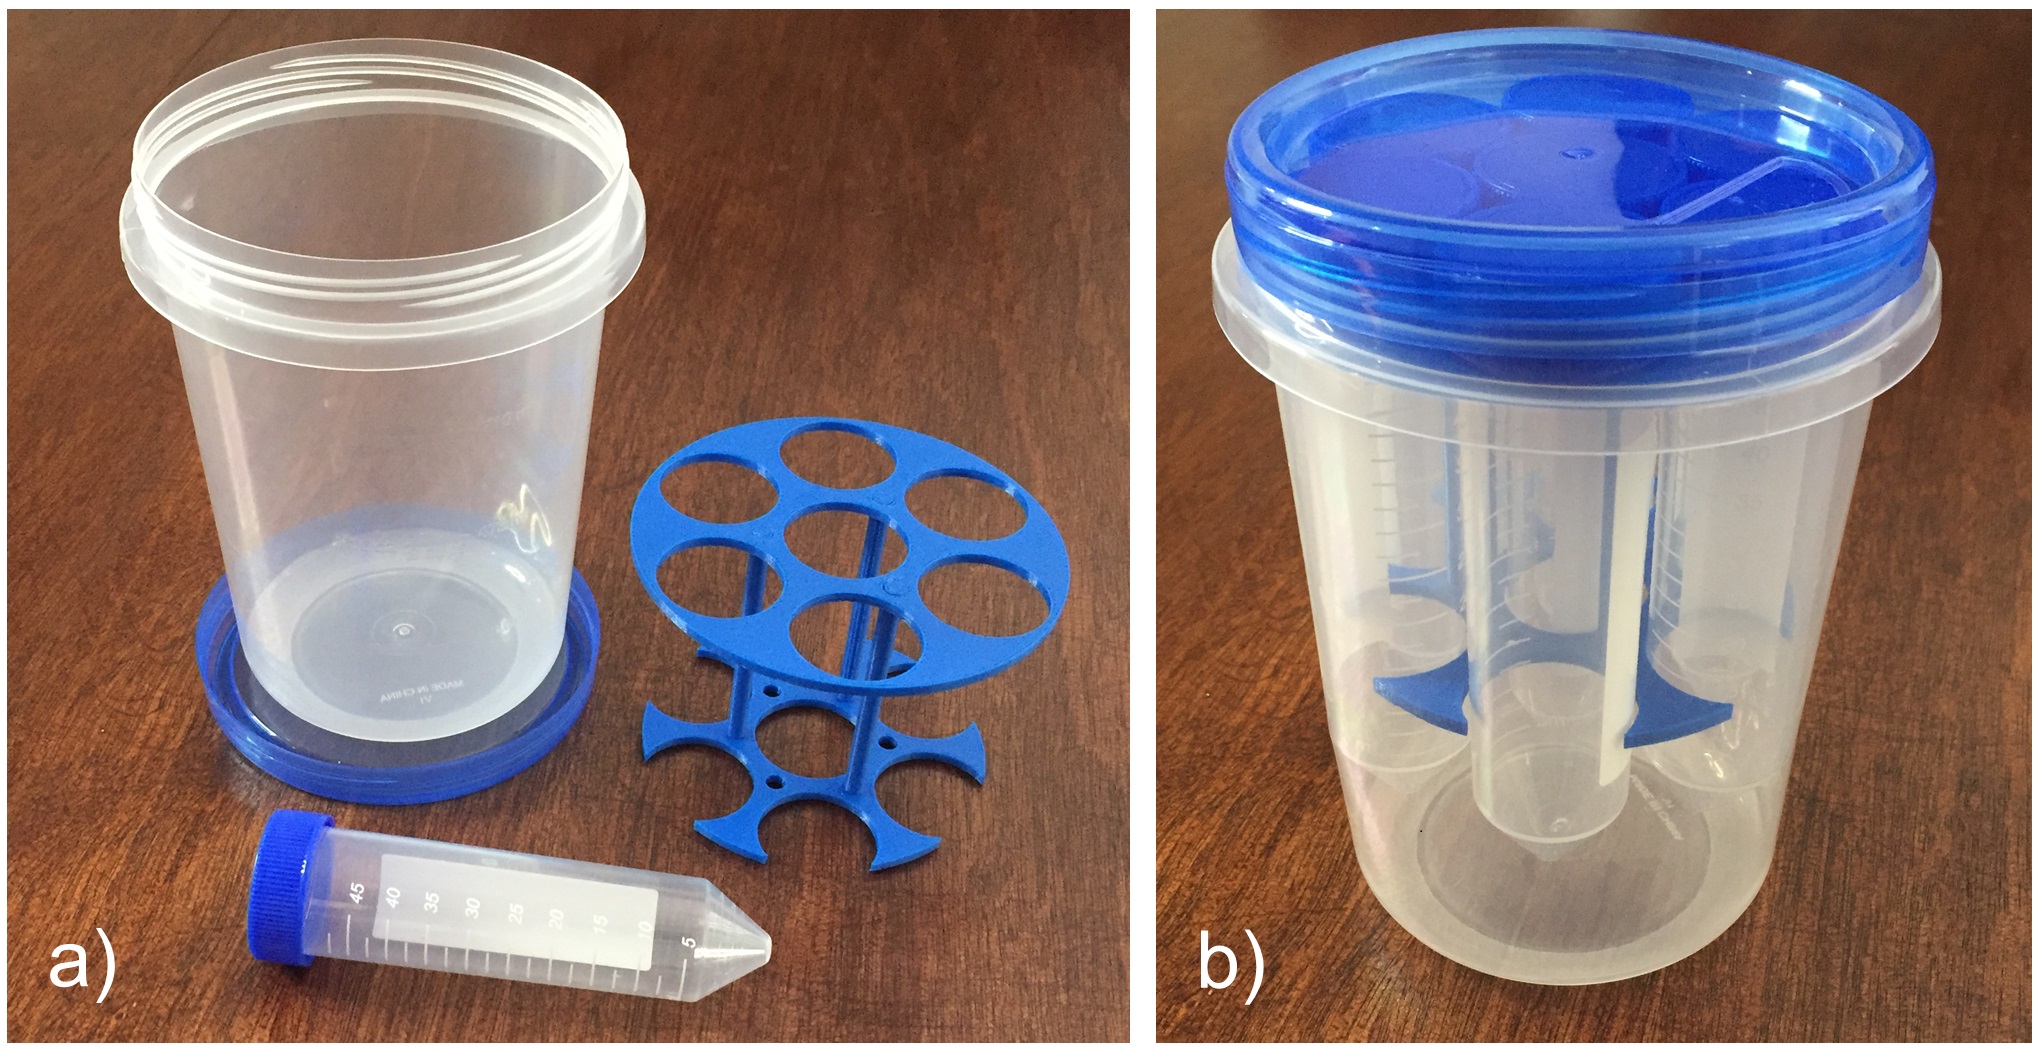
Gel phantoms were prepared with a gadoterate meglumine and a gadobutrol contrast agent (see Fig. 1). The vials were oriented roughly along B0, within the head coil of a 60-cm bore 3T scanner (Prisma Fit, Siemens). A multi-shot SE EPI sequence was employed (17 shots, echo-train-length (ETL)=11, 192×192 voxels, 24×24 cm2 FOV, 3 slices, 5 mm thickness, 18 TR/TE combinations with TR ranging from 200 to 5000ms and TE from 20 to 300ms, scan time 7min:01s). The T2 reference standard was obtained through a series of 2D SE images, and the T1 reference standard through inversion recovery (IR) SE scans, as well as MOLLI scans. In patient scans, the number of TR/TE combinations was reduced to 12 to reduce scan time to 4min:37s, and skipping TR settings below 424 ms allowed the number of slices to be increased to 10.The signal equation was derived, where α is the excitation pulse and β≈2×α is the refocusing pulse, and where relaxation in-between pulses is taken into account:
S(TR,TE) = M0×sin(α)×exp(-TE/T2) × (1-(1-cos(β))×exp(-(TR-TE/2)/T1)-cos(β)×exp(-TR/T1)) / (1-cos(α)×cos(β)×exp(-TR/T1))
The equation above does not allow all desired parameters (T1, T2, M0 and flip angle) to be solved at once. As such, a 26-s B1-mapping scan available on the scanner was used to measure α, and all other parameters were then evaluated from the equation above.
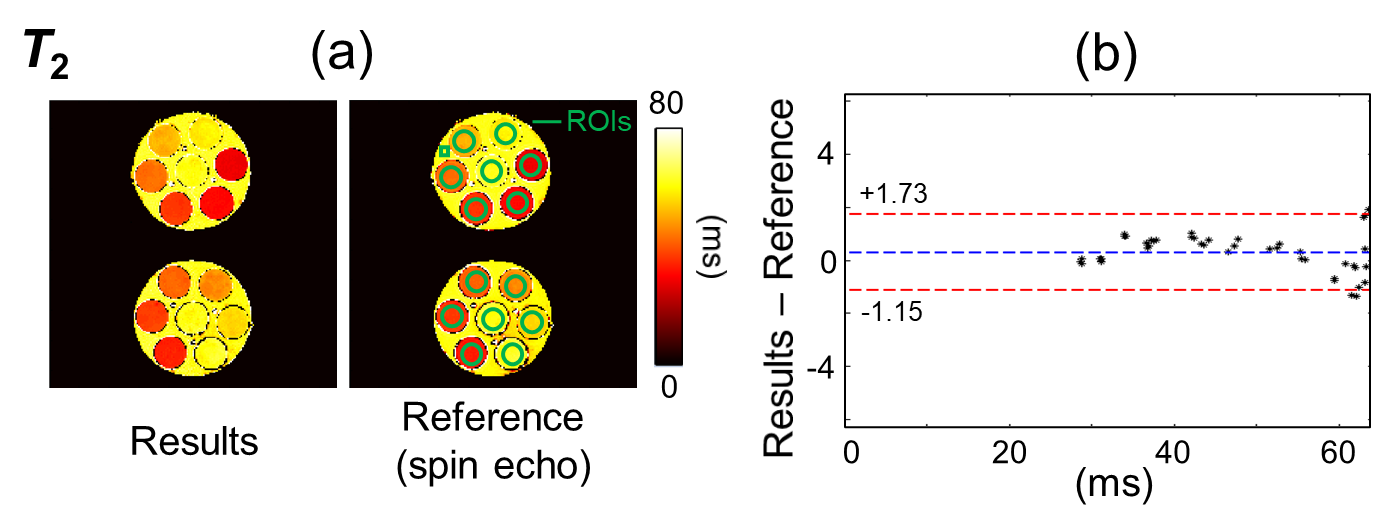
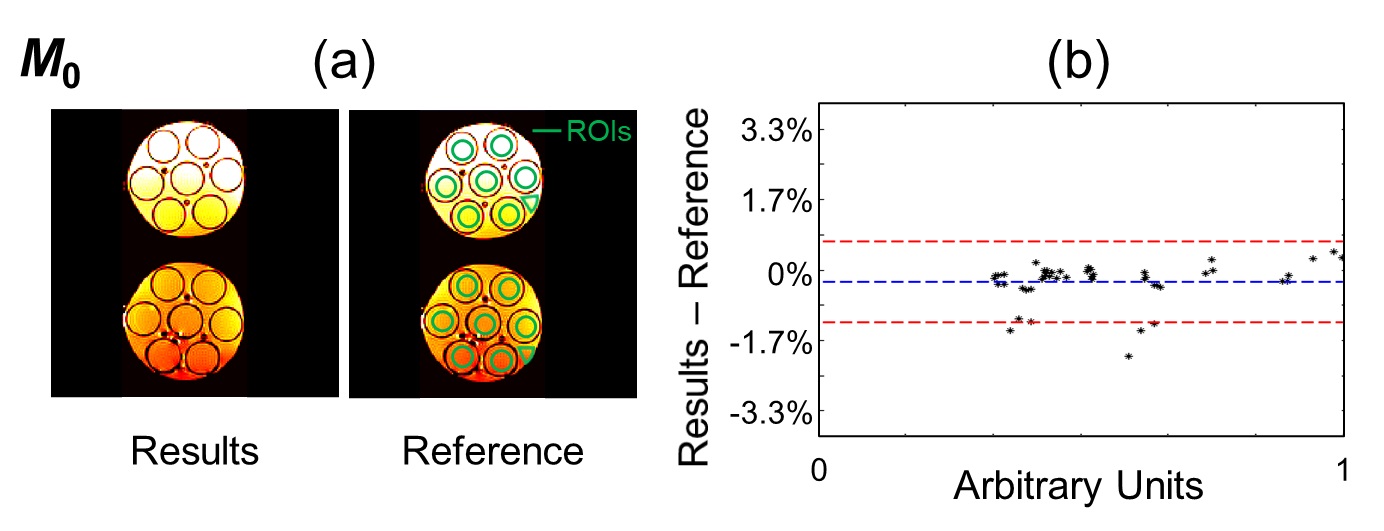
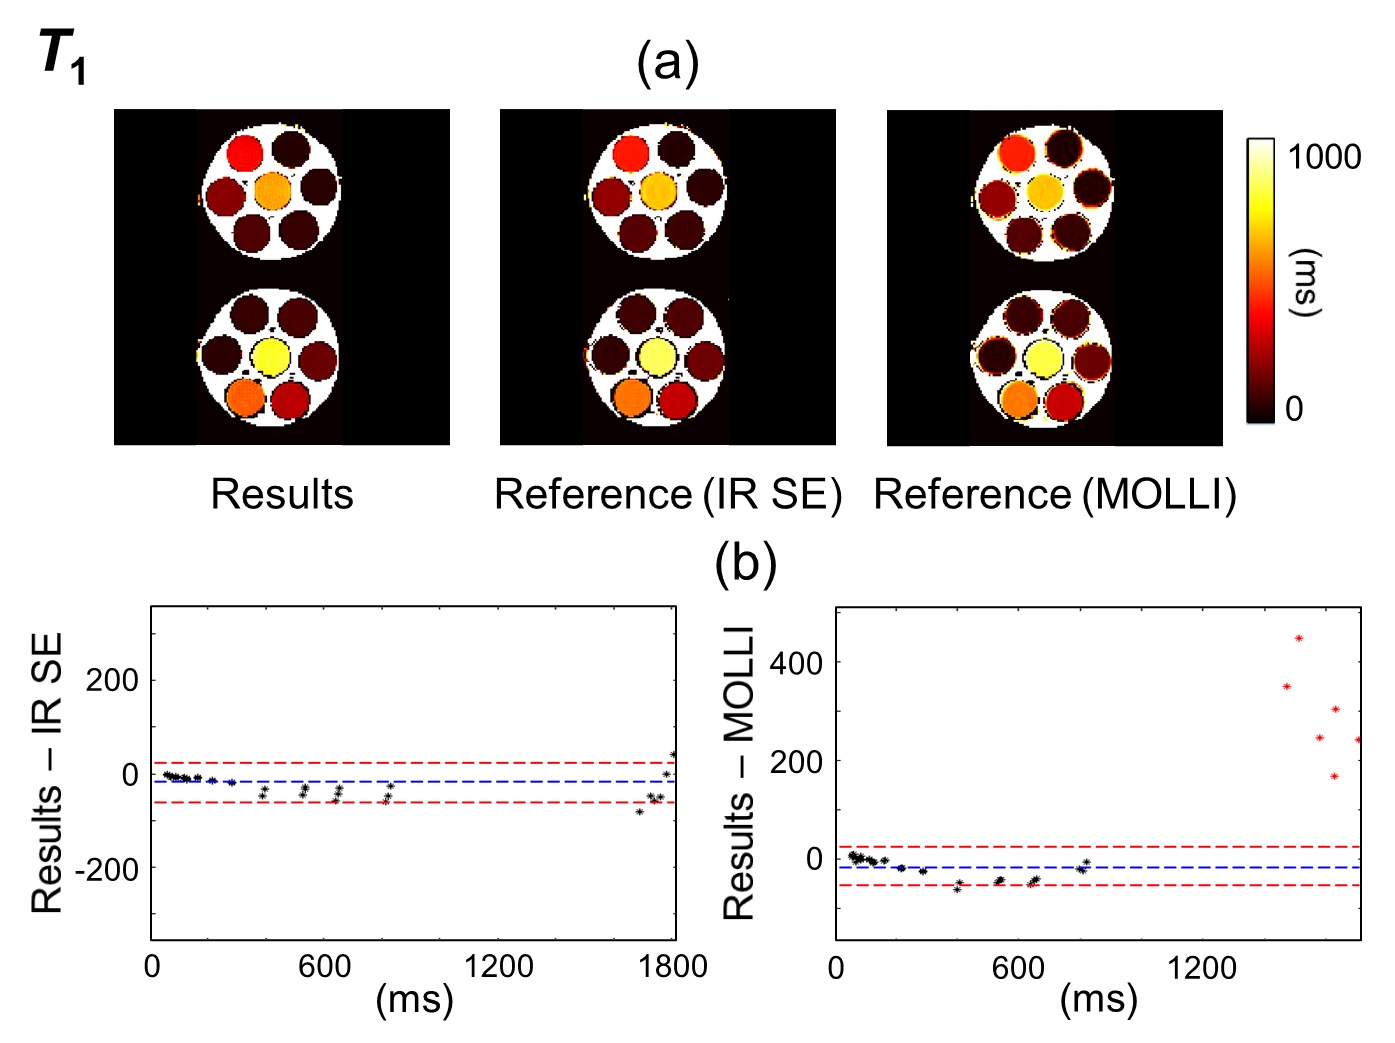
Regions of interest (ROIs) were drawn over the phantoms (green overlays in Fig. 2 and 3). T1, T2 and M0 values were obtained for the proposed method and the corresponding reference methods. Relaxivity values were also calculated, for both gadoterate meglumine and gadobutrol, based on the known contrast concentration in all vials.
Results
Figure 2-4 show validation results in the gel phantoms, for T2, M0 and T1, respectively. Because the overall scaling of the M0 maps, which is weighed by the receive sensitivity of the receive coils, is of little interest, a value of ‘1’ was simply assigned to the strongest signal. As seen in Fig. 2-4, the bias and the 95% limits of agreement were: for T2, 0.29 ms and [-1.15ms to +1.73ms]; for M0, -0.29% and [-1.24% to +0.67%]; for T1 (vs. IR SE), -20.2 ms and [-62.4ms to +22.0ms]; and finally, for T1 (vs. MOLLI), -14.5ms and [-53.8ms to +24.9ms].For T1, the mean relative error, averaged over all ROIs and slices, was 6.7% compared to the IR SE reference and 7.7% compared to the MOLLI reference. These numbers were similar to the error calculated between the two reference methods, IR SE vs. MOLLI, which was measured at 7.9%.
The r1 / r2 relaxivity of gadoterate meglumine and gadobutrol was measured as 5.5±0.4 / 6.3±0.5 L/(mmol·s), and 7.0±0.9 / 8.5±1.1 L/(mmol·s), respectively, slightly higher than previously-published values at 3T (20,21), which were measured in blood products at body temperature.
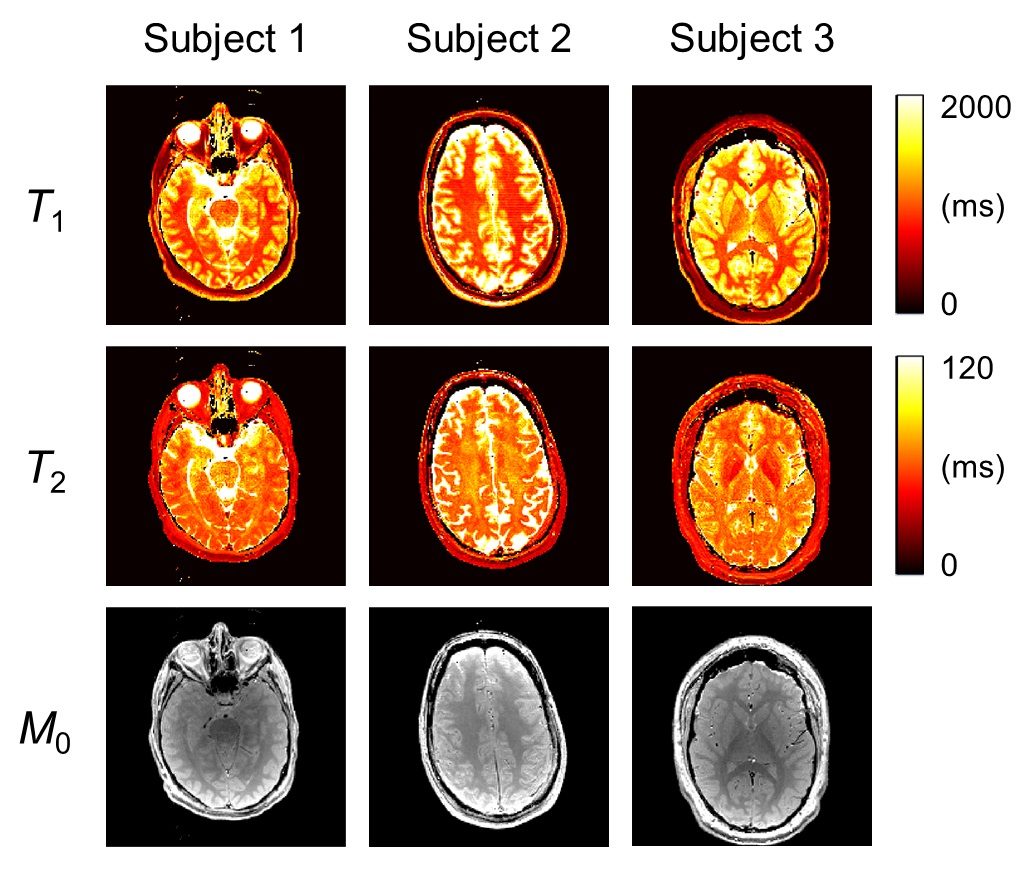
Examples of in vivo results from the three neuroradiology patients are shown in Fig. 5, see caption for more details.
Discussion
Many relaxometry method have been proposed in the literature. The proposed approach is not meant to be the most elaborate or most accurate, it is instead intended as a practical tool. Its main strengths are that it readily runs on most scanners with EPI capabilities, enables reasonably-short scan times, offers easy tradeoffs between imaging speed and quality (through the ETL and/or sampled TR/TE combinations), and it generates maps of T1, T2 and M0 that are spatially aligned. With an acquisition rate of about 2 slices per minute of scan (as in Fig. 5), the present method operates in a similar regime as more elaborate methods such as SyMRI (roughly 4 slices/min in (2,4)) and MRF (about 1 slice/min of scan in (6) and further accelerated in (22)). Bland-Altman analysis showed good agreement with reference methods (Fig. 2-4, respectively).Conclusion
While many excellent relaxometry methods have been published, the proposed approach is based on a single pulse sequence (multi-shot SE EPI) and its corresponding signal equation, and could prove a readily available/practical tool for clinical relaxometry.Acknowledgements
Support from NIH grant R01EB030470 is acknowledged.References
1. Look D, Locker D. Time saving in measurement of NMR and EPR relaxation times. Rev Sci Instrum 1970;41:250-251.
2. Warntjes JB, Leinhard OD, West J, Lundberg P. Rapid magnetic resonance quantification on the brain: Optimization for clinical usage. Magn Reson Med 2008;60(2):320-329.
3. Blystad I, Warntjes JB, Smedby O, Landtblom AM, Lundberg P, Larsson EM. Synthetic MRI of the brain in a clinical setting. Acta Radiol 2012;53(10):1158-1163.
4. Tanenbaum LN, Tsiouris AJ, Johnson AN, Naidich TP, DeLano MC, Melhem ER, Quarterman P, Parameswaran SX, Shankaranarayanan A, Goyen M, Field AS. Synthetic MRI for Clinical Neuroimaging: Results of the Magnetic Resonance Image Compilation (MAGiC) Prospective, Multicenter, Multireader Trial. AJNR Am J Neuroradiol 2017;38(6):1103-1110.
5. Ma D, Gulani V, Seiberlich N, Liu K, Sunshine JL, Duerk JL, Griswold MA. Magnetic resonance fingerprinting. Nature 2013;495(7440):187-192.
6. Korzdorfer G, Kirsch R, Liu K, Pfeuffer J, Hensel B, Jiang Y, Ma D, Gratz M, Bar P, Bogner W, Springer E, Lima Cardoso P, Umutlu L, Trattnig S, Griswold M, Gulani V, Nittka M. Reproducibility and Repeatability of MR Fingerprinting Relaxometry in the Human Brain. Radiology 2019;292(2):429-437.
7. Bruder H, Fischer H, Graumann R, Deimling M. A new steady-state imaging sequence for simultaneous acquisition of two MR images with clearly different contrasts. Magn Reson Med 1988;7(1):35-42.
8. Heule R, Ganter C, Bieri O. Triple echo steady-state (TESS) relaxometry. Magn Reson Med 2014;71(1):230-237.
9. Poon CS, Henkelman RM. Practical T2 quantitation for clinical applications. J Magn Reson Imaging 1992;2(5):541-553.
10. Deoni SC. Transverse relaxation time (T2) mapping in the brain with off-resonance correction using phase-cycled steady-state free precession imaging. J Magn Reson Imaging 2009;30(2):411-417.
11. Bieri O, Scheffler K, Welsch GH, Trattnig S, Mamisch TC, Ganter C. Quantitative mapping of T2 using partial spoiling. Magn Reson Med 2011;66(2):410-418.
12. Welsch GH, Scheffler K, Mamisch TC, Hughes T, Millington S, Deimling M, Trattnig S. Rapid estimation of cartilage T2 based on double echo at steady state (DESS) with 3 Tesla. Magn Reson Med 2009;62(2):544-549.
13. Deoni SC, Ward HA, Peters TM, Rutt BK. Rapid T2 estimation with phase-cycled variable nutation steady-state free precession. Magn Reson Med 2004;52(2):435-439.
14. Sveinsson B, Chaudhari AS, Gold GE, Hargreaves BA. A simple analytic method for estimating T2 in the knee from DESS. Magn Reson Imaging 2017;38:63-70.
15. Kay I, Henkelman RM. Practical implementation and optimization of one-shot T1 imaging. Magn Reson Med 1991;22(2):414-424.
16. Treier R, Steingoetter A, Fried M, Schwizer W, Boesiger P. Optimized and combined T1 and B1 mapping technique for fast and accurate T1 quantification in contrast-enhanced abdominal MRI. Magn Reson Med 2007;57(3):568-576.
17. Hurley SA, Yarnykh VL, Johnson KM, Field AS, Alexander AL, Samsonov AA. Simultaneous variable flip angle-actual flip angle imaging method for improved accuracy and precision of three-dimensional T1 and B1 measurements. Magn Reson Med 2012;68(1):54-64.
18. Deoni SC, Rutt BK, Peters TM. Rapid combined T1 and T2 mapping using gradient recalled acquisition in the steady state. Magn Reson Med 2003;49(3):515-526.
19. Deoni SC, Rutt BK, Arun T, Pierpaoli C, Jones DK. Gleaning multicomponent T1 and T2 information from steady-state imaging data. Magn Reson Med 2008;60(6):1372-1387.
20. Rohrer M, Bauer H, Mintorovitch J, Requardt M, Weinmann H-J. Comparison of magnetic properties of MRI contrast media solutions at different magnetic field strengths. Investigative radiology 2005;40:715-724.
21. Shen Y, Goerner FL, Snyder C, Morelli JN, Hao D, Hu D, Li X, Runge VM. T1 relaxivities of gadolinium-based magnetic resonance contrast agents in human whole blood at 1.5, 3, and 7 T. Investigative radiology 2019;50:330-338.
22. Ma D, Jiang Y, Chen Y, McGivney D, Mehta B, Gulani V, Griswold M. Fast 3D magnetic resonance fingerprinting for a whole-brain coverage. Magn Reson Med 2018;79(4):2190-2197.
Figures