2857
Quantitative characterization of fibrous tissues in the knee joint using magnetization prepared 3D spiral UTE sequence at 3 T1Section on Experimental Radiology, University Hospital of Tübingen, Tübingen, Germany, 2Department of Diagnostic and Interventional Radiology, University Hospital of Tübingen, Tübingen, Germany, 3Institute of Signal Processing and System Theory, University of Stuttgart, Stuttgart, Germany, 4MR Application Predevelopment, Siemens Healthcare GmbH, Erlangen, Germany
Synopsis
Magnetization prepared 3D spiral UTE sequences were developed for T1, T2, T1rho and MTR measurements of fibrous structures. The robustness of the parameter mapping for tendons, ligaments, menisci, cartilage and muscle of the human knee joint was evaluated in a test-retest repeatabilty study. Multiparametric UTE imaging was successfully performed for both test and retest examination. The results of the study demonstrate good repeatability of the applied multiparametric protocol. Parameter maps such as T2 and T1rho show less robustness than T1 and MTR measurements. Especially with small structures as tendons and ligaments, there is the least agreement between scan and rescan.
INTRODUCTION
Fibrous structures in tendons, ligaments and menisci usually do not present detectable signal in conventional MR sequences due to their rapid signal decay. With the help of so-called ultrashort TE sequences (UTE) sufficient signal can be acquired allowing visualization of these tissues 1. In addition to pure visualization, the acquired signal also offers the possibility of further characterization of those tissues. The primary goal of this study was to develop and evaluate magnetization prepared UTE sequences for the measurements of T2, T1rho, T1 and magnetization transfer ratio (MTR). A secondary goal was to assess the robustness of the quantitative parameter measurements for various tissues in the human knee joint in a test-retest repeatabilty study of healthy volunteers.METHODS
Experimental: The study was performed on a 3T MR scanner (MAGNETOM Prismafit, Siemens Healthcare, Erlangen, Germany) using a 15-channel RX/TX knee coil. For the repeatability evaluation eight healthy volunteers (26±3 years, 4 female/4 men) were examined twice with approx. 2 weeks between measurements. The measurements of T1, T1rho, T2 relaxation times and magnetization transfer ratio (MTR) were performed with magnetization prepared 3D spiral UTE prototype sequences. Total examination time comprises about one hour. The parameters of the UTE spiral sequence were identical in all measurements: TR 5.0 ms, TE 50 µs, FOV 160×160×144 mm3, matrix 192×256×48, voxel size 0.83×0.83×3 mm3, spiral interleaves 72 and spiral duration 2.12 ms. A non-selective 60 µs RF pulse with flip angle of 6° was applied.For T1 measurements the magnetization recovery method based on a 90° saturation pulse was utilized. Recovery delay times (TD) of 100, 200, 400, 800, 1600, 3200, 4800 ms were used. The T2 and T1rho measurements were performed using adequate magnetization preparation methods 2,3. For T2 magnetization preparation a pulse series of 90°y ̶ (TEprep/4) ̶ 180°x ̶ (TEprep/2) ̶ 180°-x ̶ (TEprep/4) ̶ 90°-y was applied. Measurements were performed with TEprep times of 4.6, 9.2, 13.8, 18.4, 23.0, and 27.6 ms. A spin-lock (SL) RF pulse with a pulse series of 90°y ̶ (SLx) ̶ 90°-y was used for T1rho magnetization preparation. The amplitude of the SL pulse was 5.9 µT in all T1rho measurements and SL times (TSL) were 4, 8, 12, 16, 20, and 24 ms. A pulse series with duration of 1024 ms was applied for MT measurements. Gaussian pulses with flip angle of 540°, duration of 10.24 ms and frequency offset of -2 kHz were applied. Figure 1 shows the schematic of the 3D spiral UTE sequence used.
Analysis: All image registration steps were conducted by the open-source toolbox elastix4,5 using an in-house developed MATLAB® (The Mathworks, Natick, MA) script. Based on registered images, T1, T2 and T1rho maps were calculated using least squares fits. MTR maps were calculated based on equation: MTR = (S0-S)/S, where S0, S are signal intensities measured without and with MT preparation, respectively. ROI-based image analysis was performed on parameter maps for posterior cruciate ligaments, menisci, quadriceps and patellar tendons as well as for muscle and cartilage tissues. For assessment of agreement between scans the repeatability coefficient, RC, and the within-subject coefficient of variation, wCV, were calculated as follows: RC = 2.77 × wSD, wCV = wSD/m, with wSD =√1/2n∑indi , where d and m are the difference and mean values for test-retest measurements, and n is the number of subjects. For visualization of the test-retest agreement, Bland-Altman plots were generated.
RESULTS
Multiparametric MRI of the knee joint of eight healthy volunteers was successfully performed for both test and retest examination. Examples for T1, T2, T1rho and MTR mapping are shown in Figure 2. The results of the test-retest analysis are summarised in Table 1. The wCV ranged from 2.8 ̶ 41.5% with generally higher wCV for quadriceps and patella tendons and cruciate ligament in comparison to meniscus, cartilage and muscle. Lowest wCV for MTR maps and highest wCV for T2 measurements were calculated. The RC ranged from 8 ̶ 115% with T2 mapping showing least agreement between scan and rescan. The Bland-Altman plots for all four parameters depicted in Figure 3.DISCUSSION
In the presented work, T1, T2, T1rho relaxation times and MTR values of musculoskeletal tissues such as tendons, ligaments and menisci have been quantified using magnetization prepared 3D spiral UTE sequences. The preliminary results of the study demonstrate good repeatability of the applied multiparametric protocol. Parameter maps such as T2 and T1rho show less robustness than T1 and MTR measurements. However, the acceptability of limits for repeatability and robustness always depend on the clinical question. The application of a ROI-based image analysis is a selective and not fully objective method. Therefore, automated image segmentation should be aimed for the final data analysis. Nevertheless, the preliminary data evaluation gives a first impression of the robustness of the sequences used.Acknowledgements
No acknowledgement found.References
1. Gatehouse PD, Bydder GM. Magnetic resonance imaging of short T2 components in tissue. Clin Radiol. 2003;58(1):1-19.
2. Mugler JP, Spraggins TA, Brookeman JR. T2-weighted three-dimensional MP-RAGE MR imaging. J Magn Reson Imag. 1991;1(6):731-737.
3. Li X, Han ET, Busse RF, Majumdar S. In vivo T(1rho) mapping in cartilage using 3D magnetization-prepared angle-modulated partitioned k-space spoiled gradient echo snapshots (3D MAPSS). Magn Reson Med. 2008;59(2):298-307.
4. Klein S, Staring M, Murphy K, et al. Elastix: a toolbox for intensity based medical image registration. IEEE Trans Med Imaging. 2010;29(1):196–205.
5. Shamonin DP, Bron EE, Lelieveldt BPF, et al. Fast parallel image registration on CPU and GPU for diagnostic classification of Alzheimer’s disease. Front Neuroinform. 2014;7:50.Figures
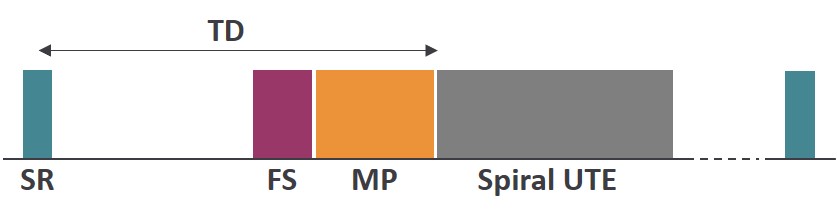
Figure 1: Schematic of a magnetization prepared 3D spiral UTE sequence. The sequence allows T1, T2, T1rho and MT measurements using a saturation recovery (SR) module and corresponding preparation modules (MP). For T2 and T1rho measurements, a fat saturation (FS) module was also used. Different recovery delay times (TD) were used for T1 measurements and a constant TD of 2 sec was utilized for T1rho and T2 studies.
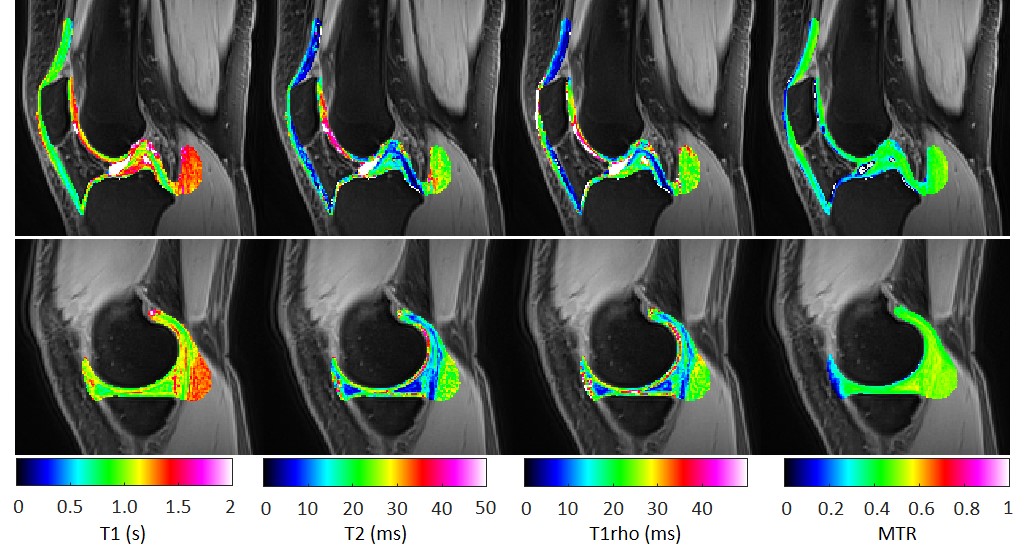
Figure 2: Parameter maps from two subjects (1 and 7). For better visualization, a fusion of selected regions of the T1-, T2-, T1rho- and MTR-maps with an anatomical image of the knee is shown.
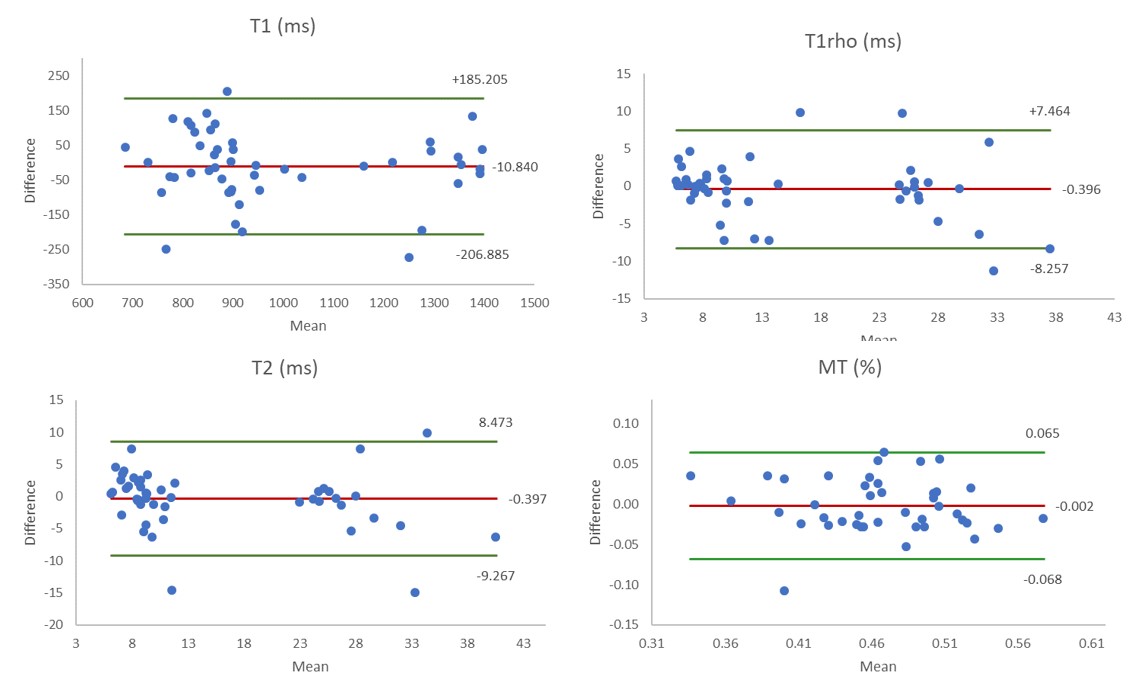
Figure 3: Bland-Altman plots for T1, T2, T1rho and MTR parameters of all eight volunteer measurements calculated for all tissues.
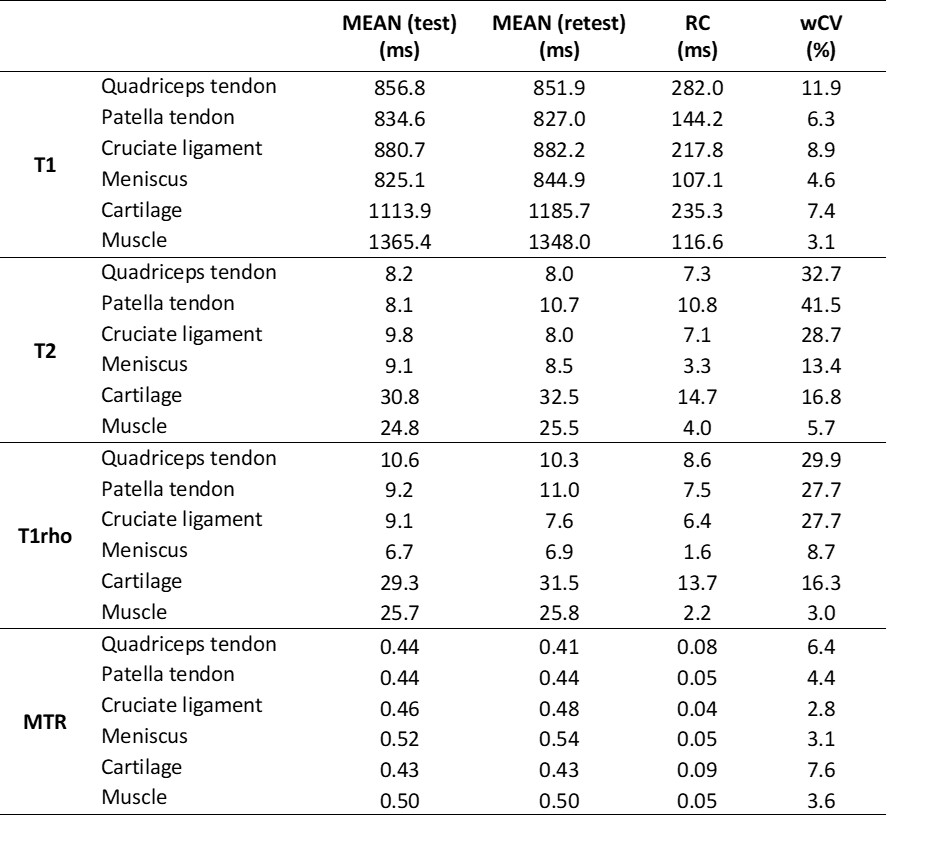
Table 1: Results of test-retest repeatability study in healthy volunteers (RC: repeatability coefficient, wCV: within subject coefficient of variation).