2855
An initial multi-parametric imaging experience of MULTIPLEX at 5T whole body system1UIH America, Inc., Houston, TX, United States, 2United Imaging Healthcare, Shanghai, China
Synopsis
In this work, we evaluated the performance of a recently proposed high resolution multi-parametric method, i.e. MULTIPLEX, on a state-of-the-art 5T whole body scanner. Comparing to the 3T counterpart, MULTIPLEX on 5T generally offers improved SNR, image quality and imaging efficiency, while maintaining satisfactory performance on B1/T1 mapping.
Introduction
It has long been a challenge for most currently available multi-parametric imaging methods to achieve satisfactory performance on ultra-high fields (>3T) due to several major factors, such as the elevated specific absorption rate (SAR) and peripheral nerve stimulation (PNS) level, longer T1 and shorter T2/T2* relaxometries, stronger B1+ inhomogeneity and chemical shifts, to name a few. For instance, the increased SAR level prohibits faster scans with spin echo based methods1, the longer T1 requires longer TR and/or TI (thus longer scan times) for adequate signal recovery1, and the shorter T2* effectively reduces the imaging resolution of EPI2 and SPIRAL3 methods through the intrinsic filtering effect during readouts.Recently, a dual-TR, dual-FA, multi-echo GRE based multi-parametric imaging method, namely MULTIPLEX4, was proposed and demonstrated on 3T. In principle, GRE based methods can offer better performance at ultra-high fields in terms of T1, PD, susceptibility, SNR and scan times, while without limitations on imaging resolution or SAR levels. However, the more severe B1+ field inhomogeneity may potentially hamper the accuracy of T1 mapping5. Therefore, this work aims to evaluate the MULTIPLEX performance at a newly introduced field strength of 5T6, in comparison with well-controlled 3T results.
Methods
High resolution MULTIPLEX brain images were collected on the same healthy volunteer (male, 36/yro, passed safety screening and gave written consents) on a 5T whole body scanner (uMR Jupiter, United Imaging Healthcare, Shanghai, China) with a 48-channel head coil, as well as on a 3T scanner (uMR790, United Imaging Healthcare, Shanghai, China) also with a 48-channel head coil.For this initial comparison tests, the same scanning protocol was used on both fields, including following key parameters4: 7 echoes with TE = 3.05~23.24ms, TR1/TR2 = 7.54/32.46ms, FA1/FA2 = 4°/16°, matrix size = 272x231x72 and voxel size = 0.8x0.8x2mm3, bandwidth = 260Hz/px. With 2x acceleration, the total scan time was 8:10.
Dicom images of the MULTIPLEX scans were directly reconstructed by the integrated reconstruction pipeline on both scanners and can be readily compared. Furthermore, raw k-space data of both scans were saved and processed offline to evaluate the imaging signal-to-noise ratio (SNR) of individual echo images.
Results
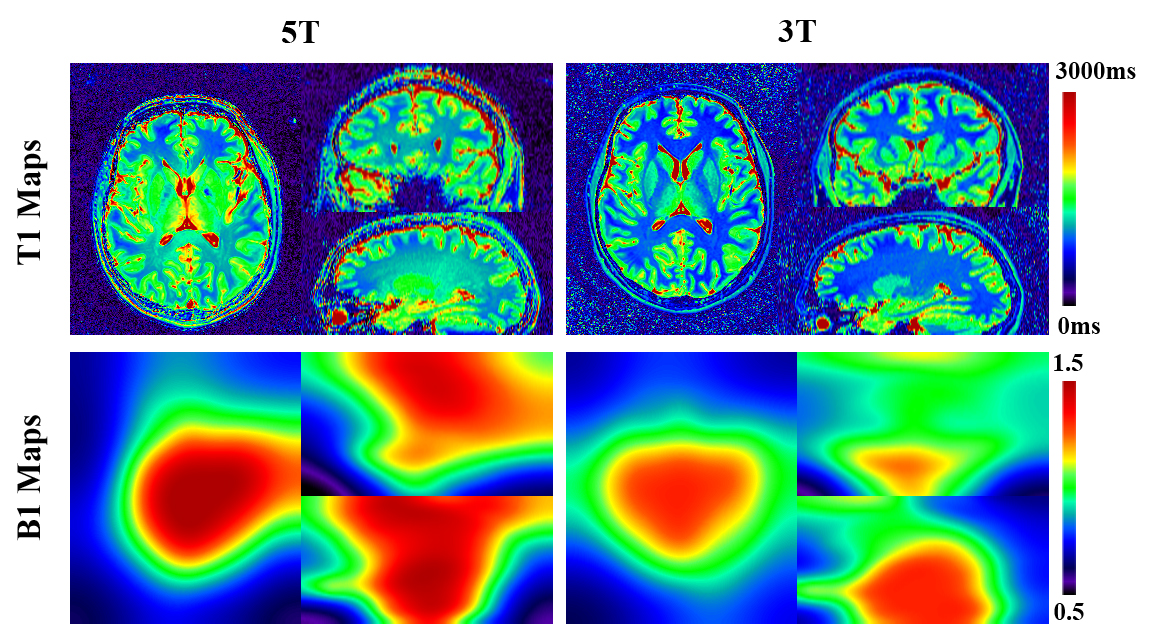
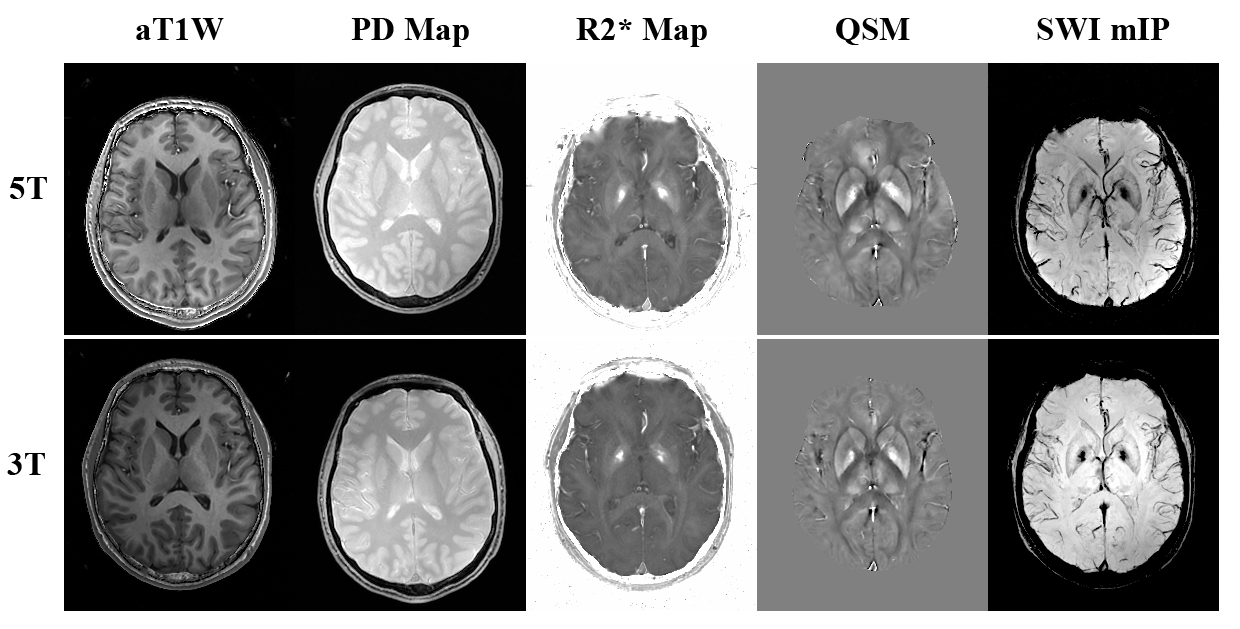
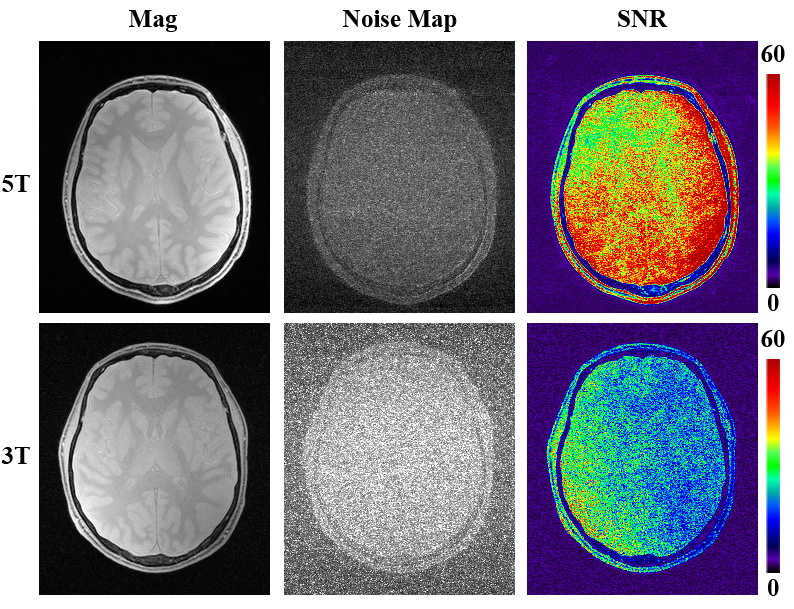
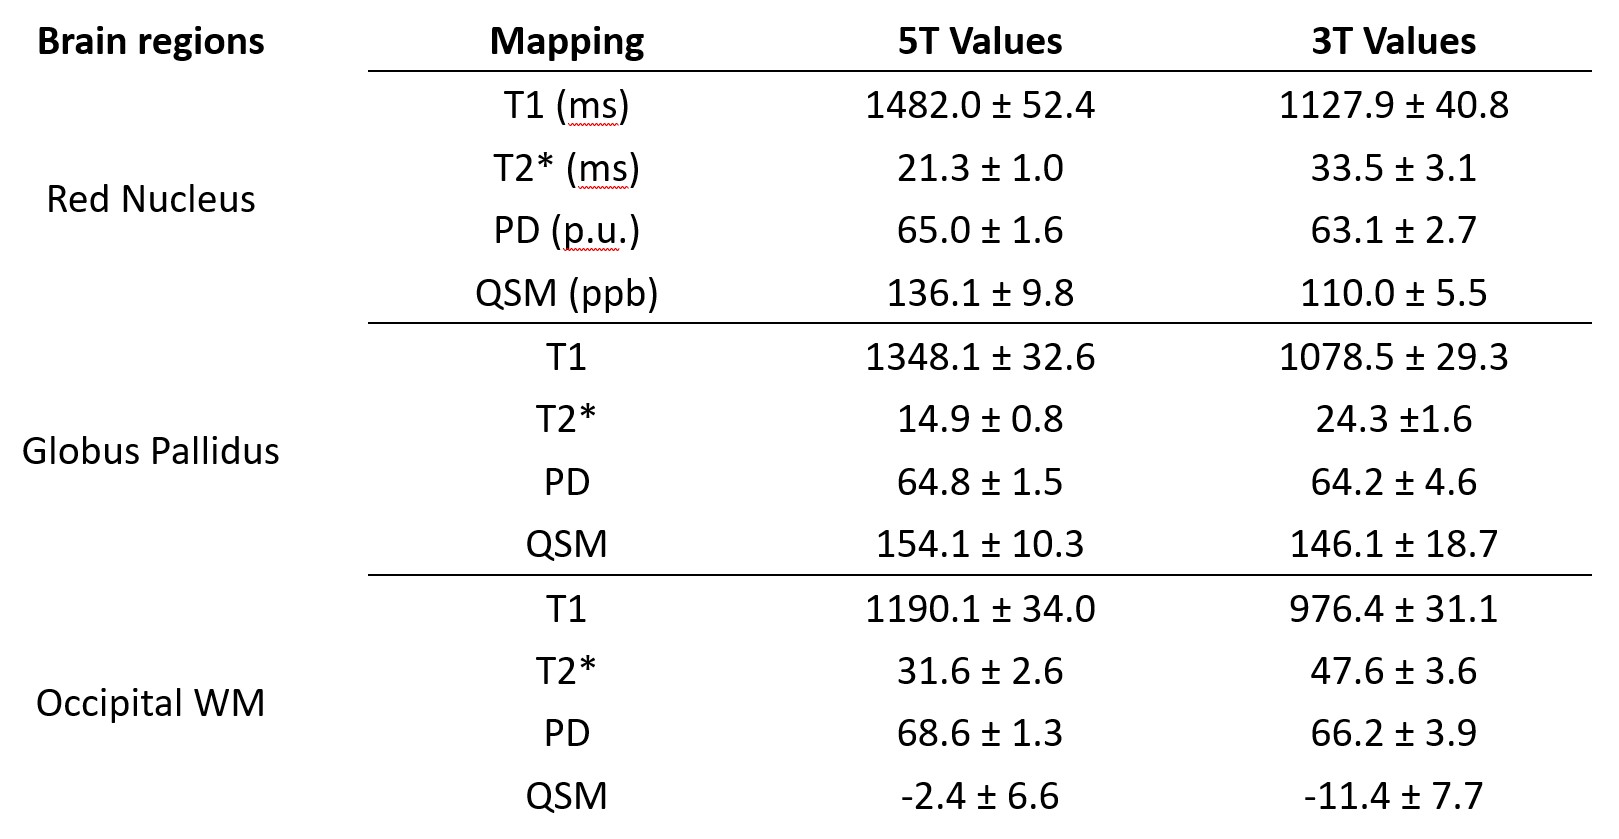
The MULTIPLEX B1+ and T1 maps are shown in Figure 1. Other typical MULTIPLEX images are compared in Figure 2, including augmented T1W (aT1W) images, PD/R2*/QSM maps and SWI mIP images. ROI values from typical tissues are shown and compared in Table 1. And the image magnitude, noise distribution and SNR maps of the same MULTIPLEX echo (i.e. FA1-TR1-Echo1) from both fields are compared in Figure 3.Discussion
In this work, we have presented the initial experience of MULTIPLEX scans on a state-of-the-art 5T whole body scanner, which were compared to 3T results.The 5T field strength has only recently become available for whole body imaging6, thus no literatures on the relaxometry properties (e.g. T1/T2*) or other quantitative quantities (e.g. PD/QSM) are readily available. However, referencing the 3T and 7T literatures7, one can safely assume that these MRI signal properties at 5T will likely fall between 3T and 7T. By using an identical scanning protocol, reliable and similar outcomes on both 5T and 3T should be expected.
The major high-field challenge in MULTIPLEX is expected to be T1 mapping with B1+ correction, like any other dual-FA methods5. With the dual-TR design and actual flip angle imaging (AFI) technique8, the B1 fields can be reliably extracted at both fields. As shown in Figure 1, the B1 field inhomogeneity at 5T is indeed more severe than at 3T due to stronger dielectric effects9. Nevertheless, the 5T T1 map became homogeneous (Fig.1) and yielded reasonable values (Table 1) after B1+ correction. However, some unevenness in 5T T1 maps can still be observed, most likely due to the higher order components in the B1+ fields not being taken account for, and it will be our future focus to further improve the B1+ correction effect.
Table 1 also indicates that T2* values at 5T were lower than at 3T, which was expected. Proton density (or relative PD to be accurate) and QSM values, on the other hand, remained relatively consistent between the two fields, as in principle both quantities are field independent. And with the same echo times, SWI at 5T showed stronger susceptibility weighted contrasts than its 3T counterpart (Fig.2). These observations suggest the 5T MULTIPLEX results were generally better than 3T's, while well within reasonable and expected range.
Generally, 5T results yielded better imaging quality and higher SNR than 3T (Figs.1~3). This is clearly shown in Figure 3 that 5T images had slightly higher signal intensity, lower noise level and subsequently higher SNR. For future works, the MULTIPLEX protocol can be and should be optimized specifically for 5T or even higher fields like 7T to achieve further optimized outcomes, such as higher resolution and/or shorter scanning time. Also, more stringent tests are needed to validate the accuracy of MULTIPLEX's quantitative maps at 5T.
Conclusion
In conclusion, we have for the first time demonstrated the feasibility of MULTIPLEX imaging on a 5T whole body scanner, suggesting a strong potential of MULTIPLEX as a high field multi-parametric imaging solution.Acknowledgements
No acknowledgement found.References
1. Warntjes JB, Leinhard OD, West J, Lundberg P. Rapid magnetic resonance quantification on the brain: Optimization for clinical usage. Magn Reson Med 2008;60(2):320-329.
2. Wang F, Dong Z, Reese TG, et al. Echo planar time-resolved imaging (EPTI). Magn Reson Med 2019;81(6):3599-3615.
3. Buonincontri G, Schulte RF, Cosottini M, Tosetti M. Spiral MR fingerprinting at 7T with simultaneous B1 estimation. Magn Reson Imaging 2017;41:1-6.
4. Ye Y, Lyu J, Hu Y, Zhang Z, Xu J, Zhang W. MULTI-parametric MR imaging with fLEXible design (MULTIPLEX). Magn Reson Med 2021.
5. Deoni SC. High-resolution T1 mapping of the brain at 3T with driven equilibrium single pulse observation of T1 with high-speed incorporation of RF field inhomogeneities (DESPOT1-HIFI). J Magn Reson Imaging 2007;26(4):1106-1111.
6. Zhenhua Shen, Xuchen Zhu, Shihong Han, et al. Initial Experience of Body Imaging at 5T. Joint Annual Meeting ISMRM-ESMRMB & SMRT 30th Annual Meeting; 2021. p. 3120.
7. Wright PJ, Mougin OE, Totman JJ, et al. Water proton T1 measurements in brain tissue at 7, 3, and 1.5 T using IR-EPI, IR-TSE, and MPRAGE: results and optimization. MAGMA 2008;21(1-2):121-130.
8. Yarnykh VL. Actual flip-angle imaging in the pulsed steady state: a method for rapid three-dimensional mapping of the transmitted radiofrequency field. Magn Reson Med 2007;57(1):192-200.
9. Lutti A, Stadler J, Josephs O, et al. Robust and fast whole brain mapping of the RF transmit field B1 at 7T. PLoS One 2012;7(3):e32379.
Figures