2854
Fat-water separated T1 mapping with multi-echo MP2RAGE1Medical Physics Unit, McGill University, Montreal, QC, Canada, 2Physics, NTNU, Trondheim, Norway, 3Medical Imaging, McGill University Health Centre, Montreal, QC, Canada, 4Athinoula A. Martinos Center for Biomedical Imaging, Havard Medical School, Boston, MA, United States, 5Research Institute of the McGill University Health Centre, Montreal, QC, Canada
Synopsis
To design a novel fat-water separated T1 mapping technique from a multi echo (ME) version of the Magnetization Prepared Two Rapid Acquisition of Gradient Echoes (MP2RAGE) sequence by adapting the MP2RAGE sequence to shorter T1 values resembling values observed for fat (between 200 and 800 ms) and introducing a 3-point Dixon fat-water separation step in the analysis.
Introduction
The measurement of fat-specific and water-specific T1 relaxation times is of interest for liver imaging1 , and characterization of hypoxia in diabetes2 and for radiotherapy applications3 . This can be achieved using spectroscopic relaxation measurement4, chemically selective T1 mapping5,6, and modified variable flip angle T1 mapping7. T1 mapping can be efficiently and accurately achieved using Magnetization Prepared Two Rapid Acquisition of Gradient Echoes (MP2RAGE), where the signals from a dual-acquisition inversion recovery pulse sequence are combined in such a way that the signal dependence of T1 on the combined signal is monotonic over a given range of T18. Fat-water separation is a well-established technique with a variety of applications9. In this study, we introduce a multi-echo MP2RAGE acquisition combined with fat-water separation for T1 mapping. The method generates volumetric T1 maps of both fat and water components.Methods
A “short T1” MP2RAGE protocol was designed for mapping a T1 range between 200 ms and 800 ms, by adjusting the inversion times TI1 and TI2, the flip angles α1 and α2, the repetition time TR, readout bandwidth, and the shot interval TRMP2PRAGE. A multi-echo version of this short T1 protocol was implemented using a custom ME-MP2RAGE sequence10. 3-point Dixon fat-water separation was applied independently to each of the two RAGE images11 (with an eight-resonance spectral model of fat measured using MR spectroscopy4) , and the resulting fat and water RAGE images were combined to produce fat-specific and water-specific MP2RAGE images. These images were used with the MP2RAGE lookup table adapted to the short T1 protocol to determine the fat T1 and water T1, respectively. MP2RAGE protocol parameters are reported in Table 1.The theoretical accuracy and precision of the short T1 MP2RAGE protocol was assessed using numerical simulations, along with a “long T1” single echo MP2RAGE protocol originally developed for mapping T1 values between 1000 ms and 2000 ms (typical of brain tissue at 3 T)8.
The single echo and multi-echo short T1 MP2RAGE protocols were then evaluated experimentally and compared against the long T1 single echo MP2RAGE protocol and a reference T1 mapping technique (inversion recovery spin echo)12 in homemade phantoms. Two phantoms were constructed: (I) 7 vials doped with gadobutrol, a gadolinium-based contrast agent (GBCA), diluted in distilled deionized water with [GBCA] ranging from 0.04 mM to 1.1 mM, which were immersed in a larger vessel filled with a water solution doped with GBCA and NaCl ([GBCA] = 0.1 mM, [NaCl] = 85 mM); (II) 20 vials of a commercial fat-water emulsion (Microlipid, Nestle, 50% fat weight/volume) diluted with various amounts of distilled deionized water to modulate the fat fraction between 0 and 50% (w/v) and doped with GBCA ([GBCA] between 0 and 1.04 mM in the total solution volume), all immersed in a vessel filled with the same GBCA+NaCl-doped water as phantom I. A field-of-view (FOV) of 200×204 mm2 was used for all acquisitions with slice coverage between 192 mm and 204 mm.
Results and Discussion
Simulations revealed that the short T1 MP2RAGE protocol achieved a greater signal dynamic range within the T1 range of interest (Figure 1a and 1b) and provided greater precision (lower variability) within the range of interest than the long T1 MP2RAGE acquisition (Figure 1d). Moreover, the short T1 MP2RAGE protocol provided increased accuracy over the conventional MP2RAGE acquisition (Figure 1c).Measurements obtained in phantom I showed excellent agreement between the MP2RAGE protocols and the reference (IR-SE technique) over a broad range of T1 values. This result is plotted in Figure 2 as R1 (=1/T1) vs [GBCA]. Precision and agreement increased with long T1 (small R1) values. The measured relaxivity for gadobutrol in water agrees with reports at the same temperature and field strength13.
Fat-water separated images and T1 maps were generated from fat-water separated MP2RAGE images in phantom II, as seen in Figure 3. We observed a range of T1 values in the fat and water components, which are reported in Table 2. The water T1 decreased with fat fraction and with [GBCA], in agreement with prior reports4,6,14. Two of the vials returned water T1 that did not fit the pattern, which we believe is due to errors in phantom construction. The fat T1 compared well with prior reports for the main fat resonance peak (methylene)4. Fat T1 increased slightly at low fat fractions, either agreeing with prior work4, or reflecting an estimation bias at low fat fraction.
Conclusion
The proposed method can easily and rapidly produce fat-water separated T1 maps from ME-MP2RAGE acquisitions. Simulations predict higher T1 accuracy and precision within the T1 range of interest for the short T1 protocol compared to the original MP2RAGE (optimized for brain T1). Phantom experiments showed that water T1 was accurate when compared to IR-SE. Water T1 and fat T1 were estimated separately and behaved largely as expected.Acknowledgements
No acknowledgement found.References
1. Thompson RB, Chow K, Mager D, Pagano JJ, Grenier J. Simultaneous proton density fat-fraction and R2∗ imaging with water-specific T1 mapping (PROFIT1): application in liver. Magn Reson Med. 2021;85(1):223-238. doi:10.1002/mrm.28434
2. Morozov D, Quirk JD, Beeman SC. Toward noninvasive quantification of adipose tissue oxygenation with MRI. Int J Obes. 2020;44(8):1776-1783. doi:10.1038/s41366-020-0567-x
3. Colliez F, Neveu MA, Magat J, Pham TTC, Gallez B, Jordan BF. Qualification of a noninvasive magnetic resonance imaging biomarker to assess tumor oxygenation. Clin Cancer Res. 2014;20(21):5403-5411. doi:10.1158/1078-0432.CCR-13-3434
4. Fortier V, Levesque IR. Longitudinal relaxation in fat-water mixtures and its dependence on fat content at 3 T. NMR Biomed. 2021;(August):1-13. doi:10.1002/nbm.4629
5. Jordan BF, Magat J, Colliez F, et al. Mapping of oxygen by imaging lipids relaxation enhancement: A potential sensitive endogenous MRI contrast to map variations in tissue oxygenation. Magn Reson Med. 2013;70(3):732-744. doi:10.1002/mrm.24511
6. Hu HH, Nayak KS. Change in the proton T1 of fat and water in mixture. Magn Reson Med. 2010;63(2):494-501. doi:10.1002/mrm.22205
7. Le Ster C, Gambarota G, Lasbleiz J, Guillin R, Decaux O, Saint-Jalmes H. Breath-hold MR measurements of fat fraction, T1, and T2* of water and fat in vertebral bone marrow. J Magn Reson Imaging. 2016;44(3):549-555. doi:10.1002/jmri.25205
8. Marques JP, Kober T, Krueger G, van der Zwaag W, Van de Moortele PF, Gruetter R. MP2RAGE, a self bias-field corrected sequence for improved segmentation and T1-mapping at high field. Neuroimage. 2010;49(2):1271-1281. doi:10.1016/j.neuroimage.2009.10.002
9. van Vucht N, Santiago R, Lottmann B, et al. The Dixon technique for MRI of the bone marrow. Skeletal Radiol. 2019;48(12):1861-1874. doi:10.1007/s00256-019-03271-4
10. van der Kouwe AJW, Benner T, Salat DH, Fischl B. Brain morphometry with multiecho MPRAGE. Neuroimage. 2008;40(2):559-569. doi:10.1016/j.neuroimage.2007.12.025
11. Berglund J, Johansson L, Ahlström H, Kullberg J. Three-point Dixon method enables whole-body water and fat imaging of obese subjects. Magn Reson Med. 2010;63(6):1659-1668. doi:10.1002/mrm.22385
12. Stikov N, Boudreau M, Levesque IR, Tardif CL, Barral JK, Pike GB. On the accuracy of T1 mapping: Searching for common ground. Magn Reson Med. 2015;73(2):514-522. doi:10.1002/mrm.25135
13. Stalder AF, Elverfeldt D V., Paul D, Hennig J, Markl M. Variable echo time imaging: Signal characteristics of 1-M gadobutrol contrast agent at 1.5 and 3T. Magn Reson Med. 2008;59(1):113-123. doi:10.1002/mrm.21345
14. Le Ster C, Gambarota G, Lasbleiz J, Guillin R, Decaux O, Saint‐Jalmes H. Breath-hold MR measurements of fat fraction, T1, and T2* of water and fat in vertebral bone marrow. Magn Reson Med. 2016;79(1):1-12. doi:10.1002/jmri.25205
15. Jaubert O, Cruz G, Bustin A, et al. Water–fat Dixon cardiac magnetic resonance fingerprinting. Magn Reson Med. 2020;83(6):2107-2123. doi:10.1002/mrm.28070
Figures
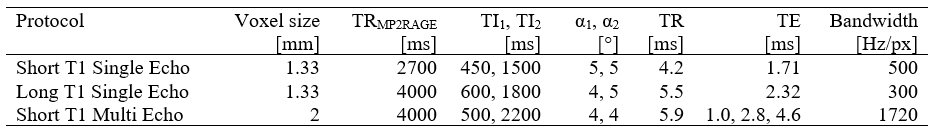
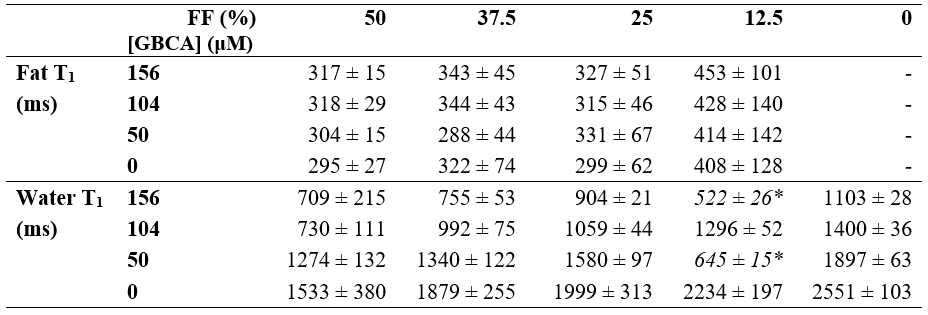
Table 2: Fat and water T1 values measured in phantom II from the short T1 multi echo protocol. The water T1 marked with an asterisk for two of the water vials that stand out from the pattern. These are believed to be vials where GBCA dilution errors likely happened.
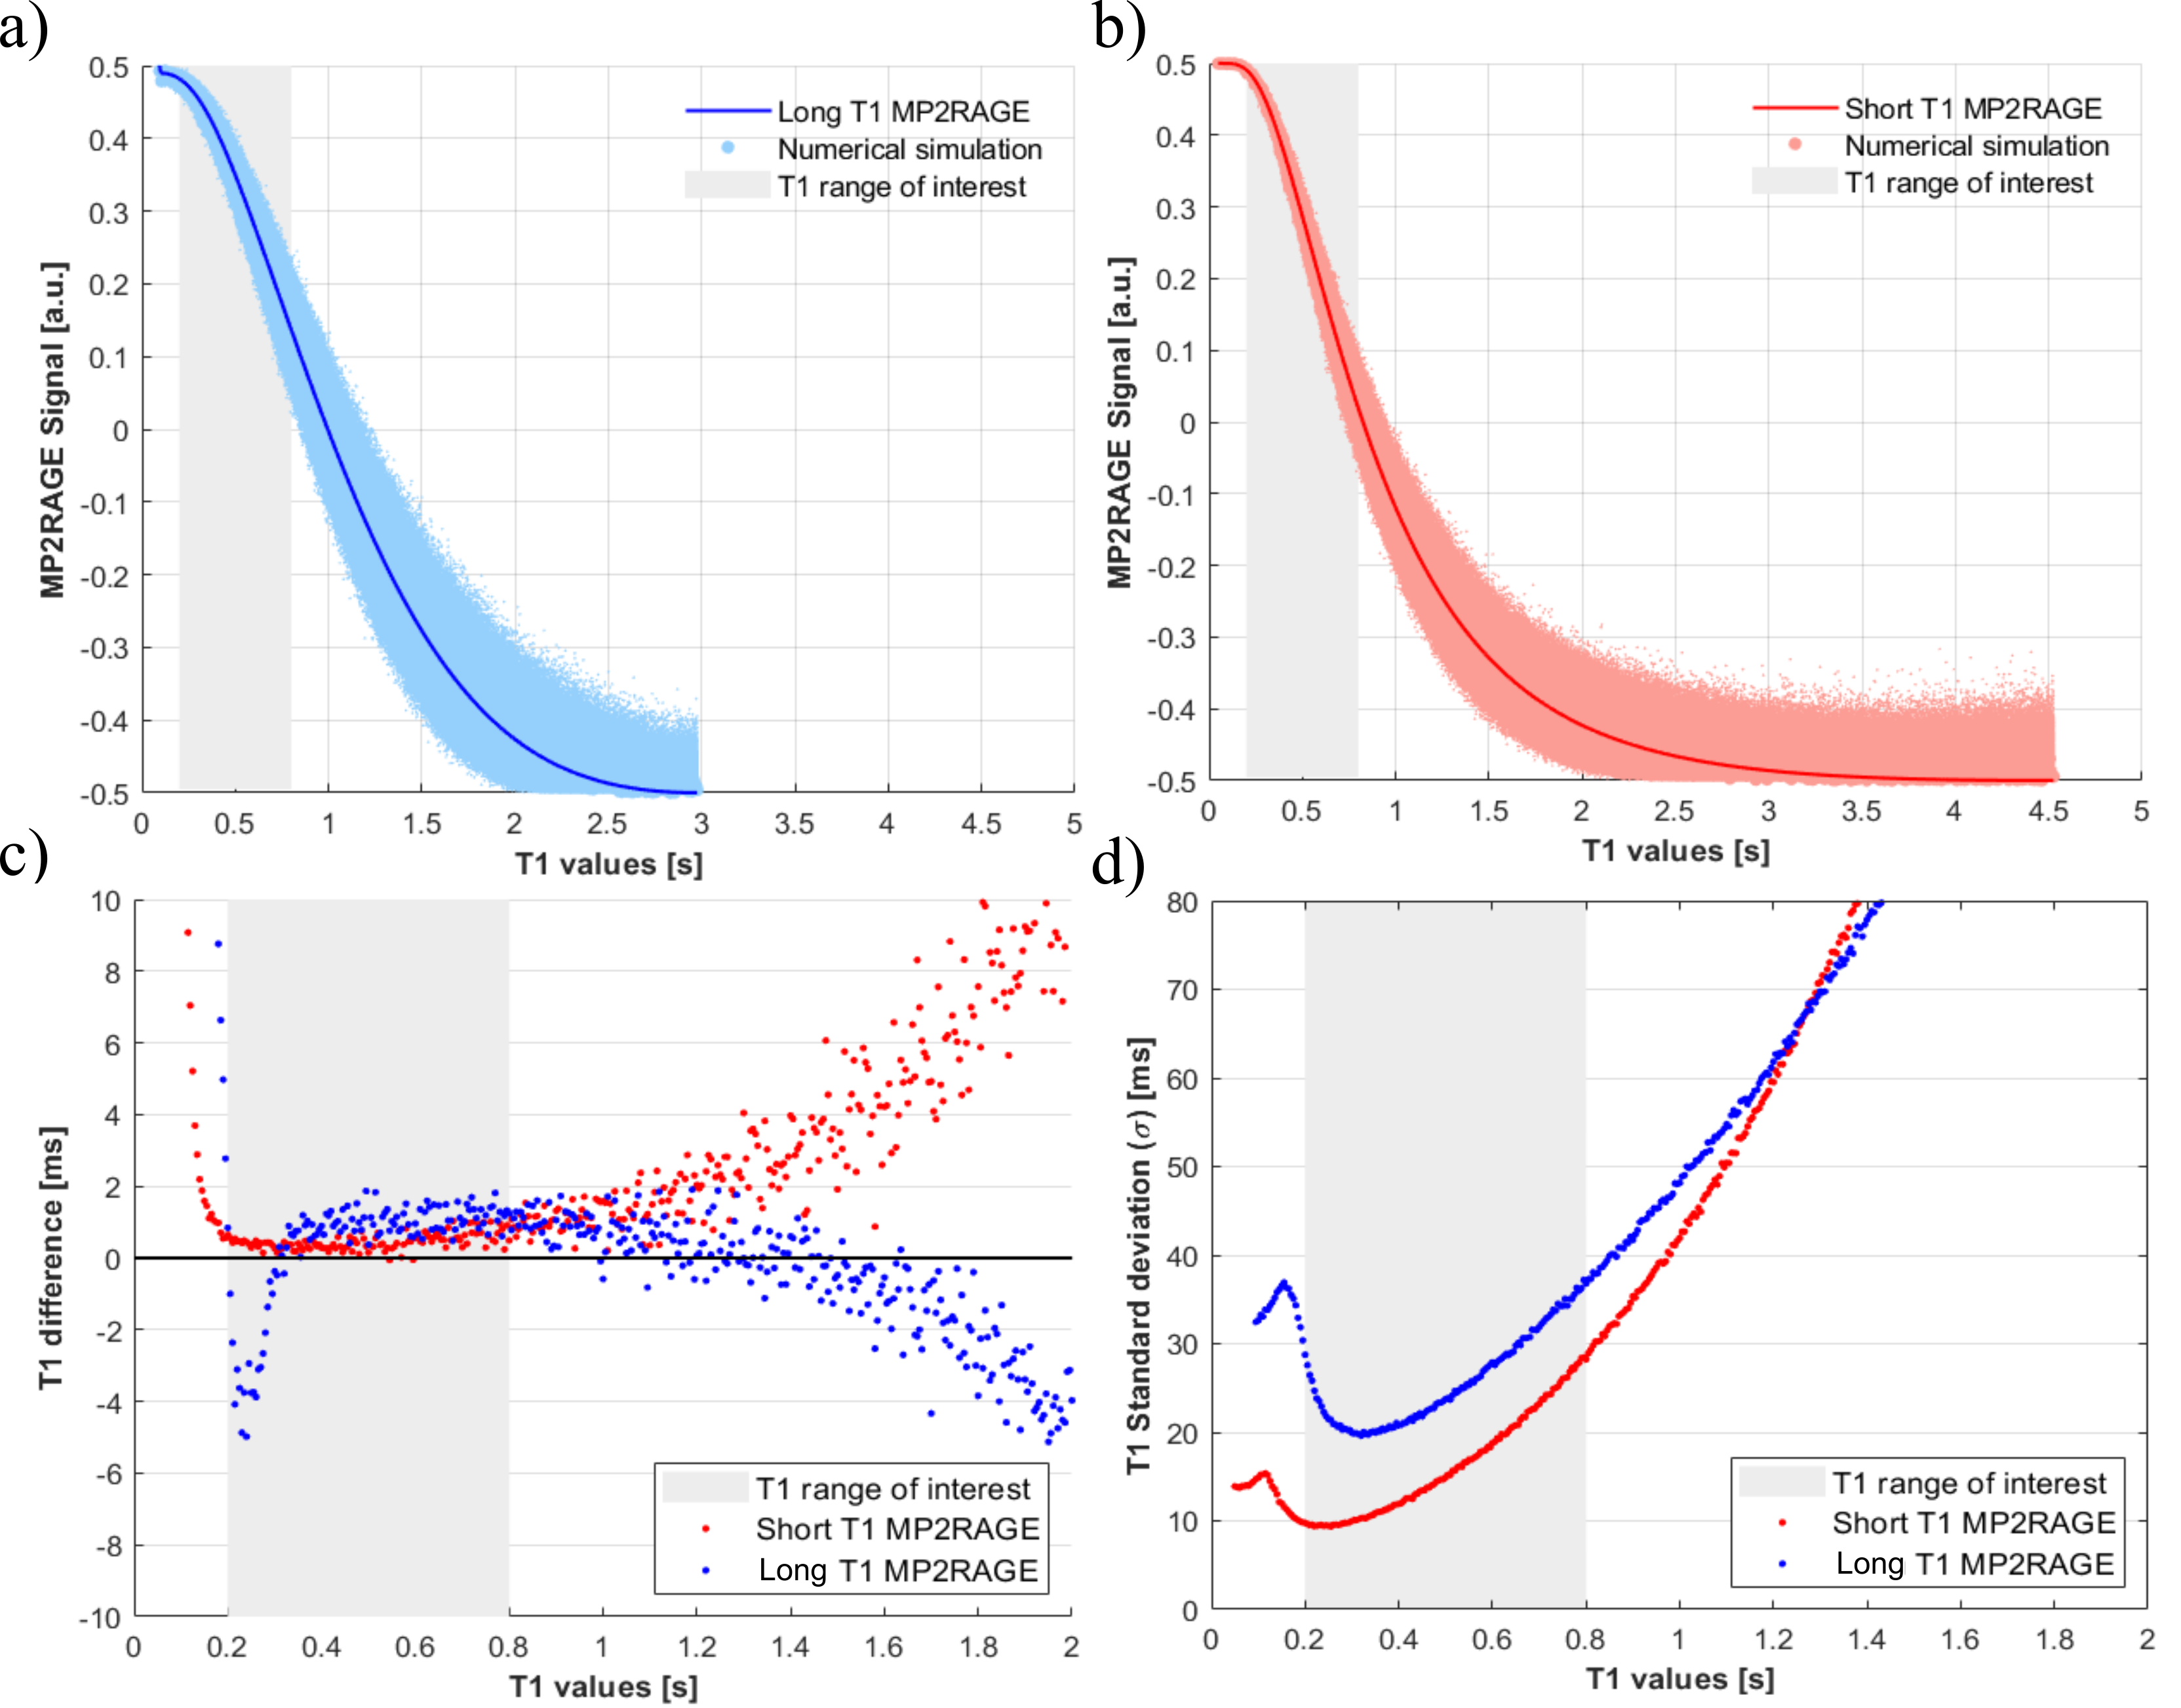
Figure 1. Results of numerical simulations for the short T1 single echo protocol (a) and the long T1 single echo protocol (b). The noiseless MP2RAGE-T1 relationship is shown with the thick red and blue lines. The dots in (a) and (b) represent 10,000 noisy realizations. Accuracy and precision of T1 estimates from simulations for the short T1 and long T1 protocols are shown in panels (c) and (d). Accuracy was calculated as the difference between the mean of the 10,000 realizations and the noiseless MP2RAGE lookup table. Precision was taken as the standard deviation of the 10,000 realizations.
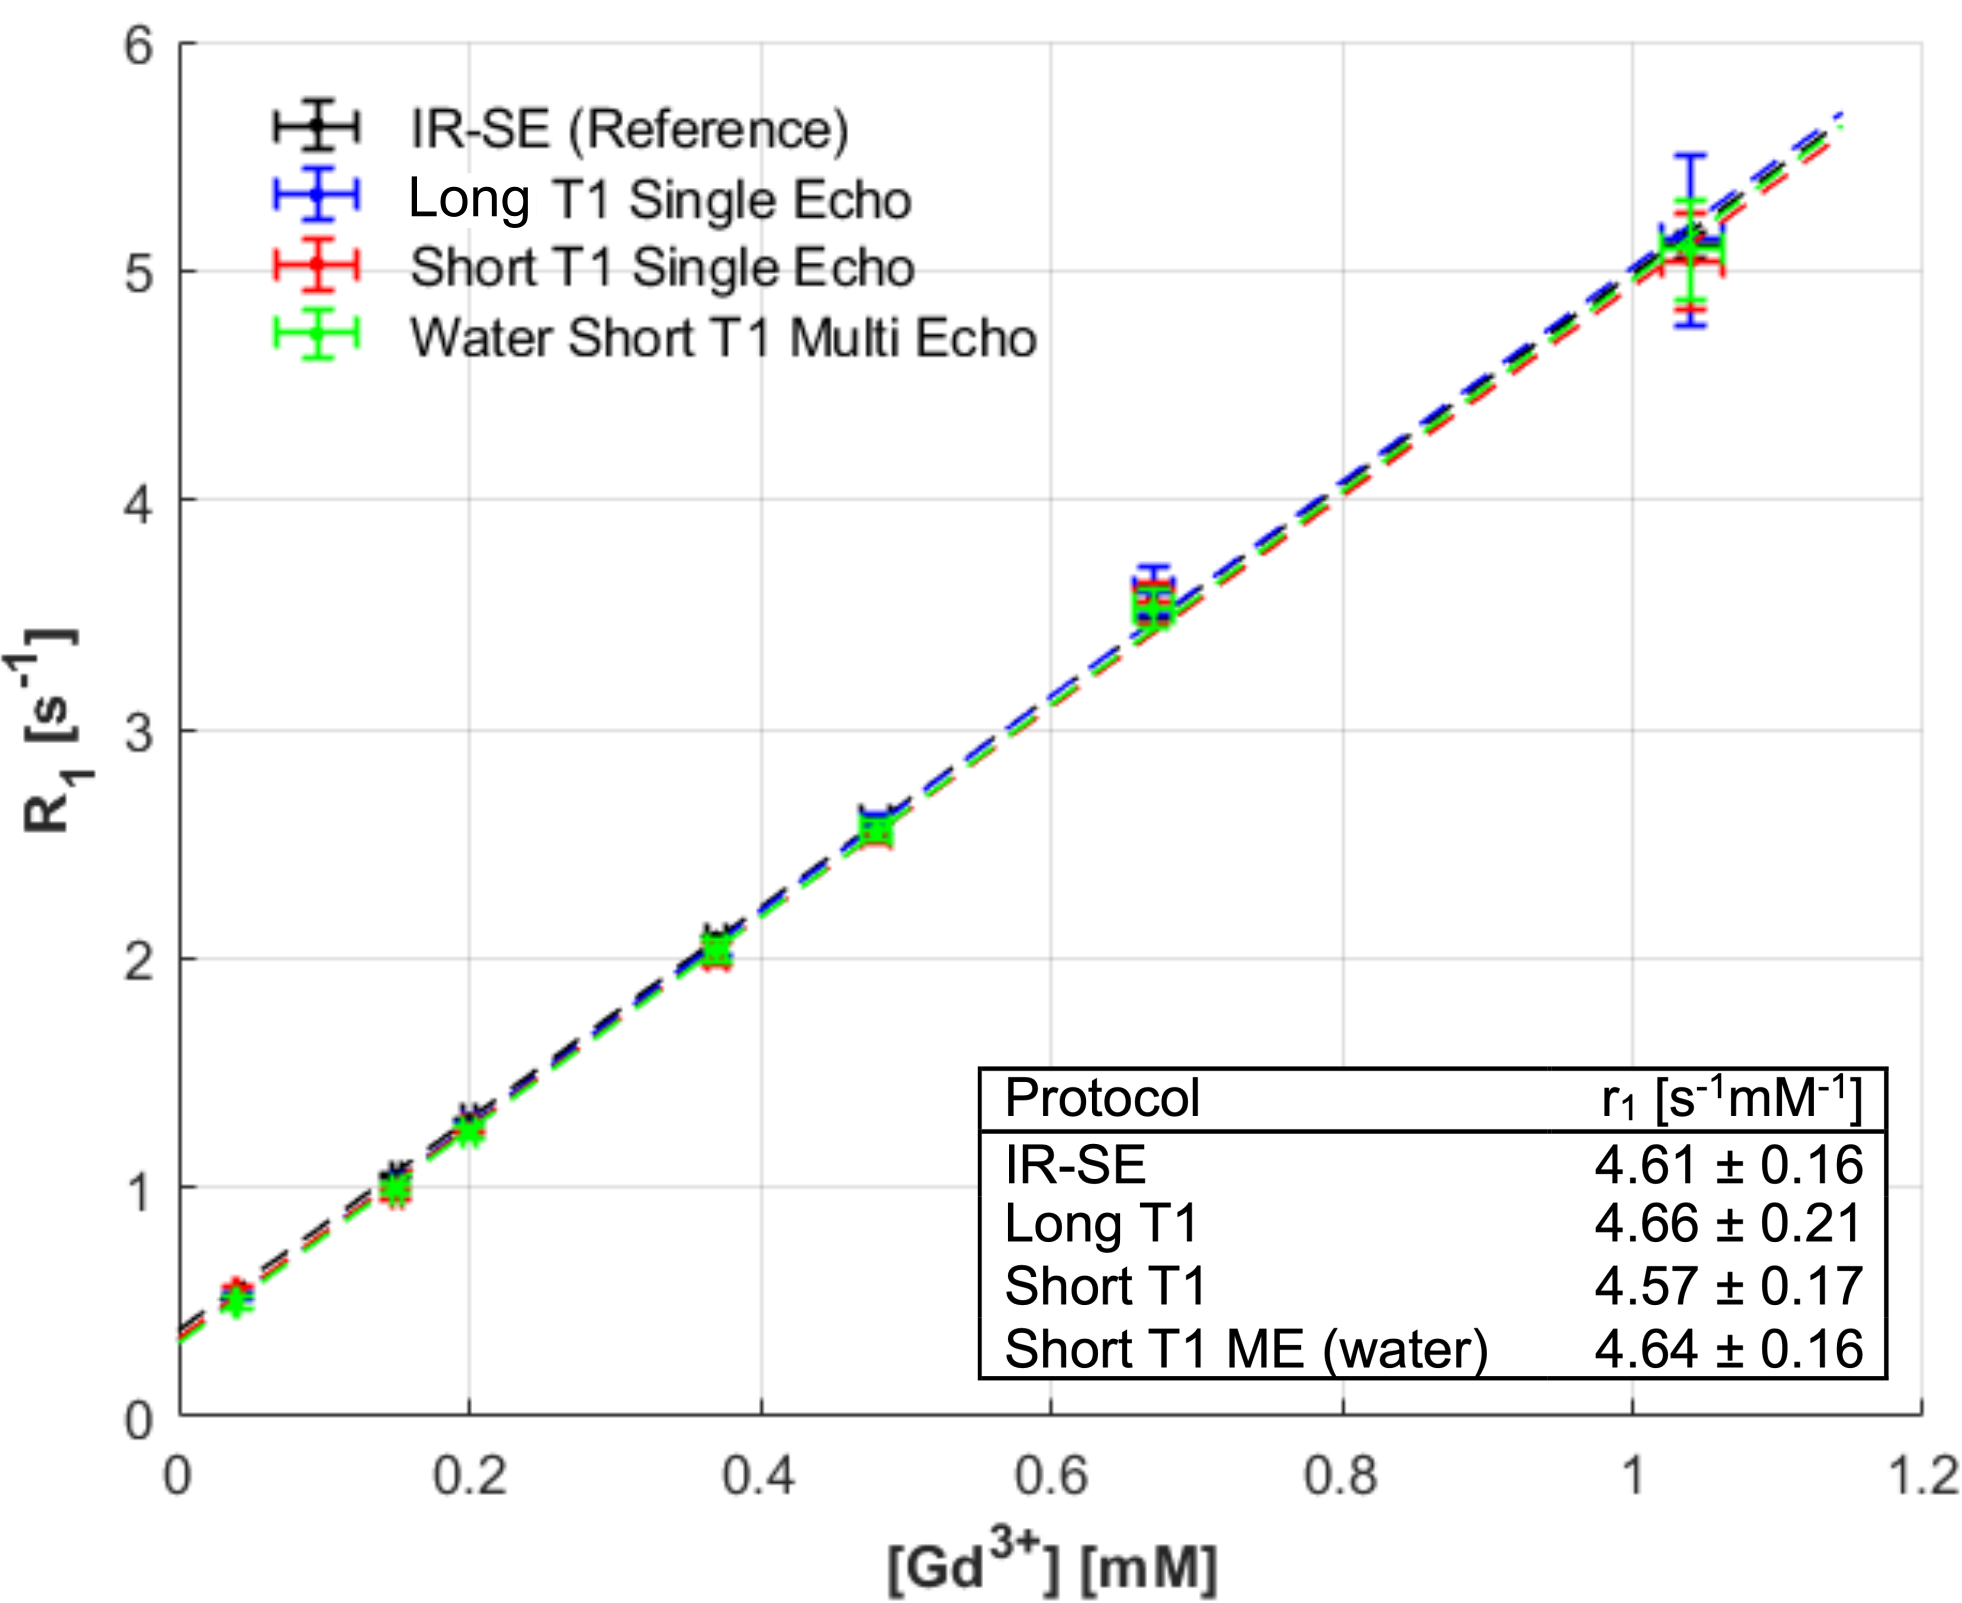
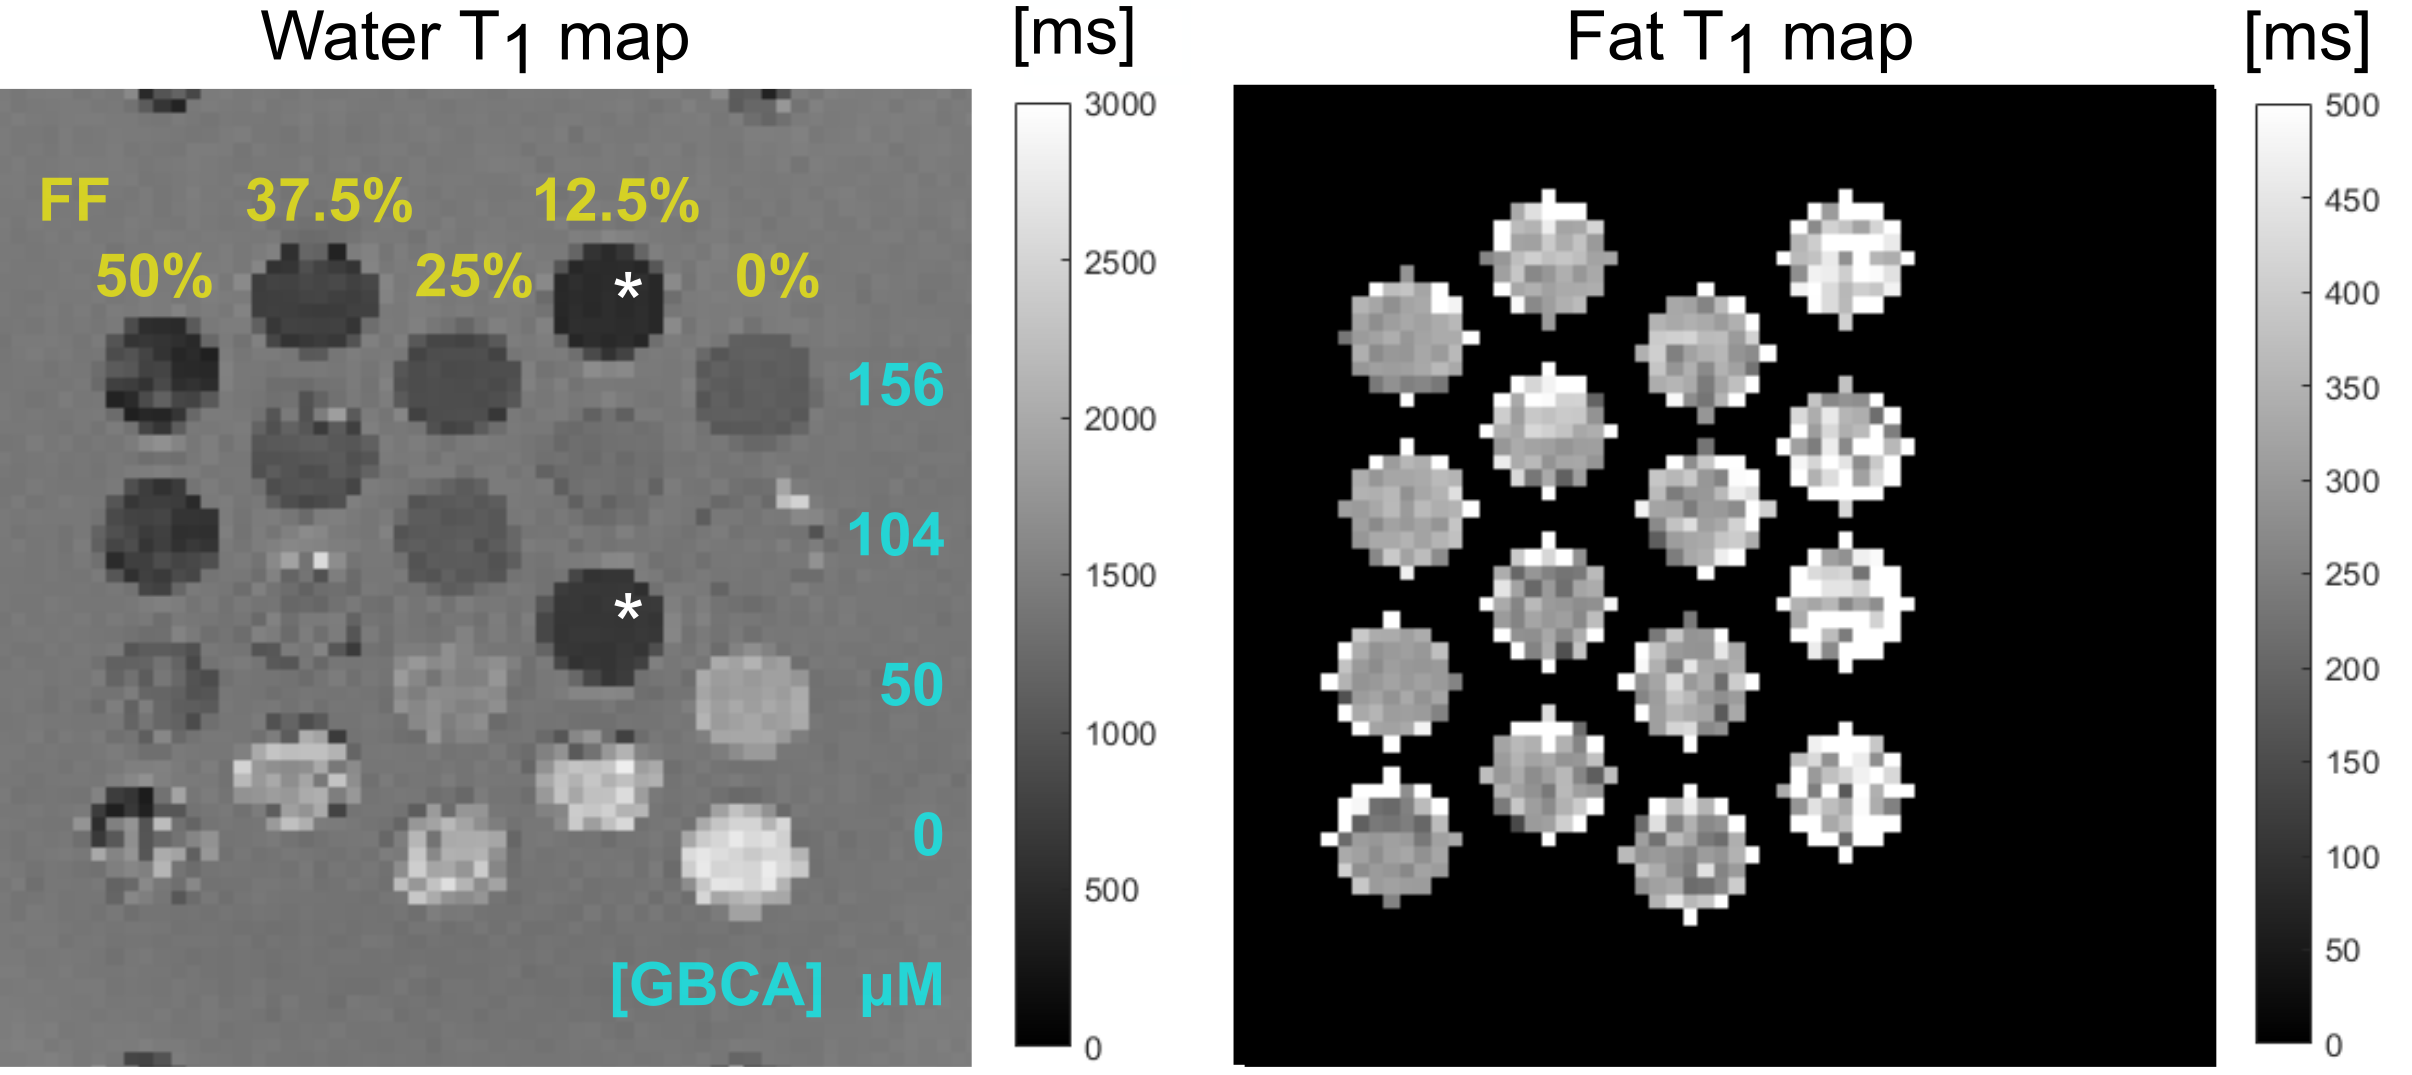
Figure 3. Water T1 and fat T1 maps calculated from the short T1 ME protocol (left and right respectively) in phantom II. The T1 maps are zoomed in to show relevant portions of the phantom and displayed on different scales. Only the vials known to contain fat are expected to produce a reasonable fat T1 and shown in the map. Fat fractions (w/v) are indicated at the top the columns in the water T1 map. [GBCA], shown along the right side of the water T1 map, is relative to the total vial volume. Vials marked with a * stand out from the pattern of expected T1 variation as discussed in the text.