2853
Application of a two-pool model of water exchange to myelin water fraction in multiple sclerosis spinal cord1Physics and Astronomy, University of British Columbia, Vancouver, BC, Canada, 2Radiology, University of British Columbia, Vancouver, BC, Canada, 3International Collaboration on Repair Discoveries, Vancouver, BC, Canada, 4Medicine, University of British Columbia, Vancouver, BC, Canada
Synopsis
Myelin water fraction (MWF) quantifies myelin content in the central nervous system. MWF analysis typically assumes there is no water exchange between different water pools in tissue during the measurement. Here we investigate the effect of incorporating a two-pool model of exchange in a study of MWF in multiple sclerosis (MS) spinal cord and compare with results from the original algorithm. Including exchange resulted in higher MWF values and myelin water residence times that were correlated with MWF, but maintained the expected relationship in MWF between MS subtypes and controls.
Introduction
Myelin water imaging (MWI) has been extensively applied to study myelin in diseases such as multiple sclerosis (MS)1–3. MWI decomposes a multi-echo T2 relaxation decay curve into short- and long-T2 components corresponding to myelin-associated (T2<40ms) and intra/extra-cellular (T2~40-200ms) water pools. Myelin water fraction (MWF) is calculated as the fraction of the signal from the myelin water pool to the total signal. Current multi-echo relaxation-based techniques to estimate MWF assume that there is no exchange between the water pools in tissue on the decay curve measurement timescale4. However, neglecting water exchange likely leads to an underestimate of the observed MWF4–8.The T2 relaxation decay curve is not purely exponential due to the presence of stimulated echoes, which arise because of imperfect refocusing pulses9. The extended phase graph (EPG) algorithm is used in the calculation of MWF to correct for these stimulated echoes9,10. Commonly, a multicomponent EPG algorithm is used to correct T2 decay curves, fit for the optimal refocusing flip angle and generate the T2 distribution, from which the MWF is calculated9. An extension to the original EPG algorithm, the recently proposed EPGX7, incorporates a two-pool model of water exchange. Here, the original MWF algorithm was modified to include EPGX and calculate both a corrected MWF and the myelin water residence time (MWRT) in a study of spinal cord in healthy controls and MS patients.
Methods
Data acquisition: MWI data from spinal cord at the C2/C3 level was collected on 17 healthy controls (HC, median age 41y (22-60y)), 14 Relapsing-Remitting MS patients (RRMS, median age 48y (26-61y)) and 14 Progressive MS patients (ProgMS, median age 57y (53-65y)) using 3D GRASE11 (32 echoes, TE/TR=10/1500ms, SENSE factor=2, 8 slices acquired at 0.75x0.75x5mm3 reconstructed to 16 slices at 0.63x0.63x2.5mm3, acquisition time=8.5min) on a Philips Achieva 3T scanner.Algorithm: The Original alGorithm (OG) was modified to include EPGX (EPGX-MWF). EPGX-MWF was used to generate corrected decay curves and fit for both the optimal flip angle and the water exchange rate in each voxel. MWF was calculated using regularized non-negative least squares (NNLS) fitting. Maps of MWF, MWRT, fit-to-noise ratio (FNR) and intra/extra-cellular water T2 (IET2) time were generated, along with equivalent maps from the OG for comparison.
MWRT was defined as7 $$$MWRT = \frac{MWF}{1-MWF}\times \frac{1}{Exchange\ rate\ from\ IEW\ to\ MW}$$$.
FNR was defined as $$$FNR = \frac{\Sigma T_2\ distribution}{\sqrt{var(residuals)}}$$$.
IET2 time was defined as the geometric mean of T2 times between 40 and 200ms.
Analysis: Segmentation of images and registration of the PAM50 template to the generated quantitative maps was done with Spinal Cord Toolbox12. Metrics were extracted from white matter, including lesions, which was the selected region of interest (ROI). Metrics derived from the two algorithms were compared using a paired t-test, correlations between MWF and MWRT were assessed using Pearson correlation, and MWFs between groups of the cohort were compared using one-way ANOVA with Tukey correction.
Results
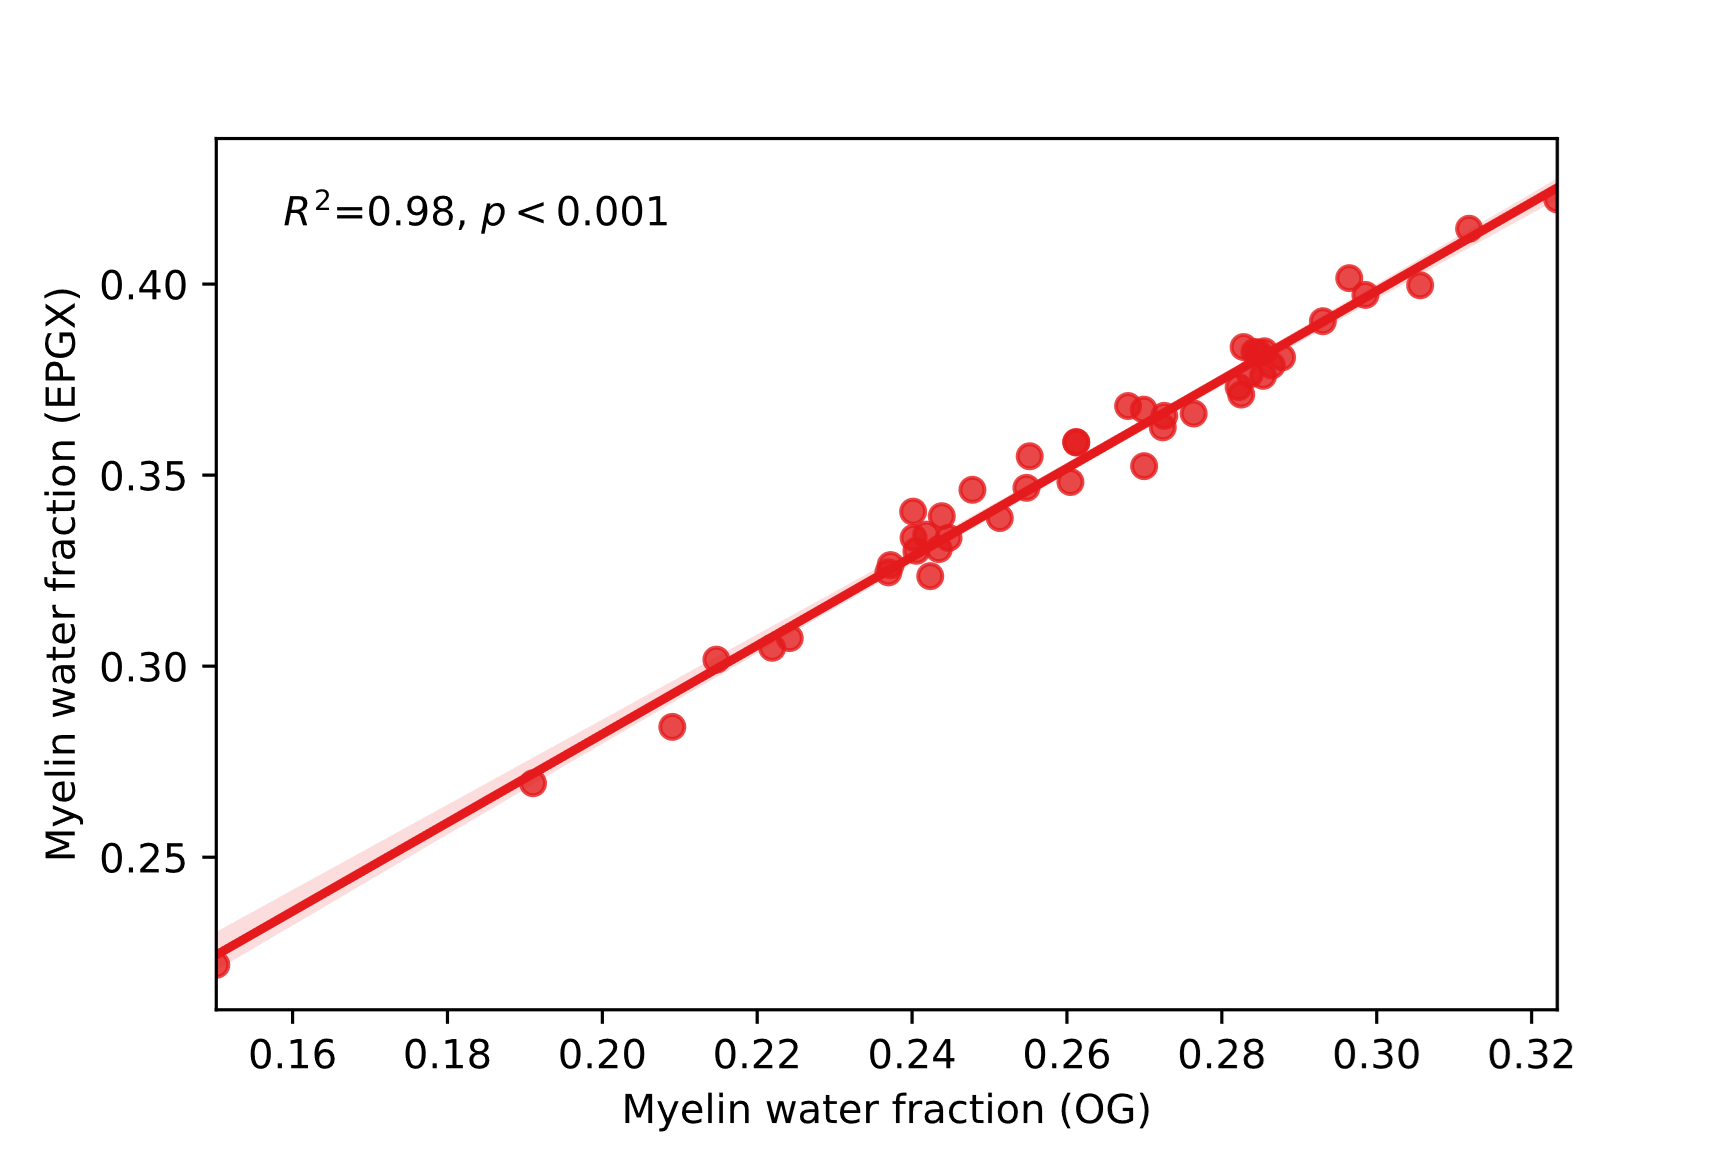
Metrics from the two algorithms were compared in spinal cord white matter across all subjects. EPGX-MWF resulted on average in MWFs that were higher (35%, p<0.001), IET2 times that were lower (2%, p<0.001) and FNRs that were higher (3%, p<0.001) than values derived from the OG (Fig 1). MWFs from the two methods were strongly correlated (R2=0.98, p<0.001, Fig 2).Using EPGX-MWF, MWRTs in white matter were correlated with MWFs (r=0.62, p<0.001). This relationship was stronger in ProgMS patients (r=0.83, p<0.001) than RRMS (r=0.55, p=0.04) or HC (r=0.41, p=0.10) (Fig 3).
MWFs from the two algorithms were compared within each group of the cohort (Fig 4). ANOVA with Tukey correction only showed a significant difference between HC and ProgMS (p=0.01 in the OG, p=0.02 in EPGX-MWF).
Discussion
A non-zero rate of inter-compartmental water exchange was expected to lead to a decrease in extracted T2 times and MWF values if not corrected4,6,8. This was shown to be the case with MWF, but the T2 behaviour was unexpected. The slightly increased FNR from EPGX-MWF was an indication of a better fit for the T2 decay curve than the OG.MWF was positively correlated with the calculated MWRT, indicating that more myelin content is related to longer residence times and therefore slower water exchange. The relationship appeared strongest in ProgMS possibly due to the higher spread in MWF and MWRT values because of different levels of de/remyelination.
Both algorithms resulted in MWF values that showed similar relationships between groups of the study cohort, so EPGX-MWF did not significantly alter overall conclusions derived from MWF even though exchange was included. This may be due to relatively long MWRTs, which support the assumption in the OG of little water exchange during the T2 measurement. As spinal cord was expected to have thicker myelin than the brain, little water exchange is unsurprising. Moving to an exchange model with more pools may better model the complexity of the system and result in better fits for the data, particularly in brain where exchange is expected to play a bigger role.
Conclusion
Including a two-pool model of exchange improved fits of the T2 decay and maintained expected relationships between MWF in HC, RRMS and ProgMS spinal cord.Acknowledgements
We thank all participants, researchers and MR technologists at the UBC MRI Research Centre. This research was funded by the MS Society of Canada (SK, Grant 3031), Michael Smith Health Care BC (SK), NSERC (SB, AD, SK Grant RGPIN-2018-03904).References
1. MacKay A, Whittall K, Adler J, Li D, Paty D, Graeb D. In vivo visualization of myelin water in brain by magnetic resonance. Magnetic resonance in medicine. 1994;31(6):673-677. http://doi.wiley.com/10.1002/mrm.1910310614
2. MacKay A, Laule C, Vavasour I, Bjarnason T, Kolind S, Mädler B. Insights into brain microstructure from the T2 distribution. Magnetic resonance imaging. 2006;24(4):515-525. http://linkinghub.elsevier.com/retrieve/pii/S0730725X06000518
3. Laule C, Kozlowski P, Leung E, Li DKB, Mackay AL, Moore GRW. Myelin water imaging of multiple sclerosis at 7 T: correlations with histopathology. NeuroImage. 2008;40(4):1575-1580. http://eutils.ncbi.nlm.nih.gov/entrez/eutils/elink.fcgi?dbfrom=pubmed&id=18321730&retmode=ref&cmd=prlinks
4. Alonso-Ortiz E, Levesque IR, Pike GB. MRI-based myelin water imaging: A technical review. Magnetic Resonance in Medicine. 2015;73(1). doi:10.1002/mrm.25198
5. Harkins KD, Dula AN, Does MD. Effect of intercompartmental water exchange on the apparent myelin water fraction in multiexponential T 2 measurements of rat spinal cord. Magnetic Resonance in Medicine. 2012;67(3):793-800. doi:10.1002/mrm.23053
6. Dula AN, Gochberg DF, Valentine HL, Valentine WM, Does MD. Multiexponential T2, magnetization transfer, and Quantitative histology in white matter tracts of rat spinal cord. Magnetic Resonance in Medicine. 2010;63(4):902-909. doi:10.1002/mrm.22267
7. Malik SJ, Teixeira RPAG, Hajnal J v. Extended phase graph formalism for systems with magnetization transfer and exchange. Magnetic Resonance in Medicine. 2018;80(2). doi:10.1002/mrm.27040
8. Levesque IR, Pike GB. Characterizing healthy and diseased white matter using quantitative magnetization transfer and multicomponent T 2 relaxometry: A unified view via a four-pool model. Magnetic Resonance in Medicine. 2009;62(6). doi:10.1002/mrm.22131
9. Prasloski T, Mädler B, Xiang QS, MacKay A, Jones C. Applications of stimulated echo correction to multicomponent T2 analysis. Magnetic resonance in medicine. 2011;67(6):1803-1814. http://doi.wiley.com/10.1002/mrm.23157
10. Weigel M. Extended phase graphs: Dephasing, RF pulses, and echoes - pure and simple. Journal of Magnetic Resonance Imaging. 2015;41(2). doi:10.1002/jmri.24619
11. Ljungberg E, Vavasour I, Tam R, et al. Rapid myelin water imaging in human cervical spinal cord. Magnetic Resonance in Medicine. 2017;78(4). doi:10.1002/mrm.26551
12. de Leener B, Lévy S, Dupont SM, et al. SCT: Spinal Cord Toolbox, an open-source software for processing spinal cord MRI data. NeuroImage. 2017;145. doi:10.1016/j.neuroimage.2016.10.009
Figures