2852
MP2UTE: T1 mapping of short-T2 components1Siemens Healthcare AG, Zurich, Switzerland, 2Swiss Center for Musculoskeletal Imaging (SCMI), Balgrist Campus, Zurich, Switzerland, 3Advanced Clinical Imaging Technology (ACIT), Siemens Healthcare AG, Lausanne, Switzerland, 4Department of Radiology, Lausanne University Hospital (CHUV), Lausanne, Switzerland, 5LTS5, École Polytechnique Fédérale de Lausanne, Lausanne, Switzerland, 6University of Zurich, Zurich, Switzerland
Synopsis
T1 mapping of species with very fast T2/T2* relaxation is impossible with conventional methods measuring echoes refocused by gradients or radiofrequency pulses. We therefore present a new approach to estimate T1 relaxation times of short-T2 tissue such as bone, tendon, or ligament by sampling transversal magnetization at different inversion times with a short-T2 sensitive ultra-short-TE readout. The presented T1 mapping method is efficient and B1-insensitive. By acquiring multiple echoes, it is possible to obtain T1 relaxation times at short and long echo-time and therefore assess the influence of short-T2 components.
Introduction
Transverse water-proton magnetization in densely packed tissues, such as ligament, tendon, and cortical bone, exhibits fast T2* decay due to slow molecular re-orientation and long correlation times. Sequences with center-out sampling trajectories and ultra-short echo times (UTE) can still detect a signal from rapidly decaying T2* in such tissue. A quantitative T1 estimation of short- and long-T2 tissue might allow for a better assessment of tissue structure, composition or changes within pathology or during healing processes [1]. The aim of this study was to explore the potential of a magnetization-prepared 3D radial UTE prototype sequence at two inversion times with a dual echo readout (MP2UTE) to map T1 relaxation times of short-T2 components in a clinically feasible scan time; proof-of-concept is shown on a knee and an ankle acquisition.Materials and Methods
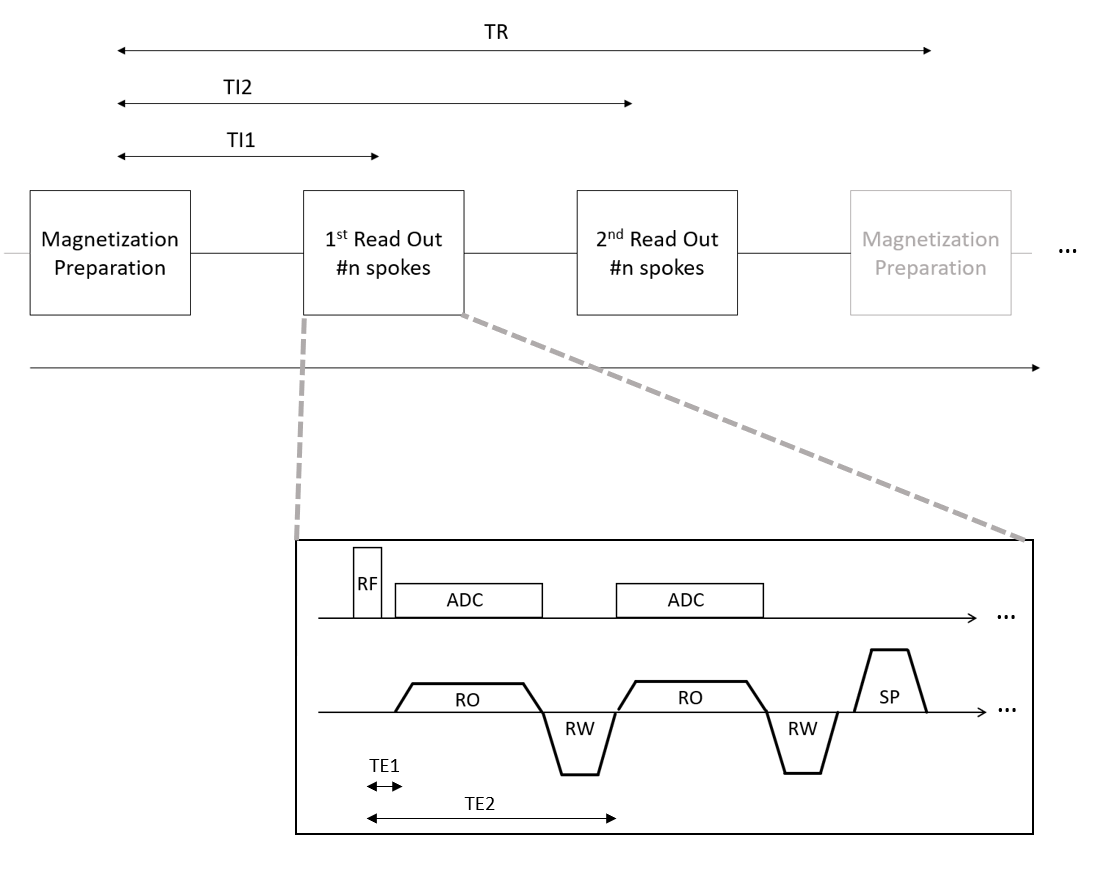
Experiments were performed on a 3T whole-body MR scanner (MAGNETOM Prisma, Siemens Healthcare, Erlangen, Germany) equipped with a 1Tx/15Rx-channel knee coil (QED, Quality Electrodynamics, Mayfield Village, OH, USA) and a 16Rx-channel foot/ankle coil (Siemens Healthcare, Erlangen, Germany). Magnetization-prepared 3D isotropic UTE imaging was performed with a prototype sequence that acquired data in two distinct readout blocks at different inversion times similar to an MP2RAGE acquisition [2]. Each readout block consisted of several shots, each with a short non-selective excitation pulse followed by two consecutive rewound center-out readouts and by a spoiler gradient (Figure 1). MP2UTE data was acquired in the knee and ankle of a healthy volunteer using an adiabatic inversion pulse and sampling at two different inversion and echo times (TI1: 700ms, TI2: 2500ms, TE1: 40µs, TE2: 2.46ms) with flip angles of 4° (TI1) and 5° (TI2), TR: 5s, inter-spoke TR: 5.8ms, 20’020 spokes (220 per readout block) in TA: 7min 31s for each scan. RF-pulse duration: 40µs, dead time between RF and ADC: 10µs, resolution 1mm isotropic for both scans. Prior to data gridding, the k-space trajectory was corrected for gradient imperfections using a gradient impulse response model [3]. Resulting complex image data was combined to a unified image and T1 maps were calculated for each echo time using numerical simulations based on sequence parameters as described in Marques et al. [2]Results
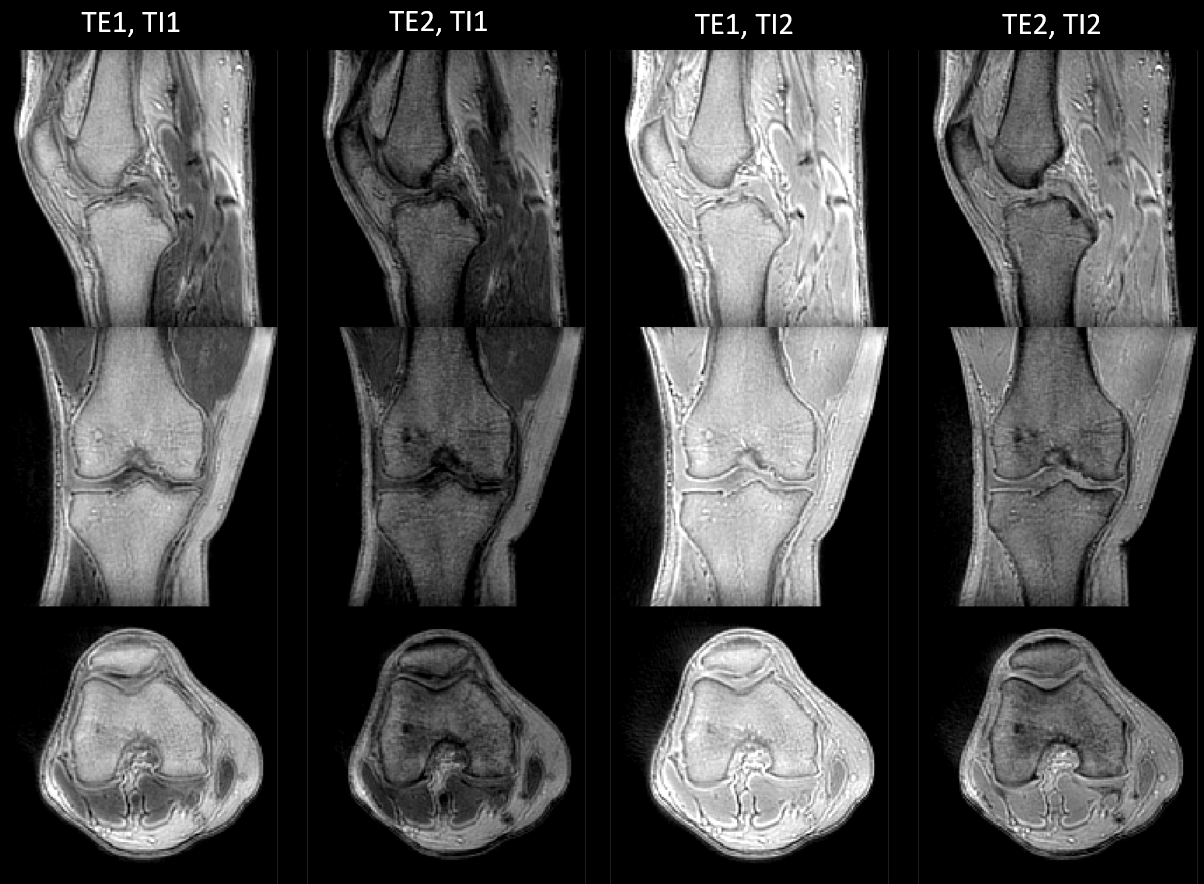
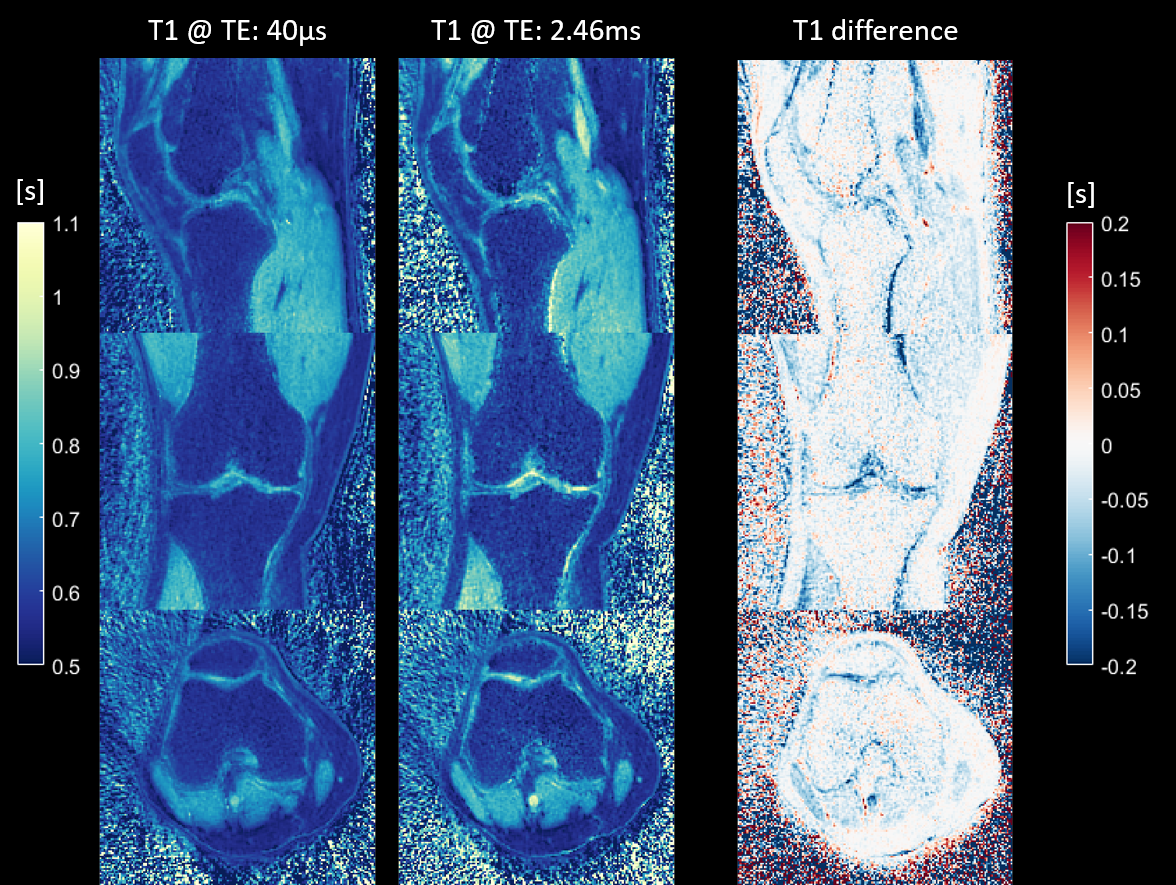
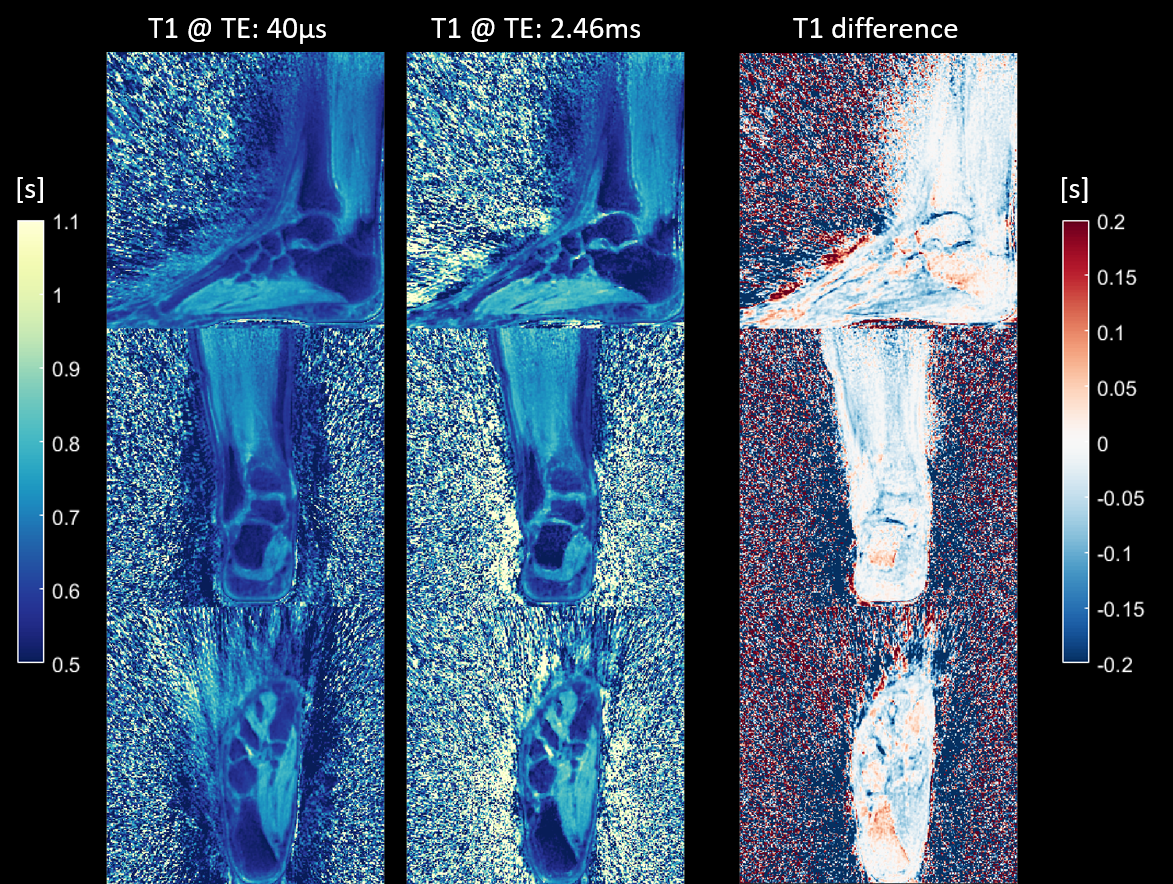
Figure 2 shows magnitude images of the knee for all four contrasts (two inversion times at two echo times) in the three orthogonal orientations. Figure 3 depicts the two T1 maps obtained from the two inversion contrasts at short (TE1) and long (TE2) echo times and the difference (T1 at TE1 – T1 at TE2) between the T1 maps for the knee scan. Figure 4 shows the T1 relaxation times from the ankle scan measured at TE1: 40µs and at TE2: 2.4ms respectively. The right column visualizes the difference in T1 between the short (TE1) and long (TE2) echo times. Most of the T1 differences show a lower value in TE1 compared to the estimated value at TE2. Additionally, a lower T1 relaxation time can be found in tissue such as cortical bone, tendons, ligaments, where short-T2 signal contribution is expected. Especially in the knee (Fig 3), the interior of the tibia and femur also show a slight decrease of T1. In contrast, in e.g., the calcaneus (Fig 4), the T1 estimation at TE1 (40µs) seems to be even slightly increased.Discussion
A shorter T1 relaxation time obtained from the short echo time in the interior of the tibia and femur might be caused by the contribution of trabecular bone. It is important to note that short-T2 signal might not get completely inverted by the inversion recovery pulse but only saturated as mentioned e.g. by Wei et al. [4] Therefore, in future work, the T1 model needs to be adapted in order to better fit the underlying signal simulation and additional work on optimizing the inversion pulse might improve the inversion of short T2 tissue. Nevertheless, through the additional data at two distinct echo-times, it should be feasible to obtain quantitative data of T1 relaxation of short- and long-T2 signal components. Furthermore, due to the radial nature of the readout, the k-space center is repeatedly acquired for each spoke and therefore the T1 relaxation will vary across the read-out block. This might lead to a T1 blurring effect. However, we did not find any indication in the resulting T1 maps.Conclusion
The combination of the MP2RAGE concept with a short-T2 sensitive readout allows for B1-insensitive quantification of T1 relaxation times in tissue such as ligament, tendon, or cortical bone. Furthermore, the extension to multiple echoes during the readout enables the distinction between short-T2 and long T2 signal contributions to T1 relaxation times within a voxel. This new ability to simultaneously study the microstructure of tissues in two quantitative dimensions may lead to a deeper understanding and better assessment of their composition as well as pathological processes.Acknowledgements
No acknowledgement found.References
[1] Bachmann, E. et al. T1-and T2∗-Mapping for Assessment of Tendon Tissue Biophysical Properties: A Phantom MRI Study. Invest. Radiol. 54, 212–220 (2019).
[2] Marques, J. P. et al. MP2RAGE, a self bias-field corrected sequence for improved segmentation and T1-mapping at high field. Neuroimage 49, 1271–1281 (2010).
[3] Vannesjo, S. J. et al. Image reconstruction using a gradient impulse response model for trajectory prediction. Magn. Reson. Med. 76, 45–58 (2016).
[4] Wei, Z., Ma, Y. J., Jang, H., Yang, W. & Du, J. To measure T1 of short T2 species using an inversion recovery prepared three-dimensional ultrashort echo time (3D IR-UTE) method: A phantom study. J. Magn. Reson. 314, 100–106 (2020).
Figures