2848
Ultra-fast 3D fMRI to explore cardiac-induced fluctuations in BOLD-based functional imaging1Beckman Institute, University of Illinois Urbana Champaign, Urbana, IL, United States, 2Bioengineering, University of Illinois Urbana Champaign, Urbana, IL, United States, 3Neuroscience Program, University of Illinois Urbana Champaign, Urbana, IL, United States, 4Interdisciplinary Health Sciences Institute, University of Illinois Urbana Champaign, Urbana, IL, United States, 5Carle-Illinois College of Medicine, Urbana, IL, United States, 6NeuroSpin CEA, Saclay, France, 7INSERM, Paris, France, 8Department of Radiology, Leiden University Medical Center, Leiden, Netherlands, 9Paris-Saclay University, Saclay, France
Synopsis
Leveraging recent developments in high speed imaging, we use a 3D fMRI acquisition with 60 ms TR to examine the impact of physiological signals on spatiotemporal correlations in BOLD imaging. Given the standard sampling of fMRI with 2D slices, coherent slice-by-slice sampling of physiological signals can lead to many additional components in the fMRI time series. The current approach provides a way to explore the impact of these confounding signals and to test correction methods.
Introduction
Physiological noise, especially cardiac contributions, can cause significant confounding “signal” in BOLD fMRI1,2. Despite several approaches for reducing the impact of physiological noise on task-based and resting-state fMRI data1,3,4, subject-to-subject variations in heart rate and vascular physiology, along with imperfect models of these, result in residual physiological noise-induced correlations in the data. Furthermore, even when such approaches are followed, the correction is incomplete as the relationship between such measures and the signal changes are not fully characterized and may be subject- and spatially-dependent.The pulse signal in fMRI is especially challenging to address due to the fast speed of the actual heartbeat relative to a TR (~1s), requiring TRs shorter than 0.3 s to satisfy the Nyquist criterion for sampling the first harmonic. Significant energy remains in other harmonics that alias randomly into the TRs of the fMRI time series. This becomes especially problematic with the standard setup, where sampling occurs via 2D slices (or groups of 2D slices as in multiband acquisitions), and each slice is acquired at different time points in the heart cycle. The specific sampling of each slice can induce slice-by-slice correlations in the time series of the data that may be difficult to separate from functionally induced changes. With modern methods of autoalignment of functional slices, there is significant intra-subject and inter-subject repeatability of slice arrangements, making the erroneous correlations reproducible.
In the current work, we exploit recent developments in high-speed imaging to create a 3D fMRI acquisition method (TR = 60 ms for 3D volumetric fMRI) and apply it to study the impact of the cardiac pulse on connectivity networks using ICA5. From a single acquisition of a high temporal resolution dataset, we resample 2D slices at TR rates similar to standard fMRI to examine how the differential resampling of cardiac waveforms give rise to significant correlations in the data.
Methods
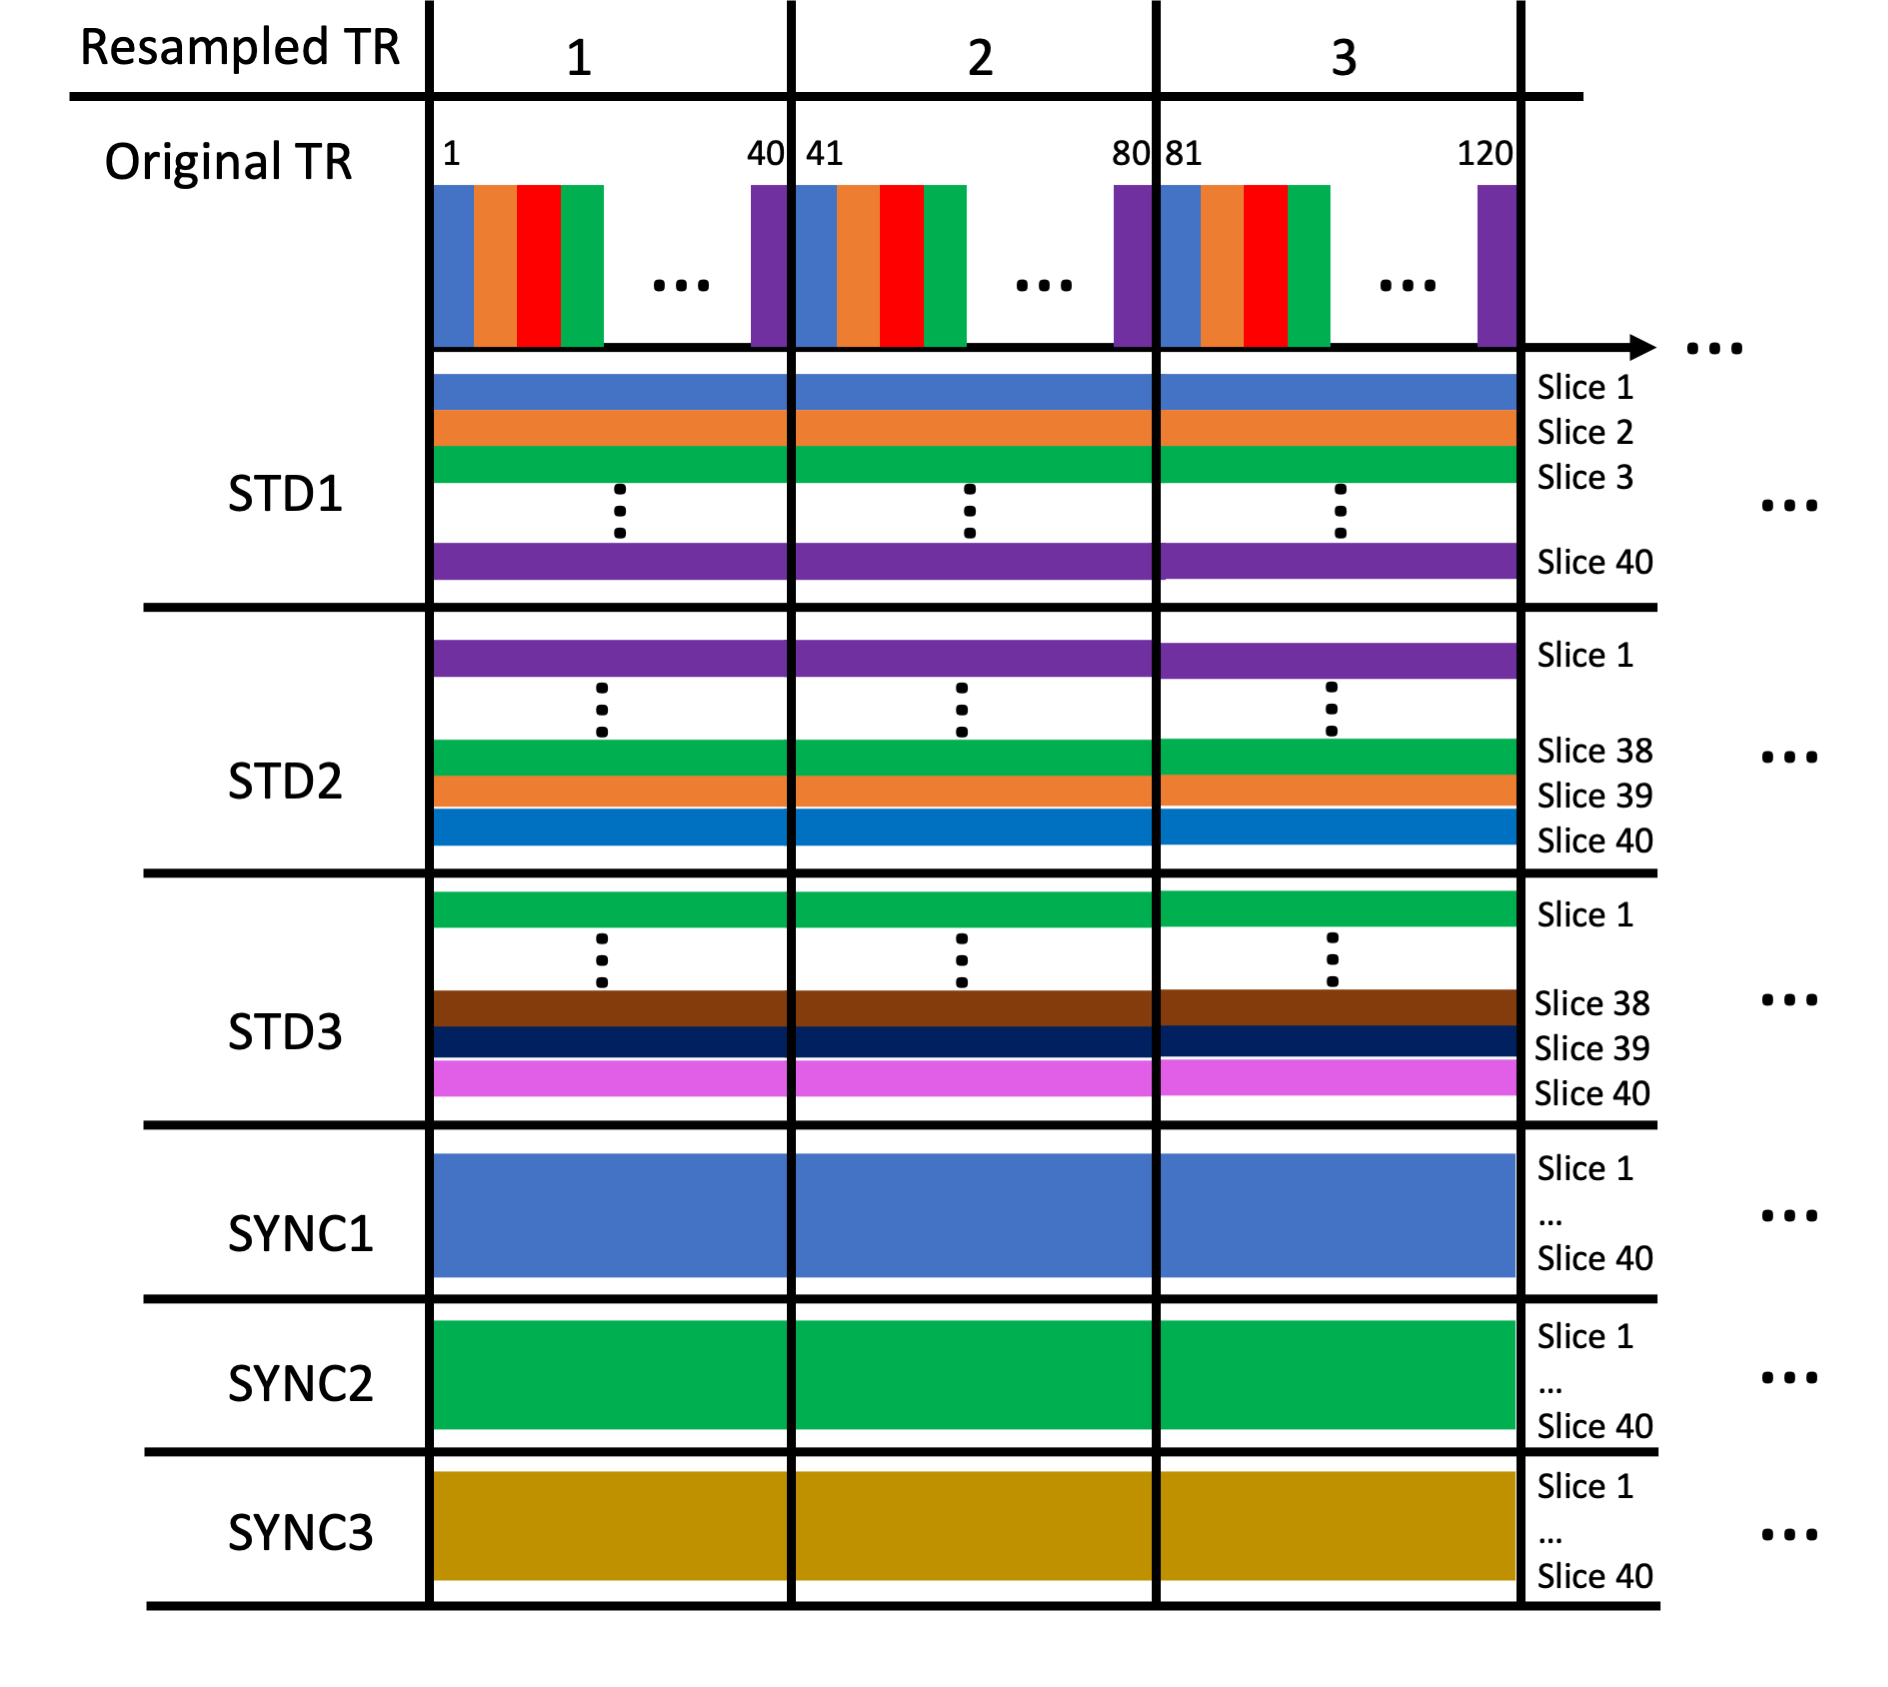
We acquired data using a high-speed fMRI acquisition leveraging the partial separability (PS) model-based image acquisition and reconstruction5-7. The acquisition leverages estimation of temporal bases through a 3D spiral navigator and then 3D imaging of functional slices through a stack-of-spirals acquisition. We acquired 3D fMRI volumes with 3.8x3.8x3 mm resolution with 40 slices enabling full brain coverage at a TR of 60 ms per 3D volume. We obtained 5280 3D volumes in the functional run of 5.3 minutes with a visual flashing checkerboard task (20 s off, 20 s on, 8 repeats). We acquired the participant’s pulse signal from the scanner’s photoplethysmography sensor.We applied ICA methods to explore the components under different resampling scenarios using MELODIC in FSL8, with dimension estimation for each run using the Laplace approximation to the Bayesian evidence of the model order8,9. With our ultra-high temporal resolution, we can group 40 TR’s together and sample one slice per 60 ms TR across this group, forming an effective longer TR of 2.4 s for sampling which is similar to standard fMRI 2D imaging. To ensure that specific sampling patterns did not play a role, we explored several sampling patterns for the serial slice/TR sampling. This resampling is depicted in Figure 1. Finally, we averaged the signal from every TR in the 40-TR block and created an average time series (AVG), to average across physiological noise signals. We hypothesized that sampling time points for each individual slice would lead to a much higher model order due to the physiological noise being sampled on a slice-by-slice basis.
Results
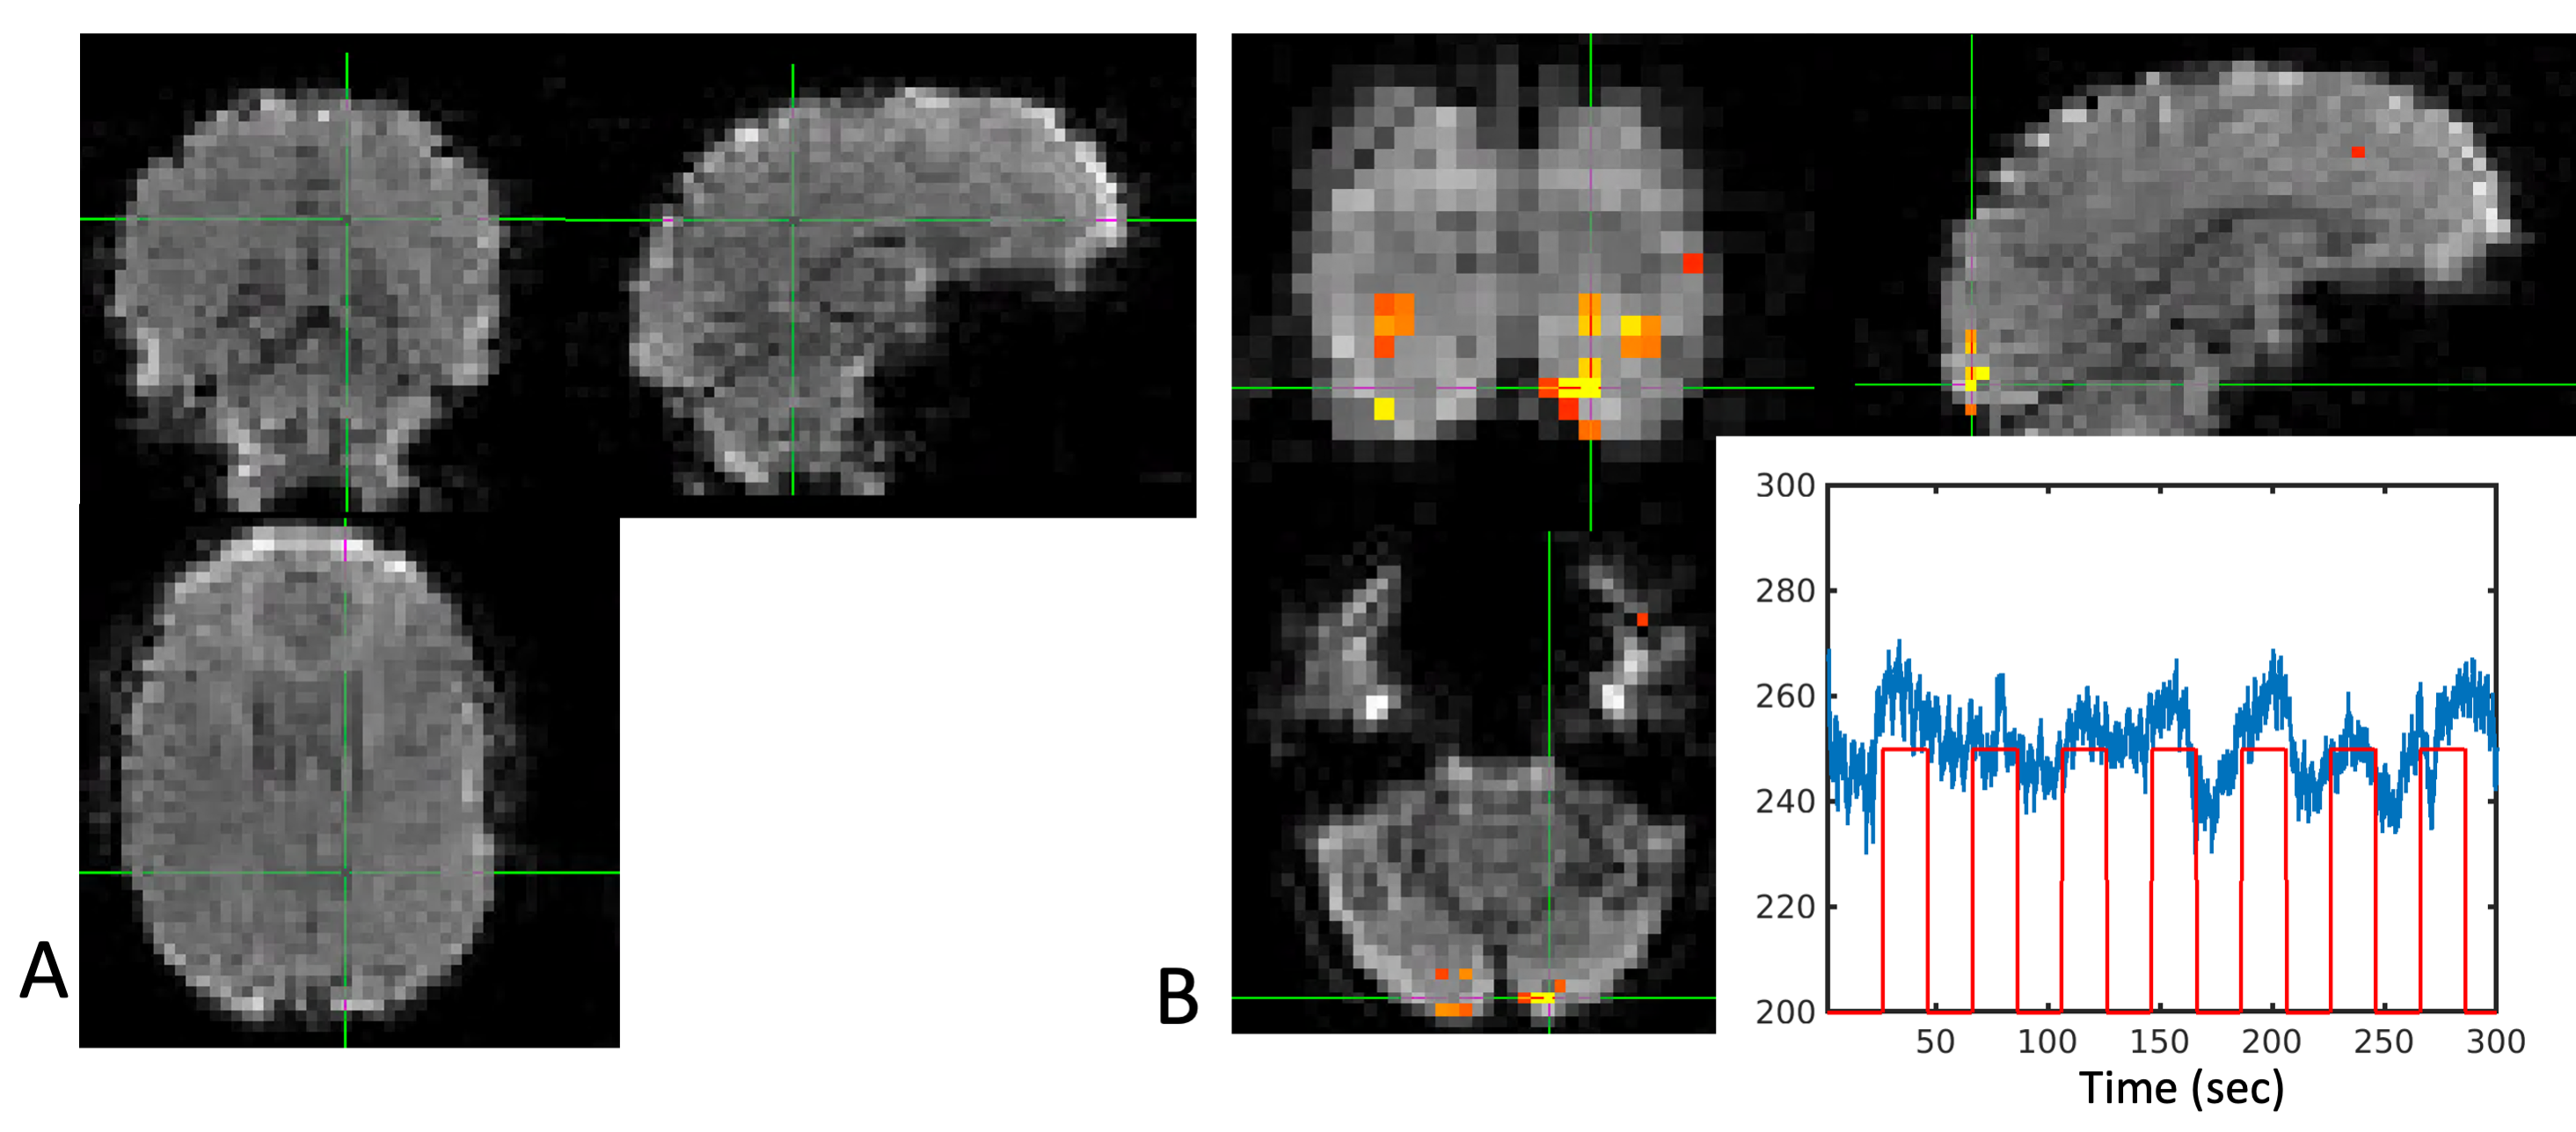
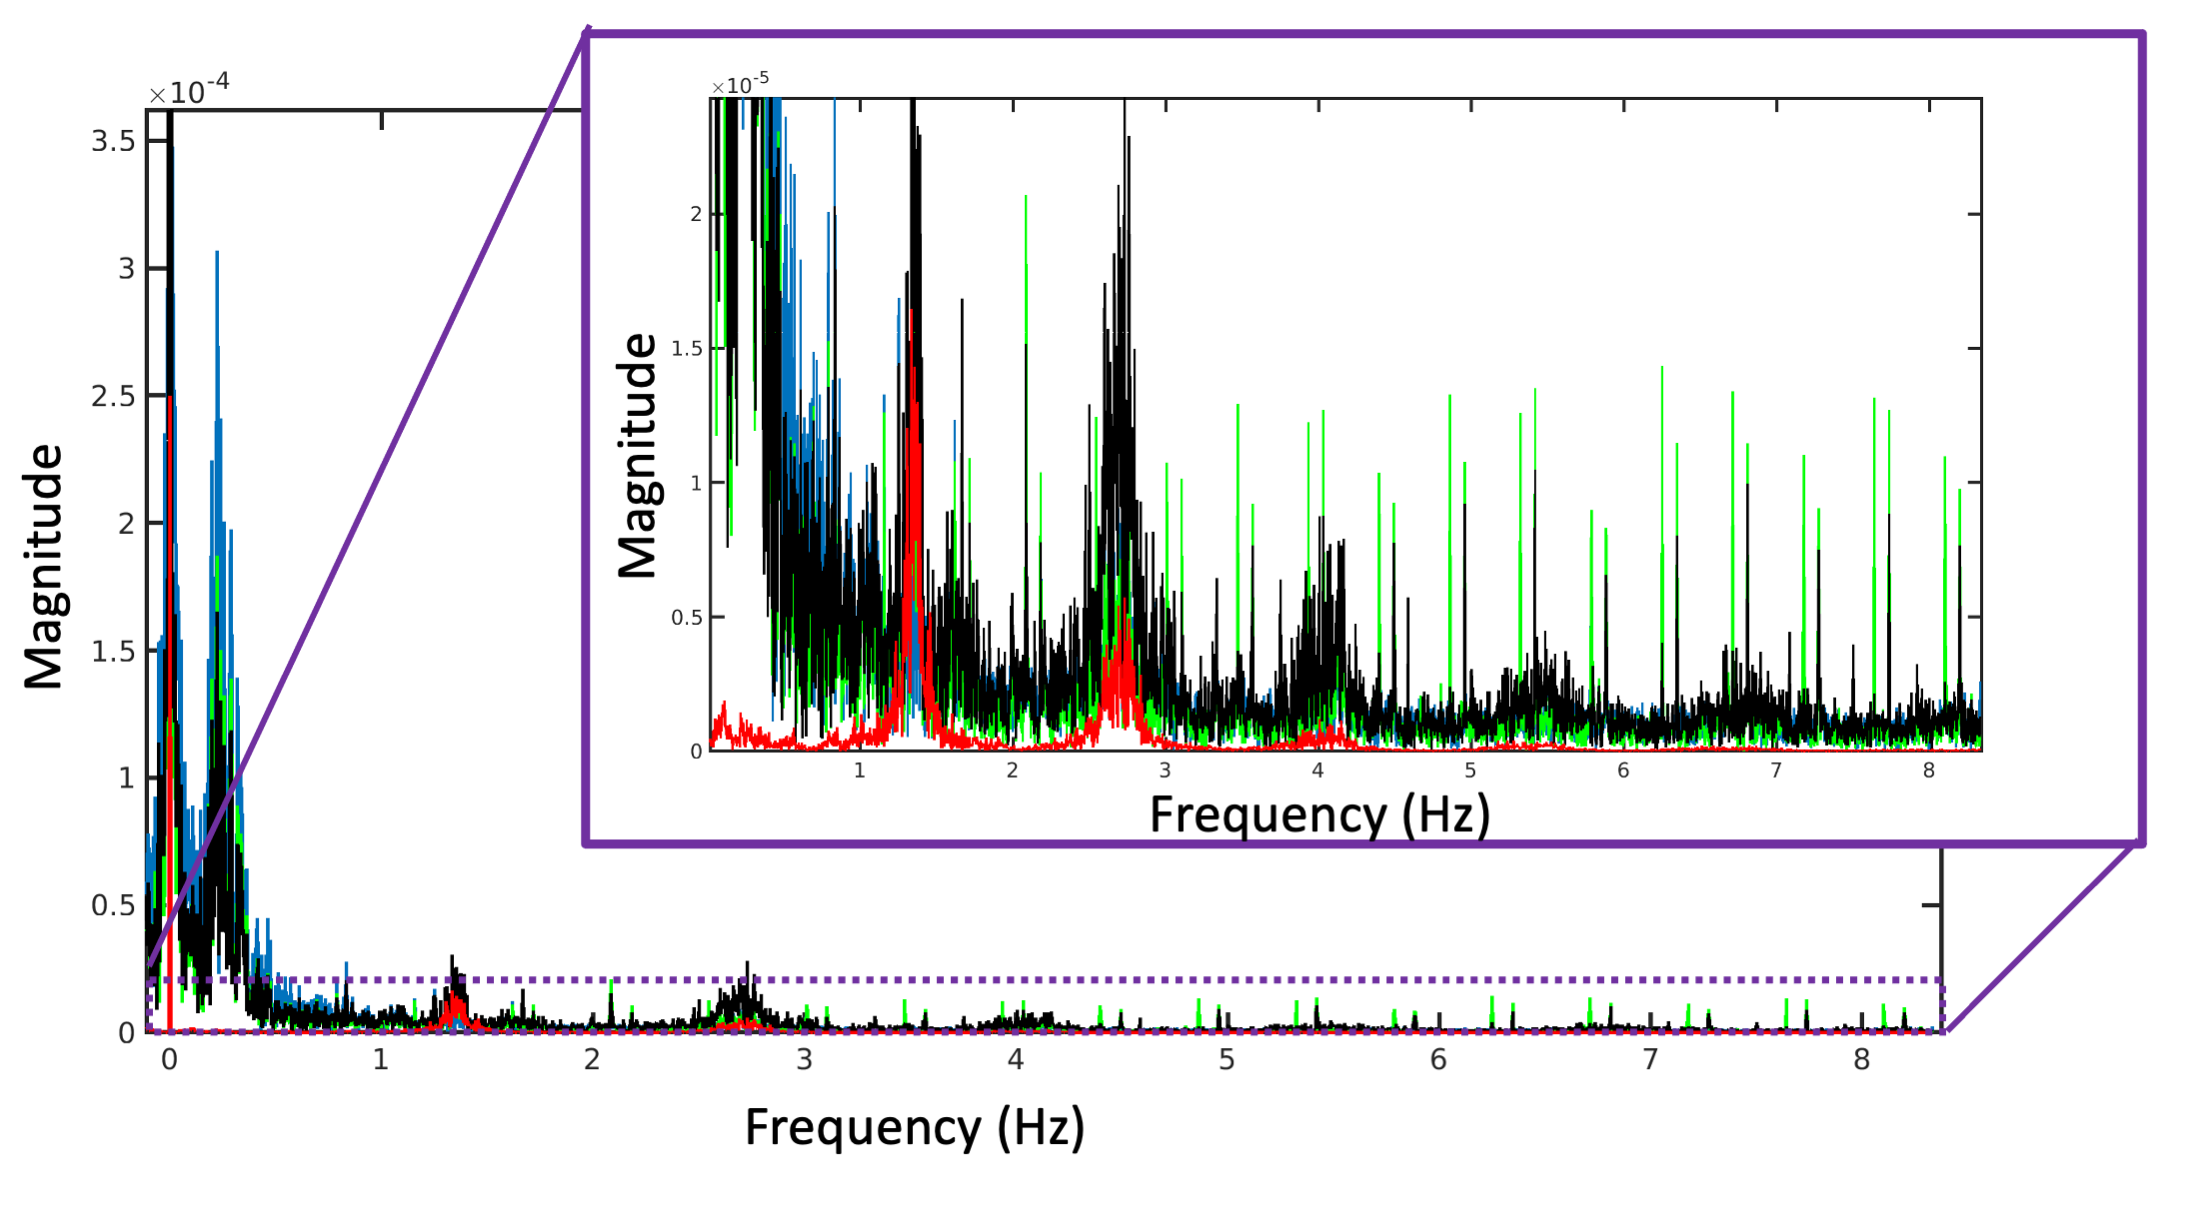
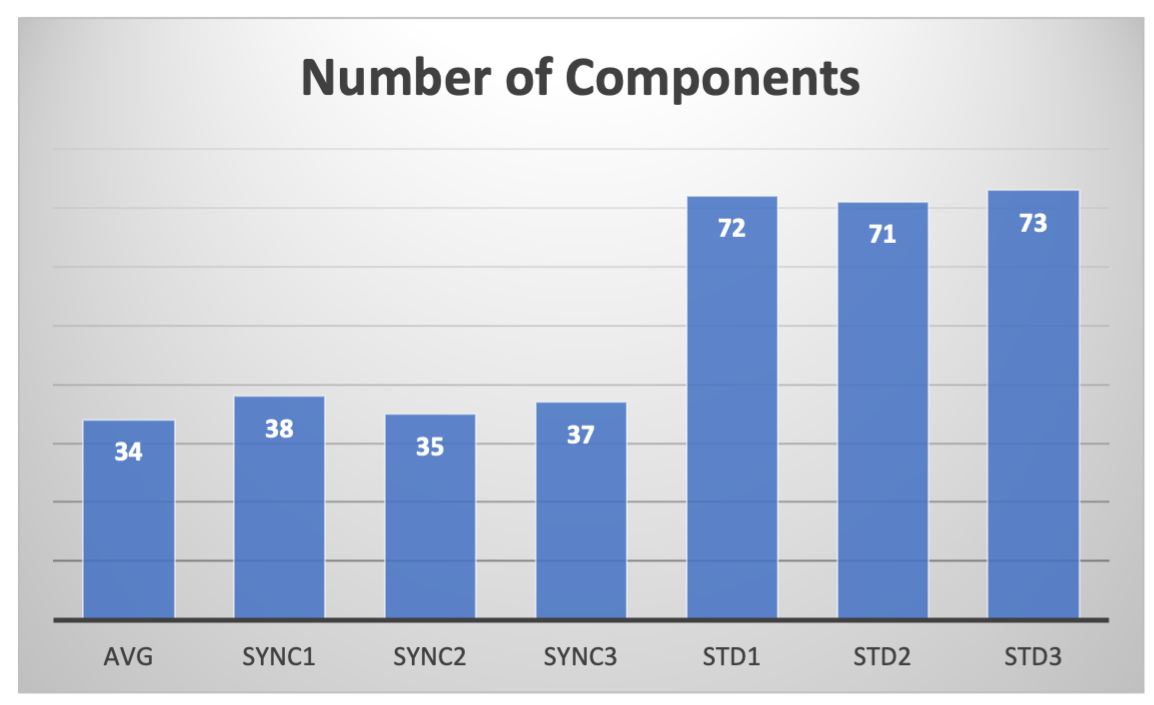
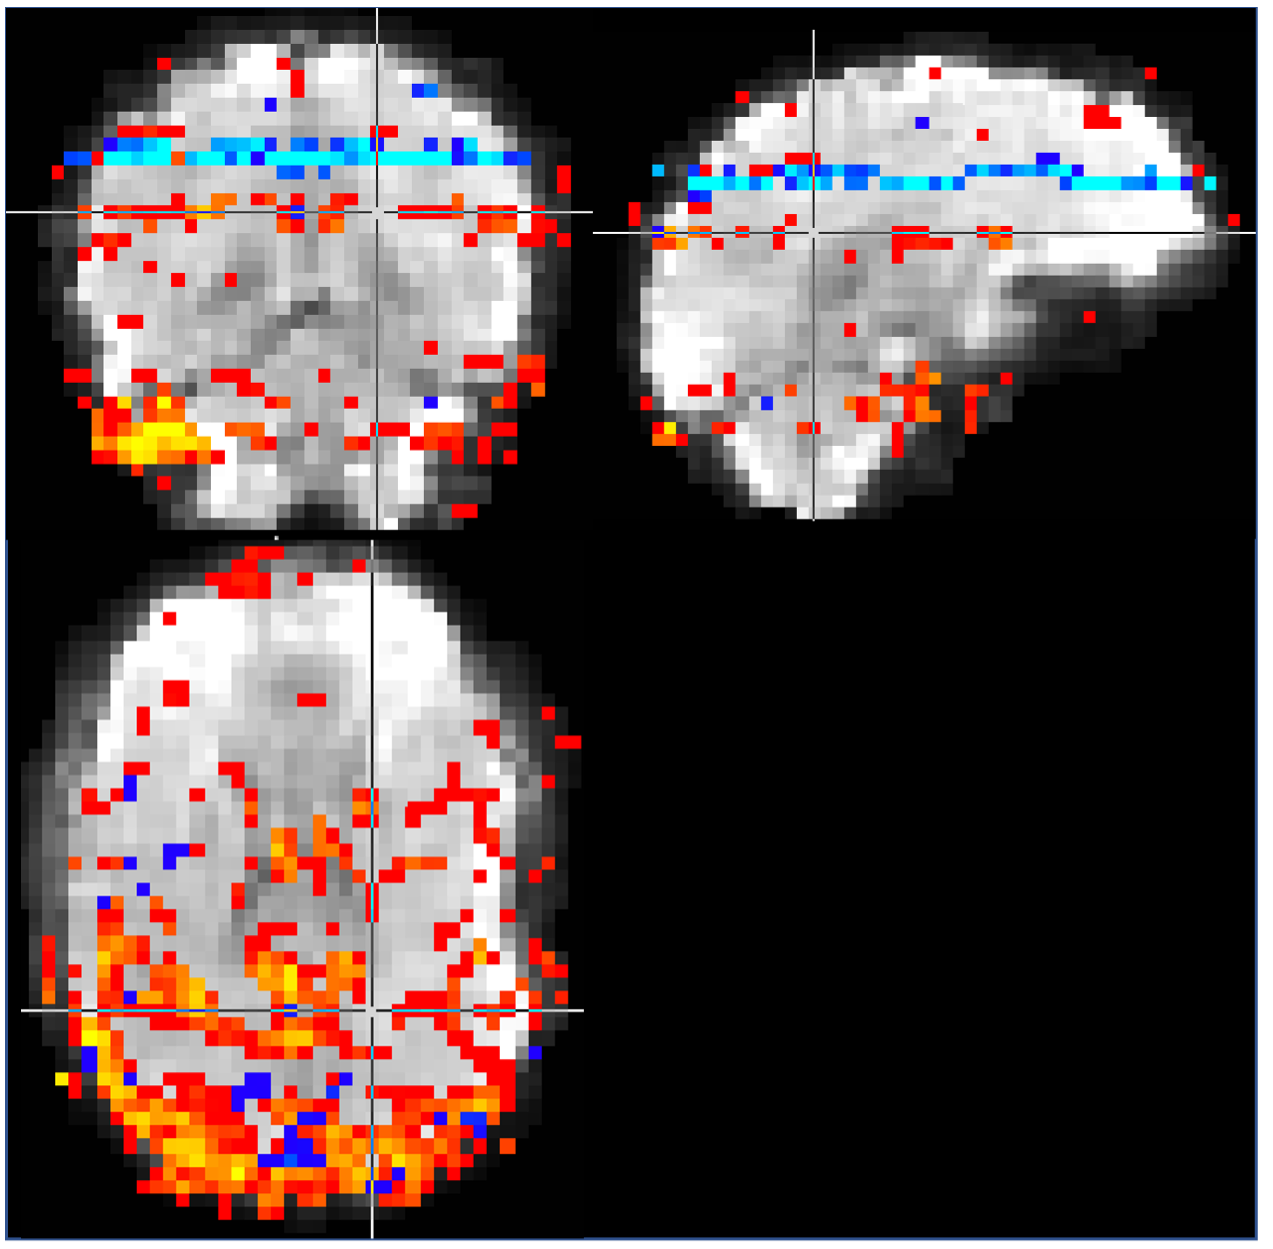
Image 1000 from the time series is shown in Figure 2 along with a map of the pixels showing correlation with the task and the timeseries from an activated pixel. In Figure 3, we show the frequency spectrum of the imaging voxels in the brain in both gray and white matter along with the frequency spectrum of the photoplethysmography sensor. In Figure 4, the automated detection of the number of components in MELODIC shows that there are significantly more components (~72) in the data resampled similar to a standard fMRI acquisition as compared to the synchronized acquisition (~37) or the averaged dataset (34). Figure 5 shows an example of some of the additional components from the ICA analysis, showing that spatially localized components exist that are likely formed from aliased physiological signals due to the unique sampling of this waveform for each slice.Discussion
As shown in Figure 3, the primary harmonic of the heartbeat is at 1.3 Hz, but significant energy is present in the imaging voxels from up to the fifth harmonic. Without adequate sampling, which in this case would require a TR of at most 77 ms, these signals are aliased into the sampling range of the fMRI acquisition. These signals induce spatiotemporal correlations in the data, resulting in new spatiotemporal components that have specific spatial structure as shown in Figure 5.Conclusion
Using a TR of 60 ms is necessary to fully sample the heart-beat signal present in the imaging voxels due to the significant energy even in the 5th harmonic of the primary heartbeat frequency. The currently proposed approach using ultra-high temporal resolution 3D fMRI acquisition provides a way to explore the contributions of internal physiological signals to task-based and resting-state fMRI.Acknowledgements
This work was supported in part by NIH NIDCR under Award Number R01DE027989, a Strategic Research Initiative grant from the Grainger College of Engineering at UIUC, and a Beckman Institute Graduate Fellowship at UIUC.References
1. Hu X, Le TH, Parrish T, Erhard P. Retrospective estimation and correction of physiological fluctuation in functional MRI. Magn Reson Med. 1995;34(2):201-12.
2. Birn RM, Cornejo MD, Molloy EK, Patriat R, Meier TB, Kirk GR, Nair VA, Meyerand ME, Prabhakaran V. The influence of physiological noise correction on test-retest reliability of resting-state functional connectivity. Brain Connect. 2014;4(7):511-22. PMCID: PMC4146390.
3. Glover GH, Li TQ, Ress D. Image-based method for retrospective correction of physiological motion effects in fMRI: RETROICOR. Magn Reson Med. 2000;44(1):162-7.
4. Shmueli K, van Gelderen P, de Zwart JA, Horovitz SG, Fukunaga M, Jansma JM, Duyn JH. Low-frequency fluctuations in the cardiac rate as a source of variance in the resting-state fMRI BOLD signal. NeuroImage. 2007;38(2):306-20. PMCID: PMC2128785.
5. Ngo GC, Holtrop JL, Fu M, Lam F, Sutton BP. High temporal resolution functional MRI with partial separability model. Conf Proc IEEE Eng Med Biol Soc. 2015;2015:7482-5.
6. Liang Z-P. Spatiotemporal imaging with partially separable functions. International Symposium on Biomedical Imaging2007. p. 988-91.
7. Fu M, Zhao B, Carignan C, Shosted RK, Perry JL, Kuehn DP, Liang ZP, Sutton BP. High-resolution dynamic speech imaging with joint low-rank and sparsity constraints. Magn Reson Med. 2015;73(5):1820-32. PMCID: 4261062.
8. Beckmann CF, Smith SM. Probabilistic independent component analysis for functional magnetic resonance imaging. IEEE Trans Med Imaging. 2004;23(2):137-52.
9. Minka T. Automatic choice of dimensionality for PCA. MIT Medial Lab Vision and Modeling Group; 2000 Contract No.: Technical Report 514.
Figures