2845
Adaptive non-local means filtering as a drop-in preprocessing step to improve statistical sensitivity in task-based fMRI1Imaging Institute, Cleveland Clinic, Cleveland, OH, United States, 2Cleveland Clinic, Cleveland, OH, United States
Synopsis
Spatial filtering is an important step in the preprocessing of task-based fMRI to improve sensitivity in statistical analyses. This is usually implemented as a pure distance-based filter such as Gaussian filtering or an optimized matched filter. Adaptive non-local means (ANLM) filtering is a patch-based approach that is sensitive to the local noise model, especially at low signal to noise ratio such as fMRI. We show how ANLM filtering is a simple drop-in replacement at the spatial smoothing step of fMRI preprocessing pipeline that compares favorably to other approaches while better preserving local high frequency features.
Introduction
Task-based fMRI involves the extraction and analysis of small signal fluctuations, on the order of 1-3% signal changes on a background of noise that is several multiples stronger. To mitigate this challenge, spatial smoothing has been deployed to improve signal to noise as a preprocessing step. Most common among these is Gaussian filtering, which significantly blurs tissue borders and subsequently reduces specificity in activation maps. Several other approaches have been proposed to denoise fMRI data without introducing excessive blurring, including a matched-filtering based approached using 2D Hamming windows1. Recently, adaptive non-local means (ANLM) filtering has been used as a boundary preserving filter for structural and diffusion imaging2,3. ANLM filtering is based on local patch similarity as the weighting coefficient in the filtering kernel, normalized by a locally adaptive, model appropriate estimation of the noise. We propose to use ANLM filtering as a preprocessing step for a visual checkerboard fMRI task and analyze the nature and extent of denoising.Methods
A block design visual checkerboard task was used consisting of four 88 second blocks of checkboards rotating through each quadrant of the visual field for 22 seconds per quadrant. Functional imaging was performed on a Siemens Trio 3T (Siemens Medical Solutions, Erlangen, Germany) using a 12 channel coil. Whole brain fMRI data were acquired with 31 contiguous 4 mm think axial slices (TE/TR=29/2800 ms, 160 volumes, 80° flip, 1282 matrix, 2562 FOV, 2x2x4 mm3 resolution). High resolution T1w images were acquired for anatomical context.Functional data were corrected for slice timing and motion4. Afterwards, data were either left unfiltered, filtered with an isotropic 4 mm FWHM Gaussian kernel, filtered with a 2d Hamming window designed to match the underlying noise1, or filtered using ANLM. ANLM filtering was performed on each separate volume as implemented by ANTS using a Rician noise model and default spatial parameters (search radius 2 voxels, patch radius 1 voxel). Spatial autocorrelation was estimated using AFNI’s 3dFWHMx. Task-based analysis was performed using AFNI’s 3dDeconvolve to estimate t maps for the lower left visual quadrant, and signal change maps were calculated using the ratio of beta coefficients for the task-based contrast and the baseline signal.
Results
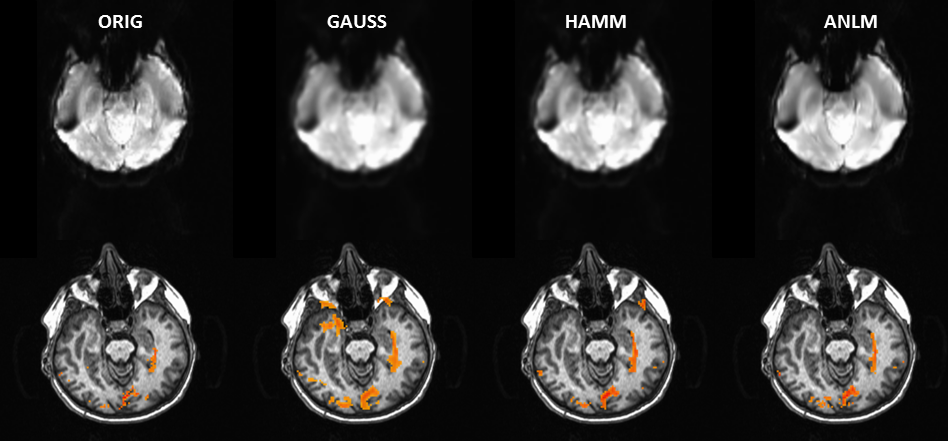
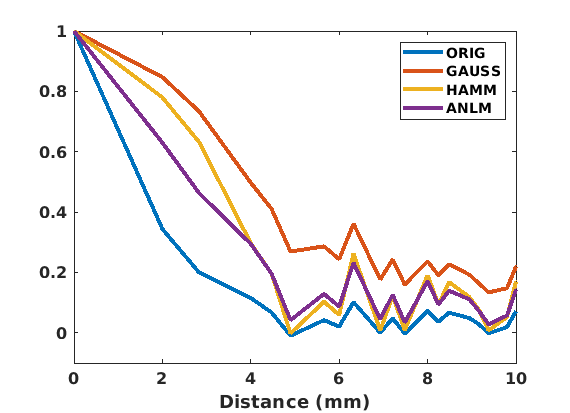
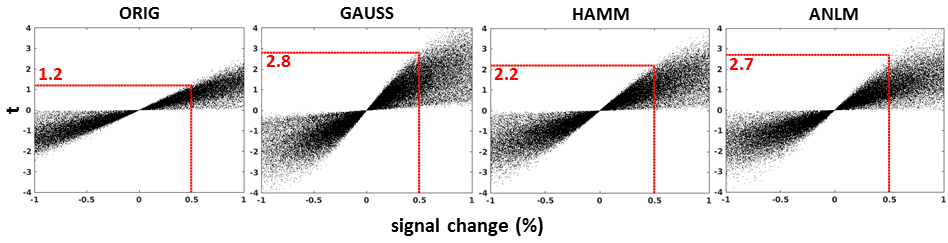
ANLM filtering took only 5 minutes for a 128x128x31x160 dataset. The resulting images preserve significantly more high frequency features. Figure 1 shows EPI (top row) and t-maps (bottom row, t threshold = 3.5, single quadrant activation) for unfiltered, Gaussian filtered, Hamming filtered and ANLM filtered data on a representative subject. The ANLM filtered image preserves more sulcal features than both the Gaussian and Hamming filtered image. The Gaussian filtered image in particular loses several high frequency features after blurring. In addition, while the intensity of visual stimulation is similar, the ANLM filtered t map shows less blurring and slightly better fine features than the other filter-based t maps. This is also reflected in the estimate of autocorrelation from the filtered images shown in figure 2. ANLM filtering better preserves the original autocorrelation than both Gaussian and Hamming filtering. The estimated spatial blurring was 3.16, 7.81, 5.82, and 5.23 mm for unfiltered, Gaussian filtered, Hamming filtered, and ANLM filtered data, respectively.Finally, we directly examine the denoising effect on statistical strength by comparing signal change (%) to student’s t. Figure 3 shows this comparison for unfiltered, Gaussian filtered, Hamming filtered and ANLM filtered data. All voxels throughout the brain are plotted. The slope of maximum t for a given percent change of all filtered images, a reflection of sensitivity to a given BOLD signal change, are significantly greater than the unfiltered image, with Gaussian and ANLM filtering showing the strongest improvement.
Discussion
ANLM filtering results in a significant improvement in denoising over both a 4 mm FWHM isotropic Gaussian filter and a 2D Hamming filter matched to the underlying signal. All filtering significantly improves statistical outcomes over unfiltered data, but ANLM matches Gaussian filtering in denoising while demonstrating substantially lower spatial blur. For example, in figure 3, for a 0.5% signal change (red line), Gaussian filtered data will result in a t value of 2.8 while ANLM performs nearly equally with a t value of 2.7. Although preserving spatial resolution similar to ANLM, for the same signal change, the Hamming filter only boosts sensitivity to a t value of 2.2. Clearly, these results show that ANLM shows less spatial blurring, preserving edge features better than other pure distance-based spatial filters while boosting BOLD sensitivity in a manner equivalent to what is obtained from a very strong spatial filter.Conclusion
ANLM filtering represents a fast, straightforward, drop-in preprocessing step that significantly improves statistical sensitivity while preserving high spatial frequency features in task-based fMRI. In terms of preserving spatial resolution and improving BOLD contrast-to-noise ratio, it clearly outperforms to commonly used filters for spatial preprocessing.Acknowledgements
No acknowledgement found.References
1. Lowe MJ and Sorenson JA. Spatially filtering functional magnetic resonance imaging data. Magn Reson Med. 1997;37(5):723-729.
2. Coupe P, et al. An optimized blockwise non local means denoising filter for 3D magnetic resonance images. IEEE Trans Med Imag. 2008;27(4):425-441.
3. Manjon JV, et al. Adaptive non-local means denoising of MR images with spatially varying noise levels. J Mag Res Imag. 2010;13:192-203.
4. Beall E and Lowe M. SimPACE: generating simulated motion corrupted BOLD data with synthetic-navigated acquisition for the development and evaluation of SLOMOCO: a new, highly effective slicewise motion correction. NeuroImage. 2014;101:21-34.
Figures