2844
Monte Carlo simulations of weighted overlap map thresholds to reduce the risk for type I errors in fMRI1Radiology, UZ Brussel (VUB), Brussels, Belgium
Synopsis
We performed Monte Carlo Simulations to show that the risk for type I errors decreases if a minimum overlap between the individual results is set in addition to the significance of the group results. The activation maps of a real fMRI experiment showed that the combination of a weighted overlap map threshold in combination with a voxel significance threshold seems to lead to less type II errors compared to applying a family wise error (FWE) correction.
Introduction
In fMRI, the common practice is to report the significance of the found group results only. However, a significant group effect is not always supported by effects observed in the individual subjects1,2,3. Seghier et al. (2016) showed that weighted overlap maps (WOM) can aid the interpretation of group effects by looking at the variability of the effects observed at subject’s level. In this study, we illustrate how the use of WOM can help reducing the chance for false positive results using Monte Carlo simulations (MCS) and real fMRI data.Methodology
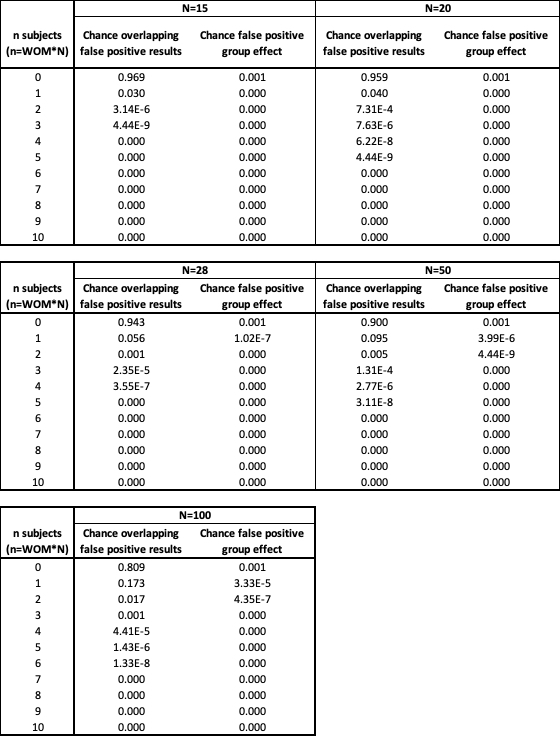
Monte Carlo SimulationsThe MCS were done in RepSim4. We performed 1000 MCS simulating the statistical activation maps per subject for 5 fMRI experiments (sample sizes 15, 20, 28, 50 and 100 subjects). In each simulation, a WOM was calculated based on the statistical significance p:
$$WOM=\frac{1}{N}.\sum_{i=1}^N\begin{cases}1 & p_{i} \leq 0.001\\e^{-\frac{1}{2}.(\frac{p_{i}-0.001}{0.001})^{2}} & p_{i} > 0.001\end{cases}$$
with N the number of subjects and pi the significance of the activation in subject i.
Per MCS, a group analysis was performed and the resulting statistical map was thresholded at p<0.001.
Per fMRI experiment, we calculated the chance per voxel for overlapping false positive activations in n subjects (n in [0…N]) and the chance for an additional false positive group effect.
fMRI Experiment
To illustrate the effect of applying a WOM based mask on fMRI results, we used data of 28 subjects (24 females, age 25±3) participating in an episodic future thinking (EFT) fMRI experiment. In this experiment, the participants were asked to imagine an event that could happen in their own future associated with the words presented on a screen (e.g. word: car, event: driving to a friend next weekend). The multi-echo fMRI scan was done on a GE MR750W scanner (18 trials lasting 20s with 4s rest, 210 dynamics, TR=2s, TE=17/39.2/61.4ms).
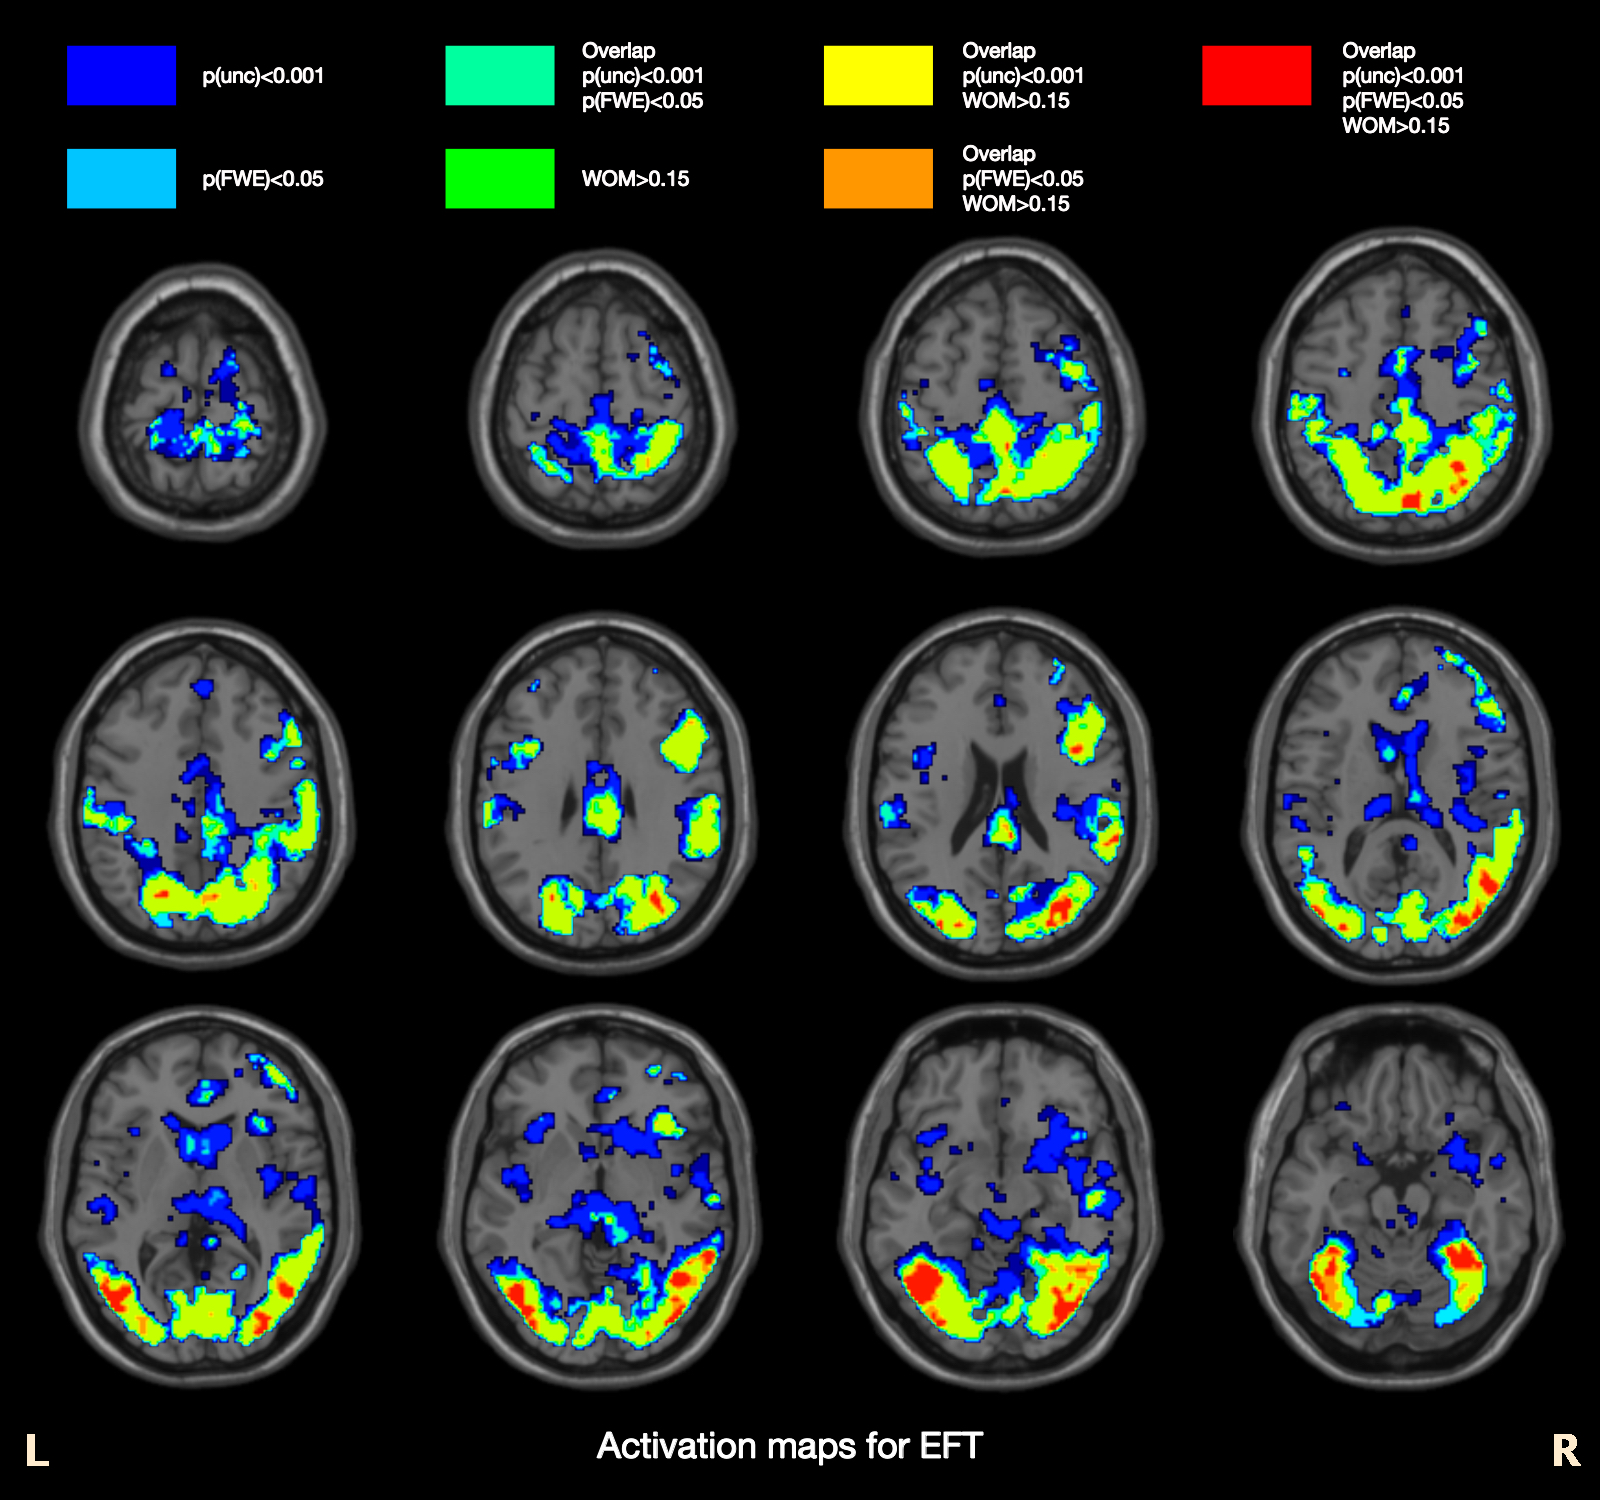
After processing the individual fMRI scans in SPM125, a 1-sample T-test on the activation maps was performed and a WOM was calculated. The group activation map for EFT was thresholded at p(uncorrected)<0.001, p(FWE)<0.05 and p(uncorrected)<0.001 combined with WOM>0.15 (at least 5 subjects).
Results
Monte Carlo SimulationsThe MCS showed that for all sample sizes, in each voxel the chance of having a false positive result at group level not supported at subject’s level was 0.001. The chance of having a false positive activation in only 1 subject was 0.030 for N=15, 0.040 for N=20, 0.056 for N=28, 0.095 for N=50 and 0.173 for N=100. The chance that a false positive result in only 1 subject is also significant at group level was 0.000 for N=15 and N=20, 1.02E-7 for N=28, 3.99E-6 for N=50 and 3.33E-5 for N=100. The largest overlap seen between false positive subject’s results was 5 for N=15, 6 for N=20, 5 for N=28, 6 for N=50 and 7 for N=100. The largest overlap seen between individual results that also showed a significant group results was 1 for N=15 and N=20, 2 for N=28 and 3 for N=50 and N=100. The results of the MCS are summarized in table 1.
fMRI Experiment
The maximum WOM of the individual activation maps for EFT was 0.73. Figure 1 shows the overlap between the activation map thresholded at p(uncorrected)<0.001, p(FWE)<0.05 and p(uncorrected)<0.001 combined with WOM>0.15.
Discussion
Our Monte Carlo simulations showed that the risk for false positive results repeatedly observed in multiple subjects increased with sample size. However, the chance of having a significant false positive group result supported by false positive results in multiple subjects, decreased with the overlap between the individual results. This observation supports the call of Chen et al. (2017) and Seghier et al. (2016) that it is interesting to give more attention at the individual effects underlying observed group effects.The activation maps of a real fMRI experiment showed that our proposed group significance combined with a minimum WOM threshold resulted in more and larger activation areas compared to the family wise error (FWE) correction, while large parts of the activations found with p(uncorrected)<0.001 were filtered out as possibly false positives. Since the FWE correction is known to inflate the risk for type II errors6, our results suggest that our combined threshold method makes a better balance between type I and type II errors. However, task related activations occurring in a few subjects only, will be misted due to the WOM threshold.
Conclusion
As illustrated in this study, using a WOM based on the individual activation maps in combination with the significance of group results can help reducing the risk for false positive results in a fMRI study.Acknowledgements
The ME-fMRI sequence used in this study was provided by GE as a research key.References
1. Chen G., Taylor A., Cox W., 2017. Is the statistical value all we should care about in neuroimaging? NeuroImage 147: 952-959
2. Seghier M.L., Price C., 2016. Visualising inter-subject variability in fMRI using threshold-weighted overlap maps. Sci Rep 6: 20170
3. Van Schuerbeek P. 2018. Effect size and result overlap between individual and group results in fMRI studies. ISMRM 2018 (Paris, France), Abstract 881
4. https://github.com/P-VS/RepSim
5. http://www.fil.ion.ucl.ac.uk/spm/
6. Lieberman M., Cunningham W., 2009. Type I and Type II error concerns in fMRI research: re-balancing the scale. Soc. Cogn. Affect. Neurosci. 4(4): 423-8
Figures