2839
Influence of fat suppression and image reconstruction methods on ADC of uninvolved bone marrow in patients with myeloma.1MRI Unit, The Royal Marsden NHS Foundation Trust, Sutton, United Kingdom, 2Division of Radiotherapy and Imaging, The Institute of Cancer Research, Sutton, United Kingdom, 3Department of Haematology, The Royal Marsden NHS Foundation Trust, Sutton, United Kingdom, 4Division of Genetics and Epidemiology, The Institute of Cancer Research, Sutton, United Kingdom
Synopsis
The influence of fat suppression methods and image reconstruction parameters on the apparent diffusion coefficient (ADC) in uninvolved bone marrow was assessed in 18 patients with myeloma. ADC estimates from diffusion-weighted MRI acquired using spectral adiabatic inversion recovery (SPAIR) fat suppression were significantly lower than DW-MRI with short-tau inversion recovery (STIR). ADC estimates were significantly lower in data reconstructed using sum-of-squares coil-combination mode compared with adaptive combine, but there was no difference between additional reconstruction filters (raw, elliptical). These results show that differences between imaging protocols should be considered when comparing ADC estimates with established ranges and in multi-centre studies.
Introduction
Whole-body MRI (WB-MRI) including diffusion-weighted MRI (DW-MRI) is recommended for assessment of bone disease and response to treatment in myeloma1 and metastatic prostate cancer2. Response assessment requires discrimination between new lesions, treated lesions and bone marrow that appears normal and is not involved by the disease (‘uninvolved bone marrow’). ADC thresholds have been proposed for disease assessment1,3.Uninvolved bone marrow contains a large proportion of fat and exhibits low signal-to-noise ratio (SNR) in fat-suppressed DW-MRI. ADC estimates are, therefore, potentially sensitive to residual signals from unsuppressed fat and factors affecting SNR such as image reconstruction methods.
The aim of this study is to define the expected range of ADC estimates in uninvolved bone marrow in patients with myeloma using a standard WB-MRI protocol; assess differences between ADC estimates from DW-MRI with different fat suppression methods and the relationship with fat fraction; and investigate effects of coil-combination mode and reconstruction filters.
Method
This prospective study received institutional review board approval; the requirement for written consent was waived. Patients with myeloma undergoing WB-MRI examinations were included if they were aged over 18 years, had uninvolved bone marrow in the pelvis, and were in biochemical remission. Patients with diffuse disease, focal lesions in the pelvis, or metal implants in the pelvis/abdomen/legs were excluded. Patients were imaged on a 1.5T MRI scanner (MAGNETOM Aera, Siemens Healthcare, Erlangen, Germany). DW-MRI with short-tau inversion recovery (STIR-DW-MRI) and spectral adiabatic inversion recovery (SPAIR-DW-MRI) fat suppression and proton density-weighted (PD-w) Dixon imaging were acquired in a single station in the pelvis (Figure 1). DW-MRI data were reconstructed using adaptive combine (AC) coil-combination mode; further reconstructions used sum-of-squares (SOS) coil-combination mode, and AC with additional reconstruction filters (weak, medium, and strong raw filters, and elliptical filter) (Figure 1).Regions-of-interest (ROIs) were drawn in marrow in iliac bones and sacrum (Figure 2), using in-house software4. Further analysis was conducted using Matlab 2021a (Mathworks, Natick, MA). Mono-exponential decay curves were fitted to the measured signal in trace-weighted images from three b-values for each voxel; the median ADC was calculated for all fitted voxels in all ROIs. Fat fraction (FF) in the same ROIs was estimated as SF/(SF+SW), where SF and SW are signals in fat-only and water-only Dixon images.
Comparison between ADC estimates used log-transformed values, with Bonferroni correction for multiple comparisons. Paired t-tests were used to compare ADC estimates from STIR-DW-MRI versus SPAIR-DW-MRI (ADCSTIR and ADCSPAIR respectively) and AC versus SOS; one-way ANOVA was used to compare reconstruction filters. The relationship between FF and the difference between ADCSTIR and ADCSPAIR was assessed using Pearson’s correlation coefficient. Noise was assessed using standard deviation of signal in separate b=50smm-2 images (12 images/slice) and compared using a Kruskal-Wallis test.
Results
18 patients were included (median age 62 years, range 39-86 years, 14 men, 4 women). The median ADC in uninvolved bone marrow was 0.63x10⁻³mm2s-1 (range 0.34-0.81x10⁻³mm2s-1) (STIR, AC, no additional filters, Figure 3). ADCSPAIR was significantly lower than ADCSTIR (Figure 3). There was no correlation between FF and the difference between ADCSTIR and ADCSPAIR (Figure 4).ADC estimates were significantly lower using SOS compared with AC coil-combination; there was no difference between ADC estimates using additional reconstruction filters (Figure 3). DW-MRI using SOS coil-combination exhibits a central band of high noise (Figure 5). Standard deviation of signal in separate b=50smm-2 images differed between AC and SOS and between weak/strong raw filters in SPAIR-DW-MRI (Figure 5).
Discussion
ADC estimates in uninvolved bone marrow differ significantly between DW-MRI protocols using different fat suppression methods or coil-combination modes, which should be considered when comparing with ranges established from other imaging protocols or combining data in multi-centre studies.The significant difference between ADCSTIR and ADCSPAIR may be due to signal from unsuppressed fat. Resonances near 5.3ppm (olefinic) are not suppressed by SPAIR but are suppressed by STIR; residual fat signal with a low ADC reduces the measured ADC in voxels containing both water and fat5. STIR is recommended in WB-MRI1,2, while spectrally-selective techniques such as SPAIR are often used in other DW-MRI applications (e.g. abdomen/pelvis). Differences in ADC estimates have also been reported between STIR applied alone and in combination with spectral-spatial excitation in vertebral marrow6. The absence of correlation between FF and the difference between ADCSTIR and ADCSPAIR may be due to the high FF in the majority of patients in this study.
The significantly lower ADC estimates using SOS may reflect bias due to low SNR. Similar bias has also been demonstrated in diffusion tensor imaging using SOS7. Scanners with poor SNR may also exhibit similar bias in ADC estimates in uninvolved bone marrow. Although additional reconstruction filters (elliptical, raw) are designed to increase SNR, differences may be small and no effect on ADC was observed here.
A limitation of this study is that only one scanner was included; further work will include additional scanners at 1.5T and 3T.
Conclusion
ADC estimates in uninvolved bone marrow in patients with myeloma show significant dependence on fat suppression methods and coil-combination modes. Differences in imaging protocols should be considered when comparing ADC estimates with ranges established using other protocols or scanners, or combining data in multi-centre studies.Acknowledgements
We acknowledge funding from Cancer Research UK and Engineering and Physical Sciences Research Council support to the Cancer Imaging Centre at the Institute of Cancer Research and Royal Marsden Hospital in association with the Medical Research Council and Department of Health C1060/A10334, C1060/A16464 and National Health Service funding to the National Institute for Health Research Biomedical Research Centre, Experimental Cancer Medicine Centre, the Clinical Research Facility in Imaging, and the Cancer Research Network. The views expressed in this publication are those of the author(s) and not necessarily those of the National Health Service, the National Institute for Health Research or the Department of Health.References
1. Messiou C, Hillengass J, Delorme S et al (2019) Guidelines for Acquisition, Interpretation, and Reporting of Whole-Body MRI in Myeloma: Myeloma Response Assessment and Diagnosis System (MY-RADS). Radiology 291:5-13.
2. Padhani AR, Lecouvet FE, Tunariu N et al (2017) METastasis Reporting and Data System for Prostate Cancer: Practical Guidelines for Acquisition, Interpretation, and Reporting of Whole-body Magnetic Resonance Imaging-based Evaluations of Multiorgan Involvement in Advanced Prostate Cancer. Eur Urol 71:81-92.
3. Padhani AR, van Ree K, Collins DJ, D’Sa S, Makris A (2013) Assessing the relation between bone marrow signal intensity and apparent diffusion coefficient in diffusion-weighted MRI. American Journal of Roentgenology 200:163-170.
4. https://wiki.xnat.org/documentation/xnat-ohif-viewer
5. Hernando D, Karampinos D, King K et al (2011) Removal of olefinic fat chemical shift artifact in diffusion MRI. Magnetic resonance in medicine 65:692-701.
6. Tsujikawa T, Makino A, Oikawa H et al (2021) Assessing the ADC of Bone-marrow on Whole-body MR Images in Relation to the Fat-suppression Method and Fat Content. Magnetic Resonance in Medical Sciences 2020-0129.
7. Sakaie K, Lowe M (2017) Retrospective correction of bias in diffusion tensor imaging arising from coil combination mode. Magnetic resonance imaging 37:203-208.
Figures
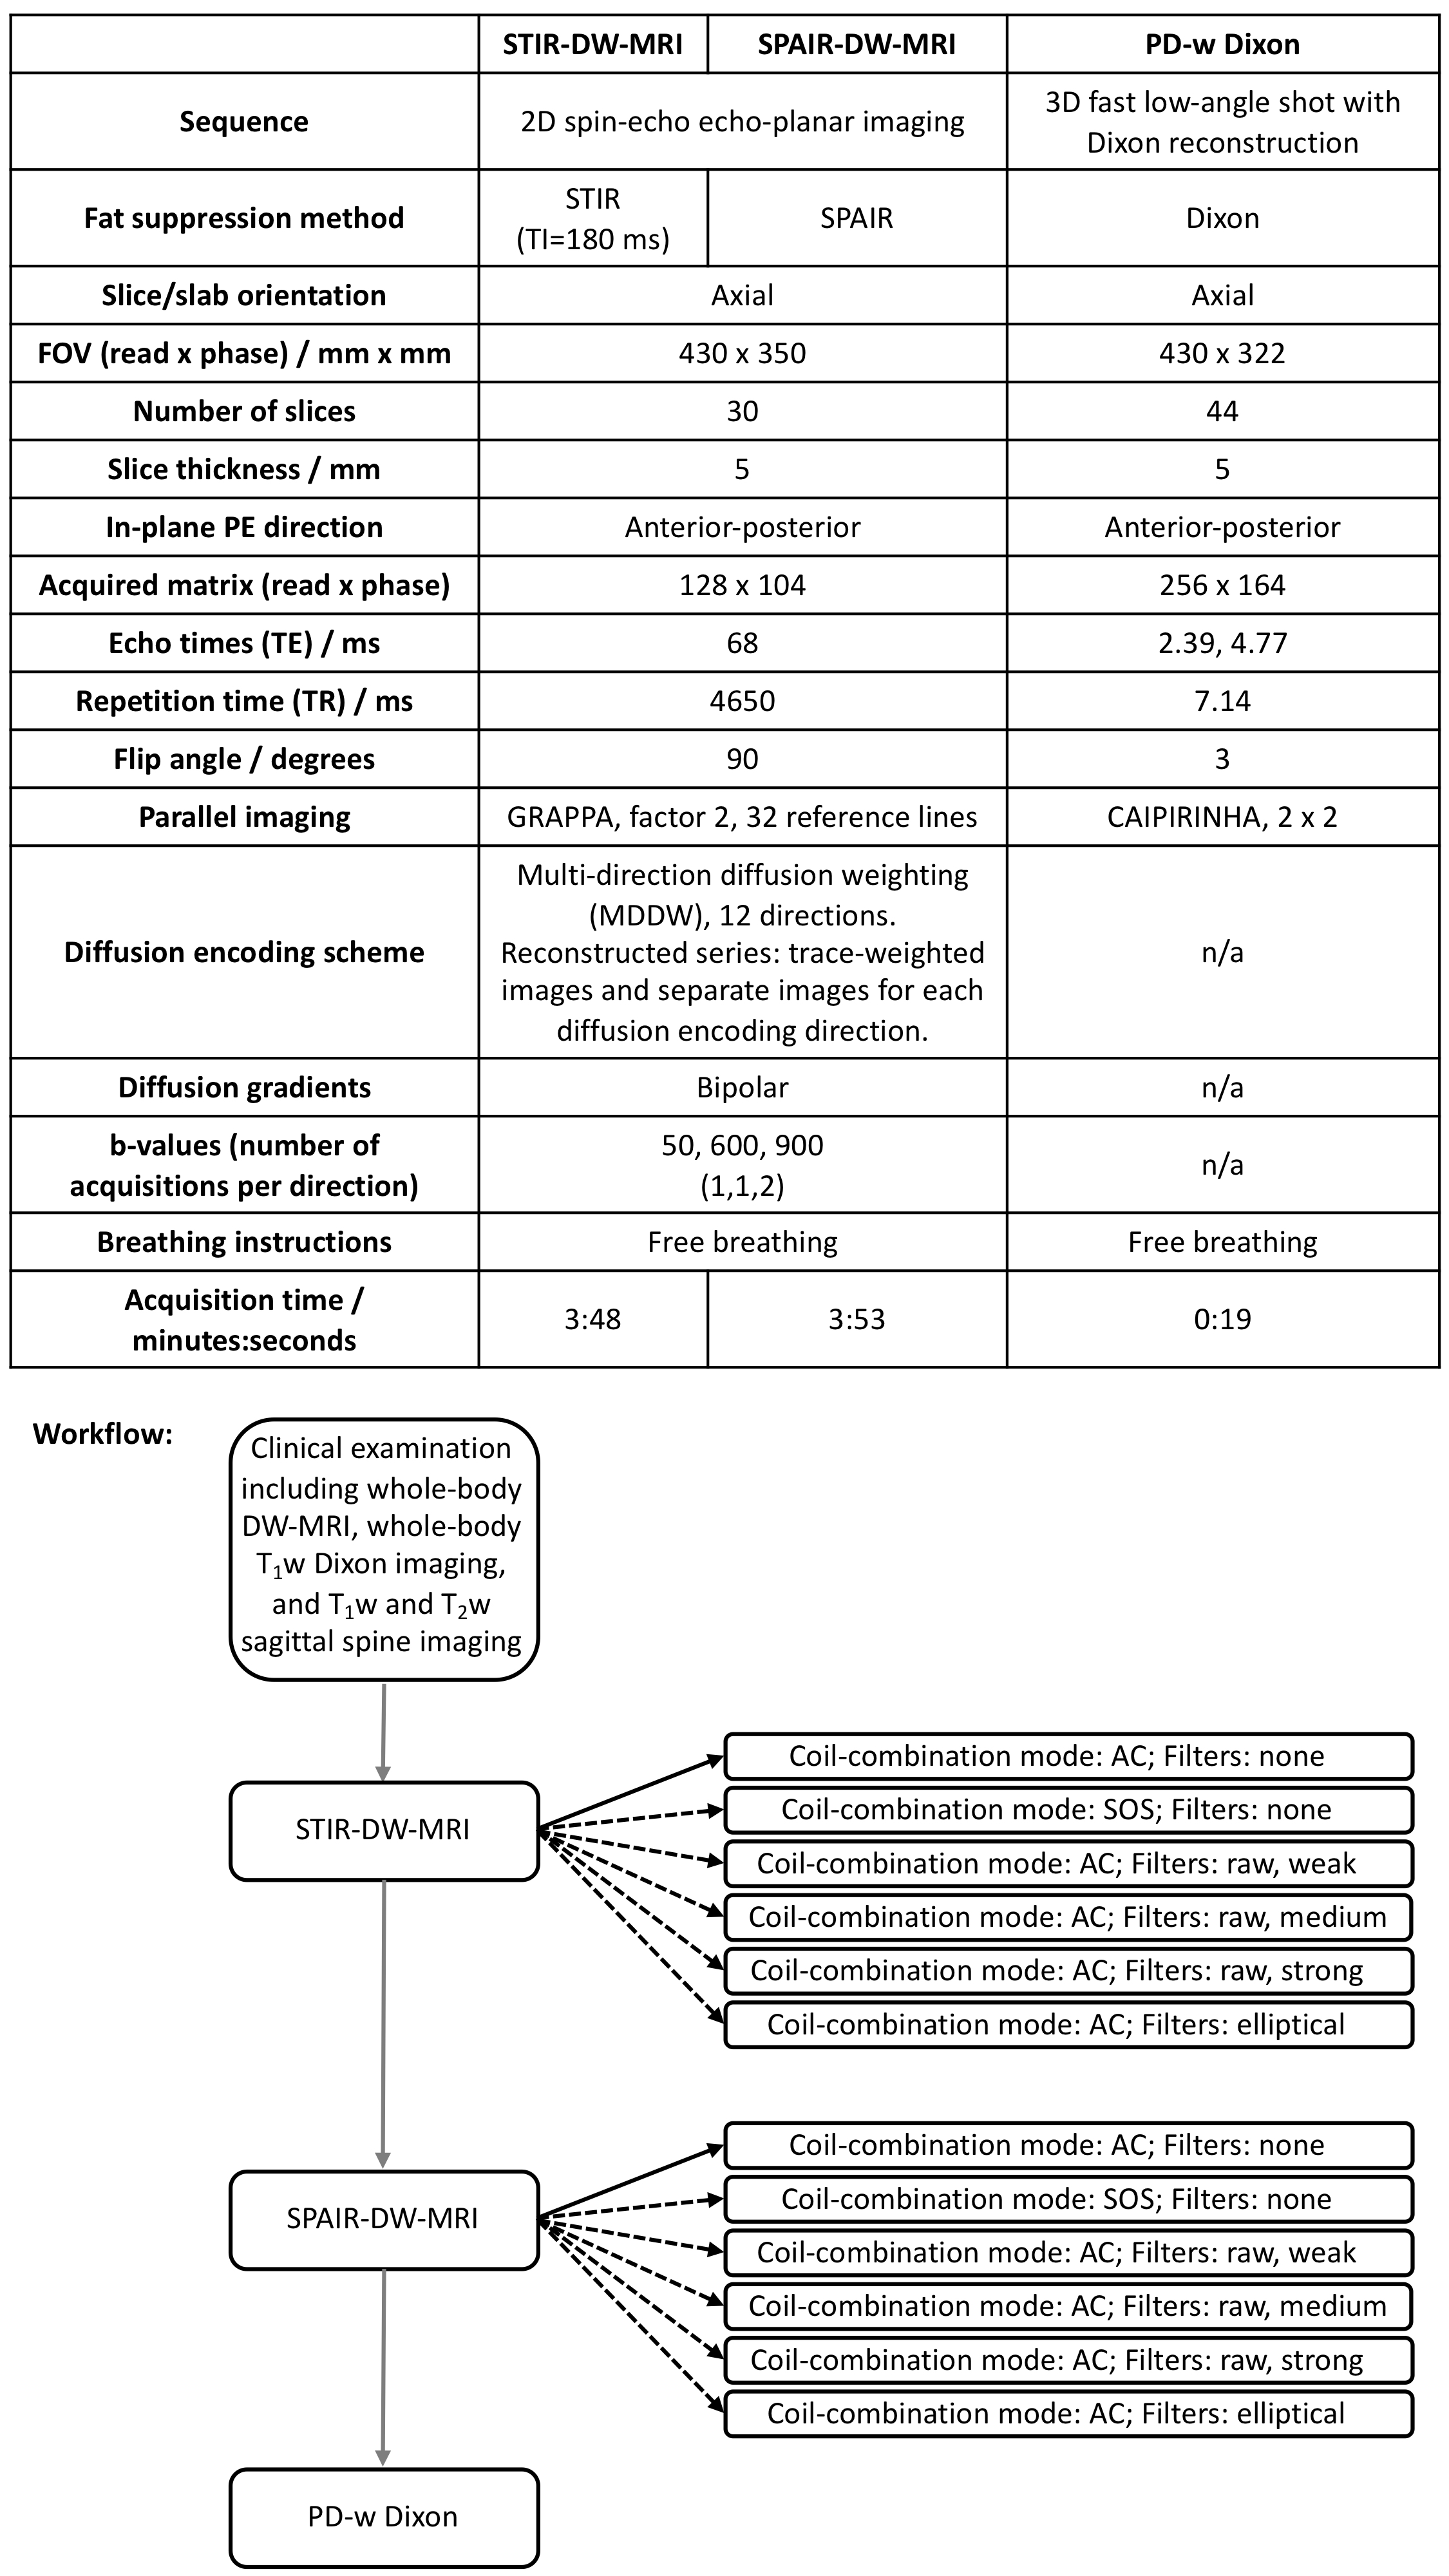
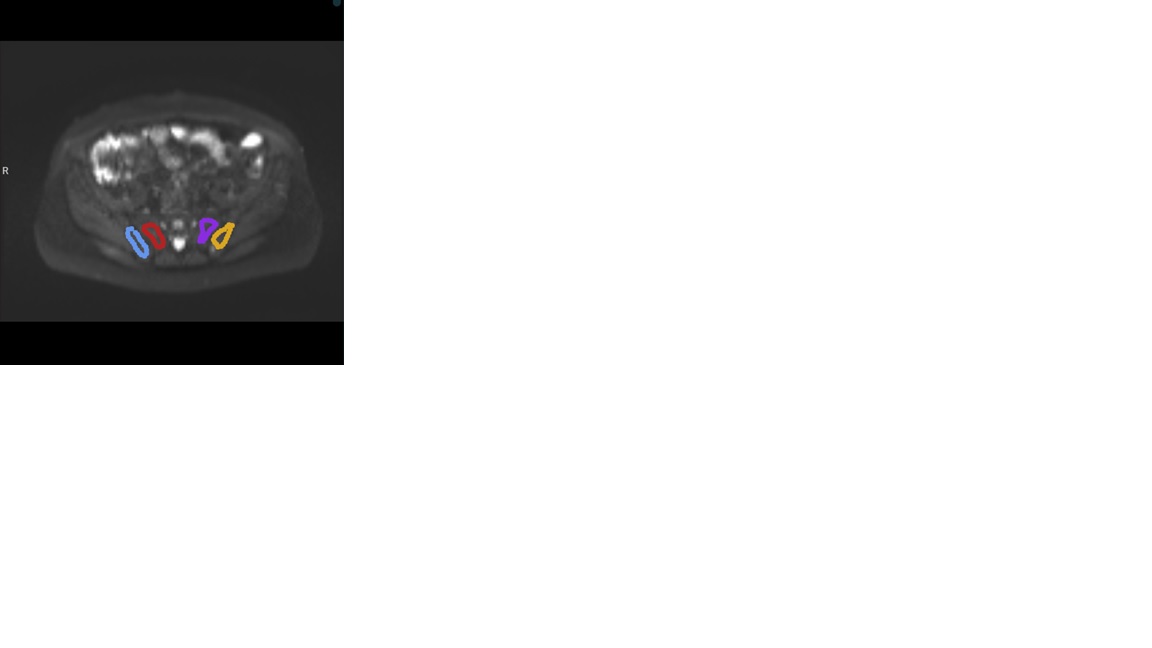
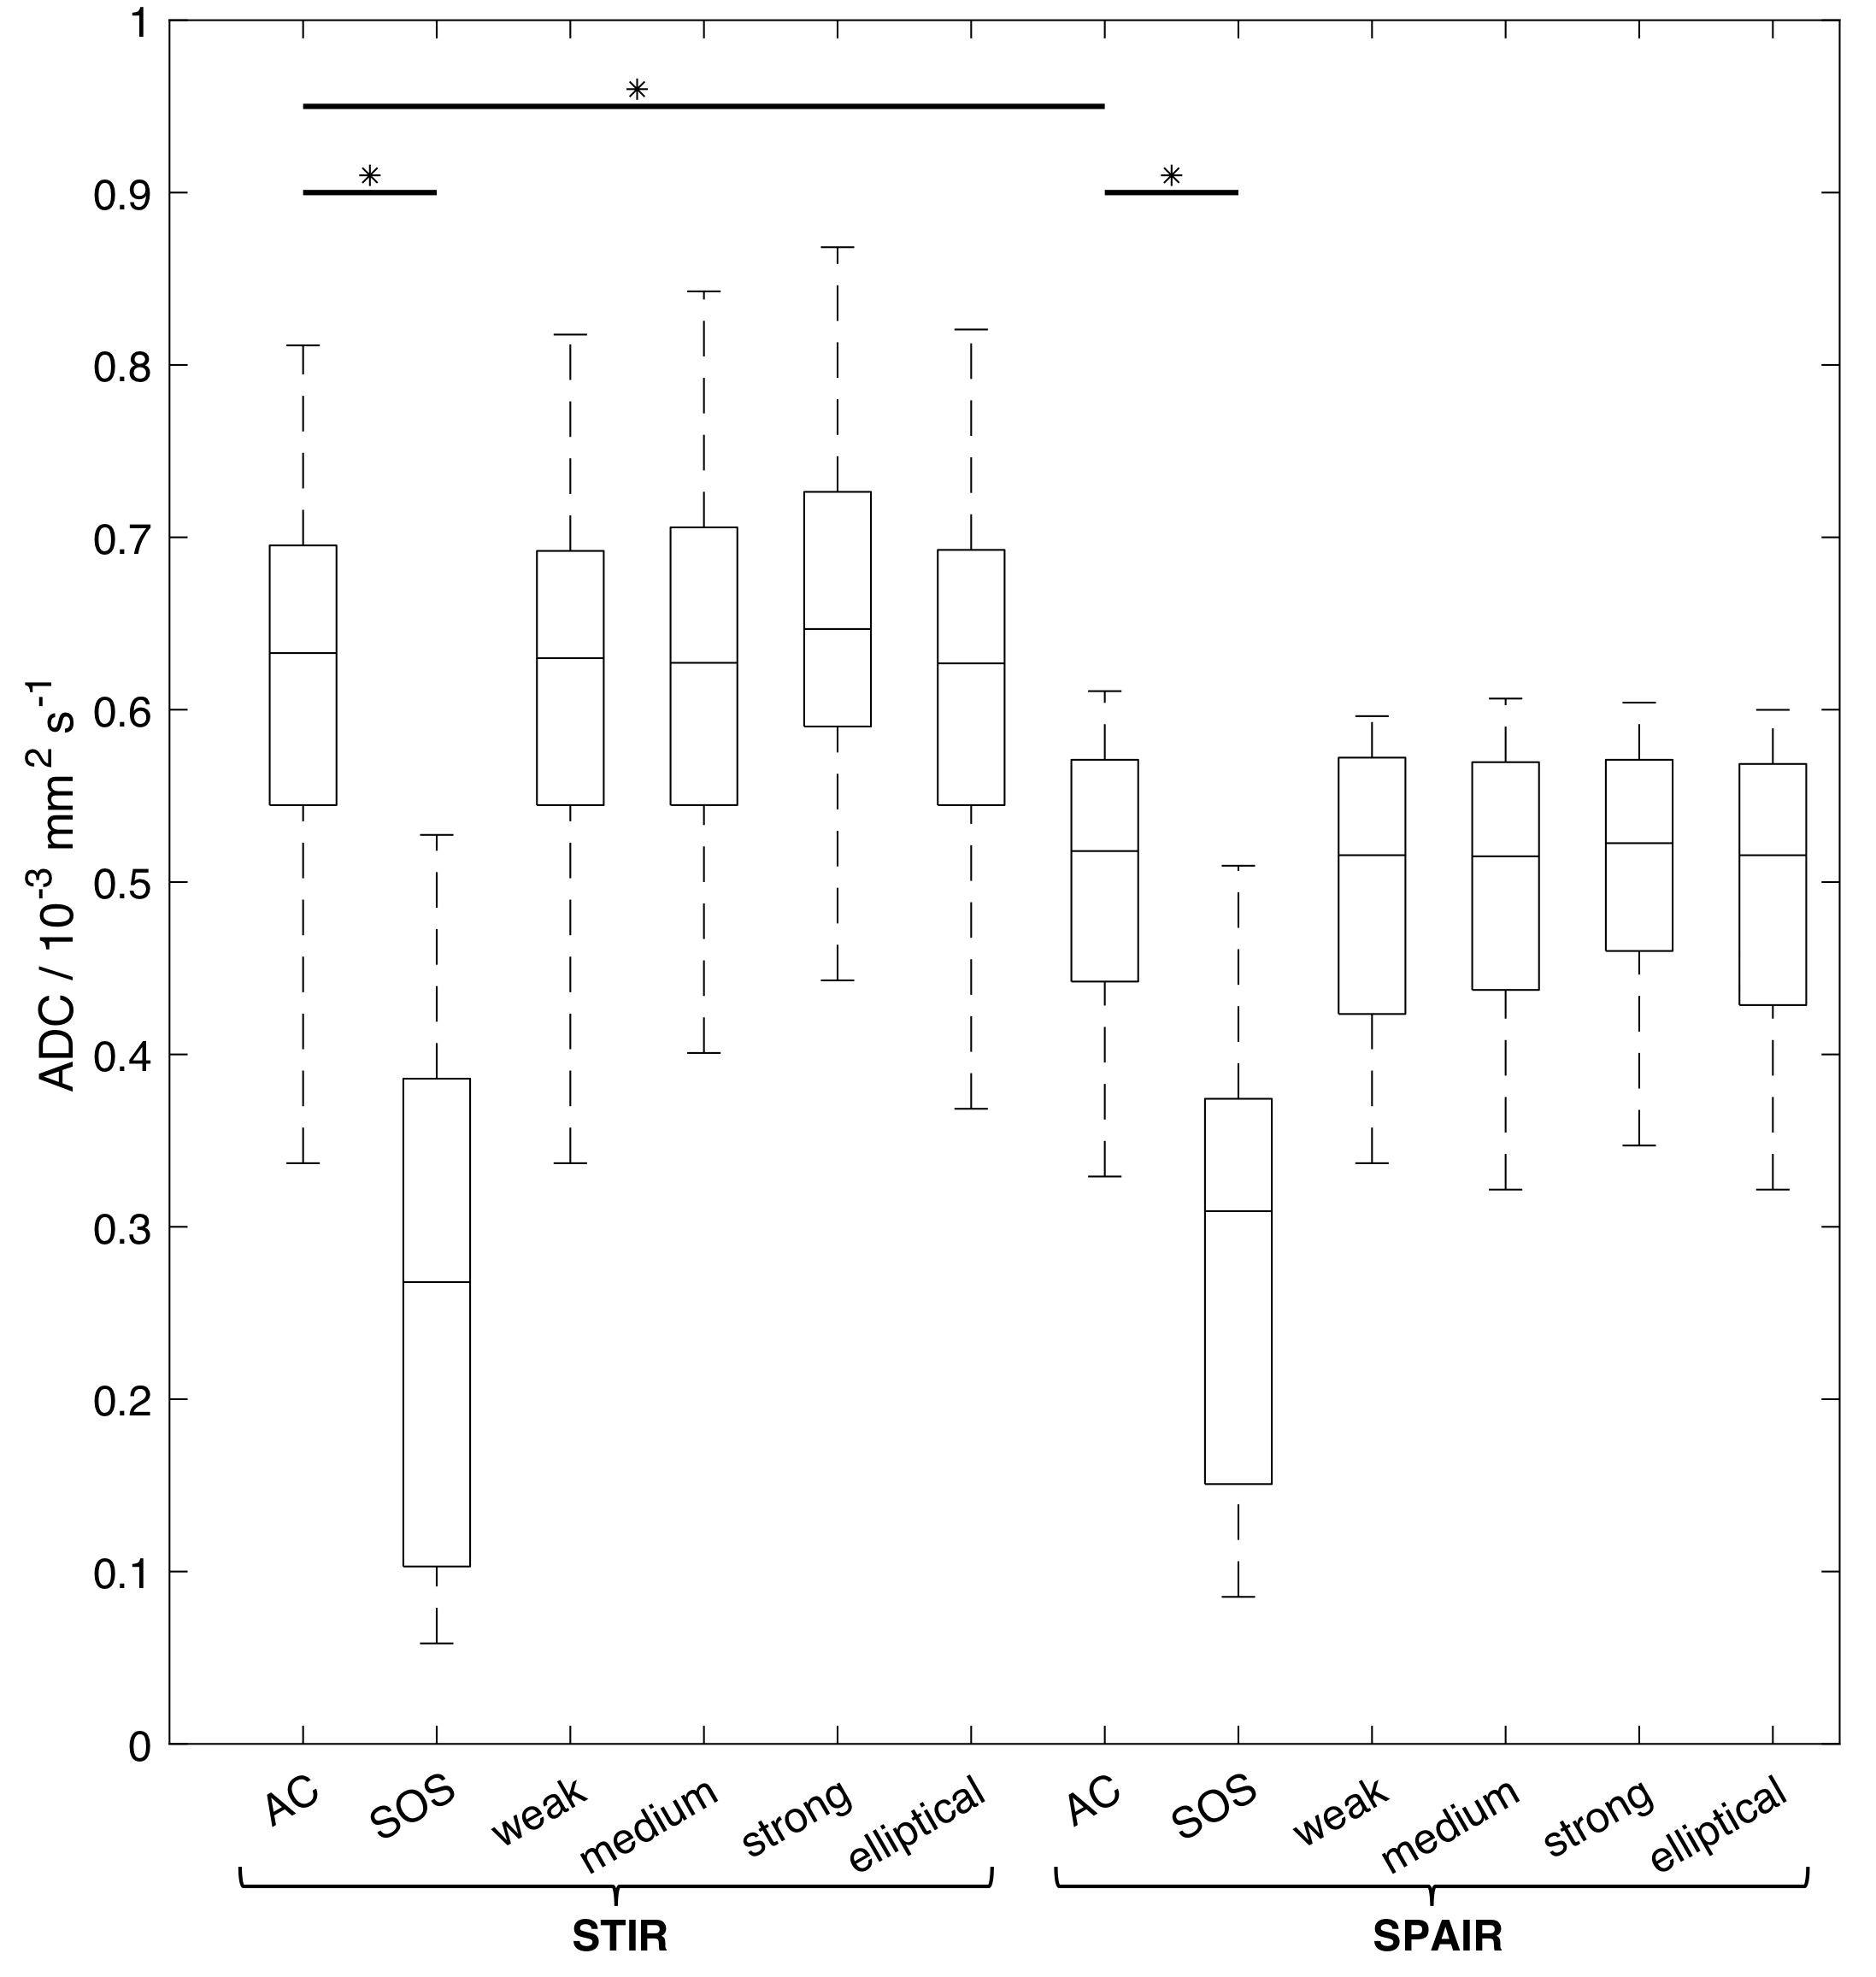
Figure 3: ADC estimates in uninvolved bone marrow in 18 patients. For each patient, the median ADC was calculated from all fitted voxels in the ROIs. Asterisks (*) indicate significant difference between ADC estimates using STIR and SPAIR fat suppression, and between AC and SOS coil-combination modes (p<0.01).
AC= adaptive combine;
SOS = sum-of-squares;
weak = AC with weak raw filter;
medium= AC with medium raw filter;
strong= AC with strong raw filter;
elliptical= AC with elliptical filter.
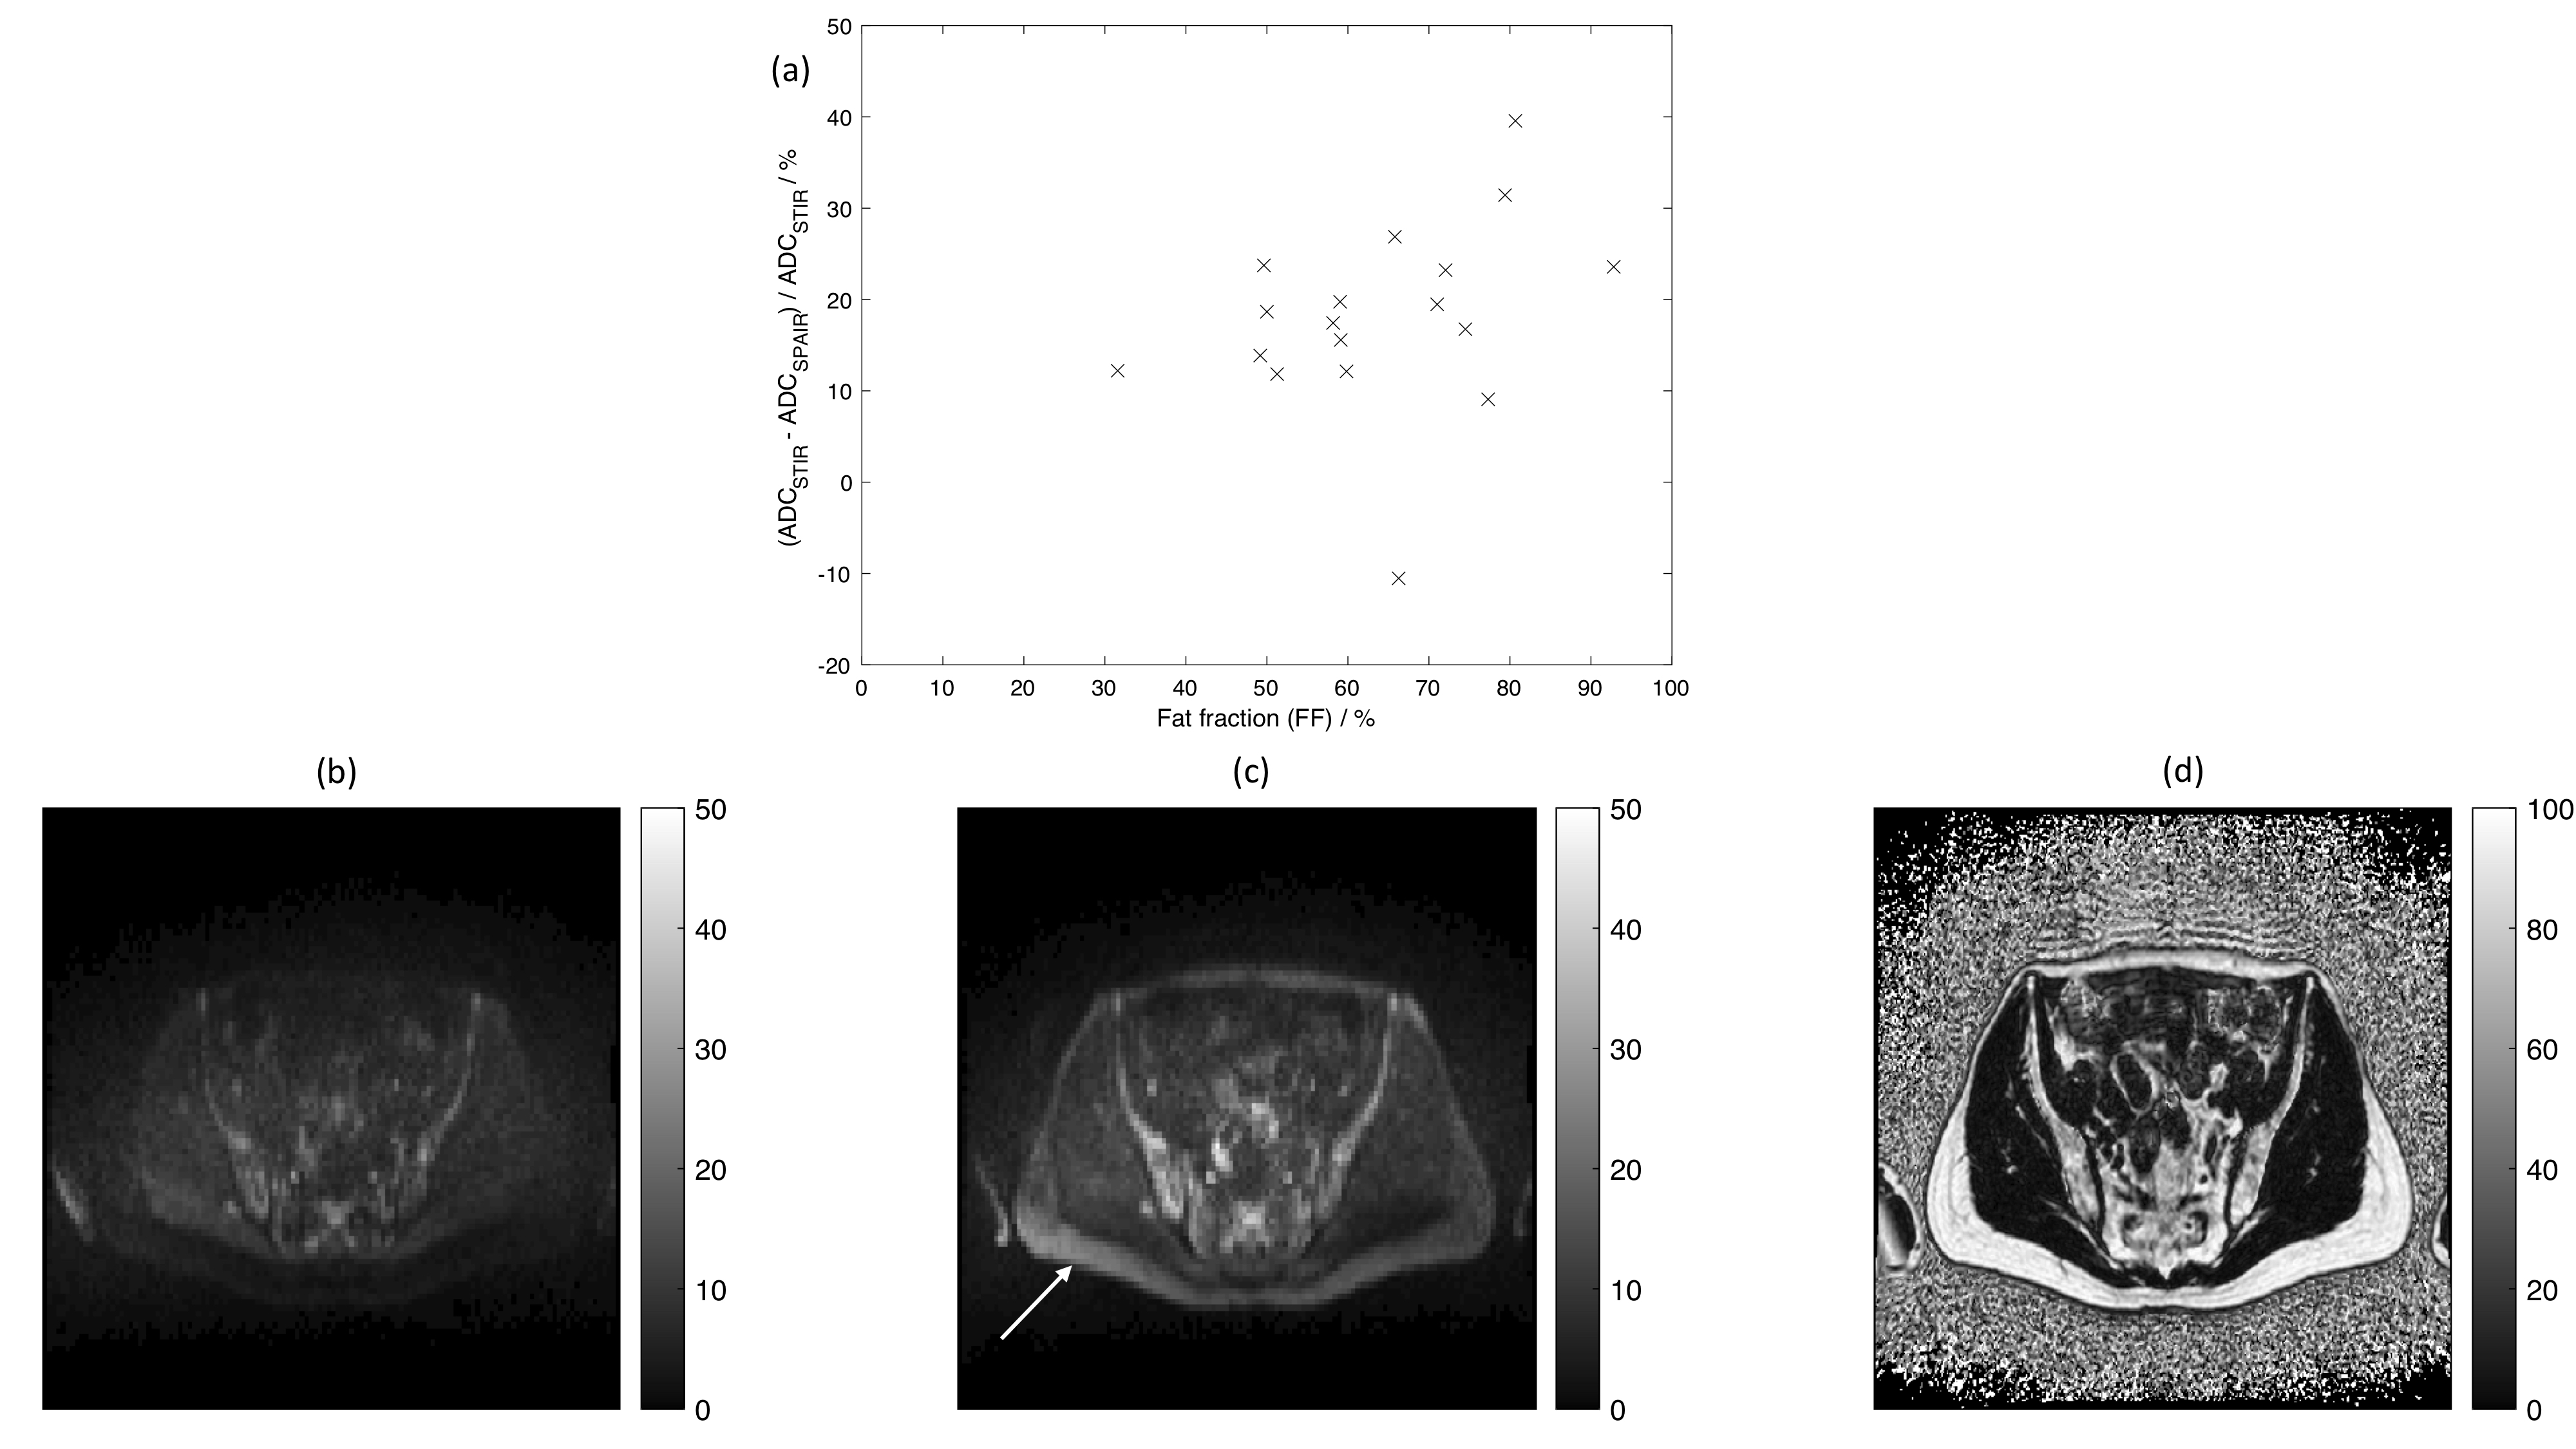
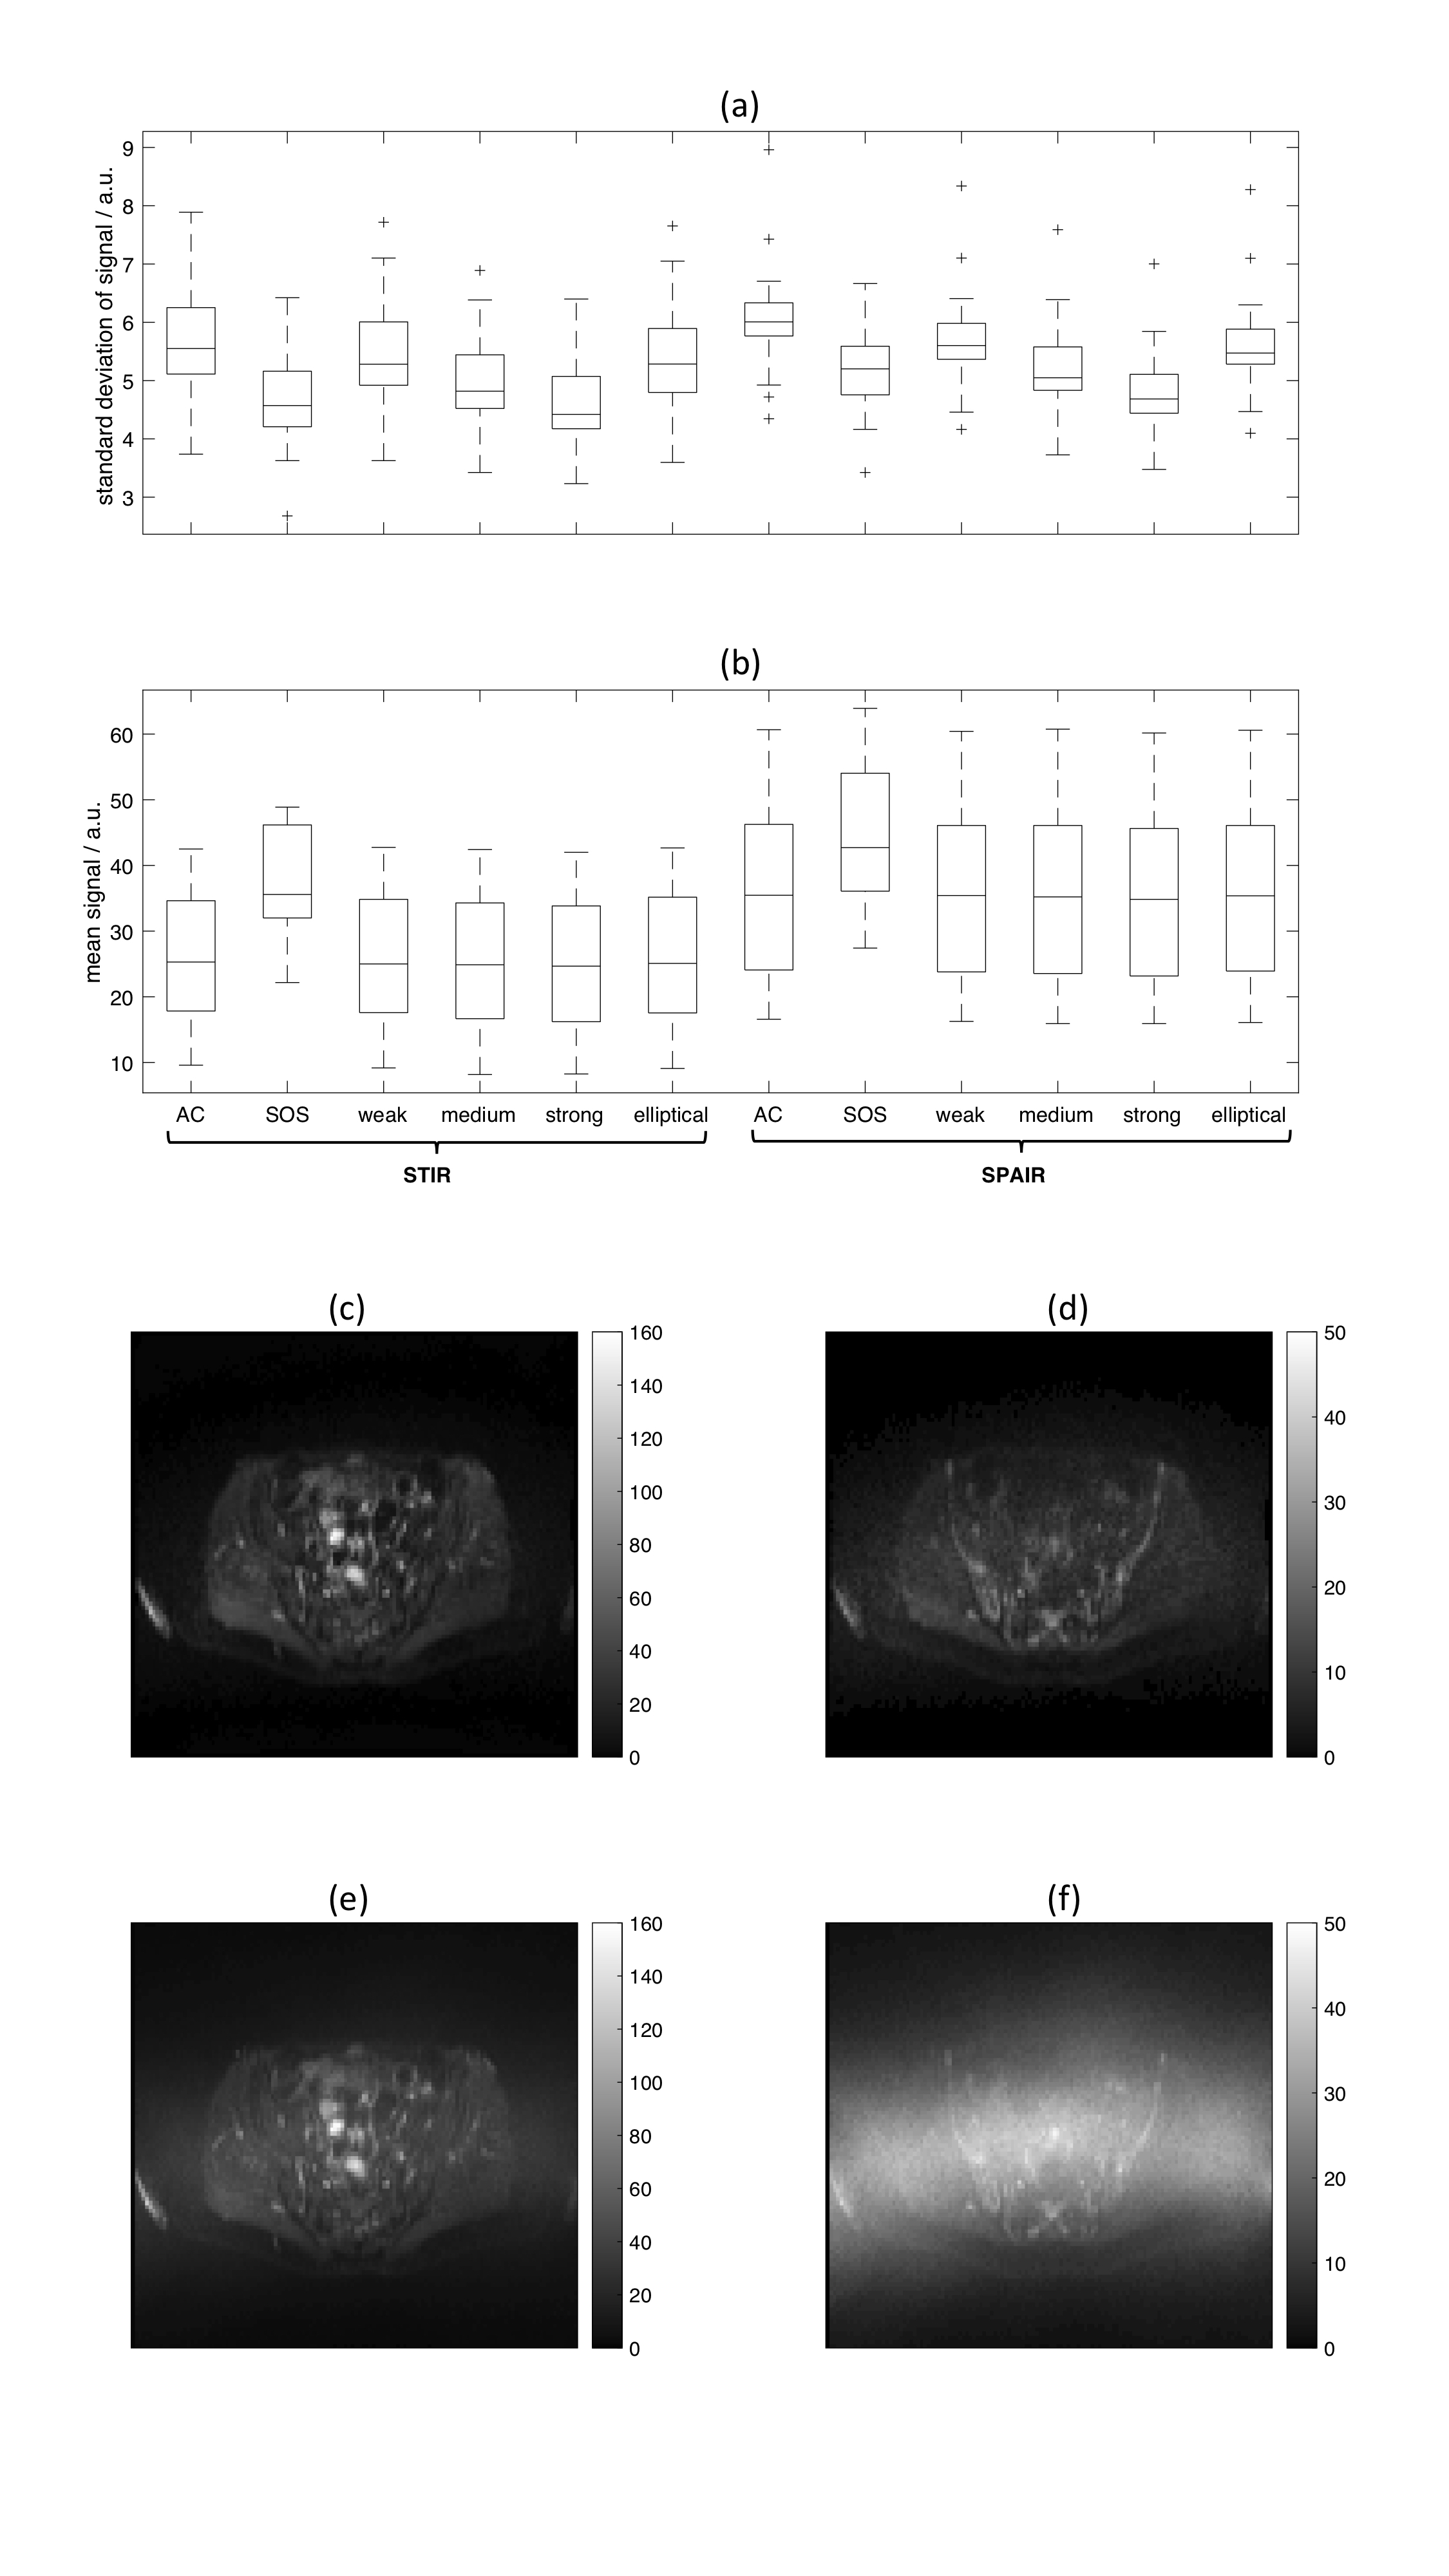
Figure 5: (a) Standard deviation and (b) mean of signal in b=50smm-2 DW-MRI in 18 patients. Standard deviation and mean were assessed for each voxel in the ROIs (12 separate diffusion-weighted images per slice location). Boxplots show medians for all voxels in ROIs for each patient.
(c-f) Images in one patient using STIR-DW-MRI showing (c,e) b=50smm-2 and (d,f) b=900smm-2 images reconstructed using (c,d) AC and (e,f) SOS coil-combination modes. The large central band of noise visible in (e) and (f) may mean that standard deviation is not an appropriate measure of noise in the SOS images.