2838
Development of a scan-specific quality control acquisition for clinical whole-body MRI (WB-MRI) protocols
Sam Keaveney1, Georgina Hopkinson1, Erica Scurr1, Maria-Alexandra Olaru2, David Collins1, Christina Messiou1, Dow-Mu Koh1, and Jessica Winfield1
1Royal Marsden Hospital & Institute of Cancer Research, Sutton, United Kingdom, 2Siemens Healthcare Ltd., Frimley, Camberley, United Kingdom
1Royal Marsden Hospital & Institute of Cancer Research, Sutton, United Kingdom, 2Siemens Healthcare Ltd., Frimley, Camberley, United Kingdom
Synopsis
A short quality control acquisition was developed to detect hardware issues and receiver coil positioning errors in whole-body MRI (WB-MRI). Individual coil element images were reconstructed to investigate potential broken elements and coil positioning was assessed by comparison with images acquired using the integral body coil.
This approach was implemented in a group of healthy volunteers and patients with myeloma and successfully identified a previously undetected broken coil element. The expected signal difference between coil array and integral body coil images was defined and deviation from this expected profile was used to distinguish images acquired with deliberately imperfect coil set-ups.
Introduction
Whole-body MRI (WB-MRI), comprising diffusion-weighted imaging (DWI), Dixon fat/water imaging, and sagittal T1/T2 weighted spine imaging, is recommended for imaging patients with myeloma1 and prostate cancer2. Phantom-based quality assurance (QA) is used routinely; however, it would be advantageous to also monitor image quality using data acquired during clinical examinations3. This could help to detect hardware issues before routine QA scans and identify low image quality in multi-centre imaging trials.This work has developed a rapid quality control (QC) acquisition to be added to the clinical WB-MRI protocol to detect hardware issues such as faulty radiofrequency (RF) receiver coils and to identify errors in patient set-up, such as incorrectly positioned receiver coils.
Methods
Volunteer and patient studies were approved by an Institutional Review Board. All volunteers gave written informed consent and all patients gave verbal informed consent.Ten healthy volunteers (male/female: 6/4, mean age=32.7years ±6.8years) were scanned on a MAGNETOM Aera 1.5T (Siemens Healthcare, Erlangen, Germany) using a single-slice coronal gradient echo sequence with six contiguous stations, TR=50ms, TE=3.37ms, slice thickness=10mm, and image resolution=4.7mmx4.7mm. The coil set-up was according to the MY-RADS guidelines1, comprising a head/neck coil, two body matrices (A and B) and a peripheral angiography coil.
Images were acquired using the automatically selected coil elements (saving each individual element image) and repeated using only the integral body coil; total acquisition time was 82s. To simulate the effects of imperfect positioning, volunteer acquisitions were repeated with the body matrices rearranged as follows (as illustrated in Figure 1A):
- 2cm overlap between the two body matrices (the recommended clinical set-up)
- No overlap
- 2cm gap
- 5cm gap
- Lower body matrix (B) placed on padding to raise away from the subject (replicating a coil with reduced signal)
To assess this approach in a clinical population, the same acquisitions as for the volunteers were added to the clinical WB-MRI protocol for ten patients with myeloma.
Figure 1B describes the processing and analysis, which aimed to identify individual elements that are recording very low signal and regions of high difference between the combined and integral body coil images. The expected 1D profile of signal difference was defined using the ideal set-up volunteer and patient scans, with significant deviations identified using the principles of Shewhart charting4.
Results
For the first five subjects, one coil element (BB34 from Body Matrix B) gave an SBR ratio of less than 0.001 for all set-ups. Figure 2 illustrates the WB set-up and images from selected individual elements and the coil array.The manufacturer’s QA routine was performed on Body Matrix B and the coil was replaced when element BB34 was found to be outside of the specifications. All other receiver coils passed the manufacturer’s QA during this study. Following the coil replacement, no individual element image was below the SBR threshold for more than one consecutive scan.
Figure 3 illustrates the effect of the imperfect coil set-ups. Figure 4 shows the mean difference signal profile for scans following the coil replacement, and the expected profile. Figure 5 shows the percentage of image rows where the mean difference signal exceeded the expected range for the profiles shown in Figure 4A-E.
The number of rows outside of the expected profile exceeded 5% for 0%, 0%, 20%, 60%, and 100% of volunteers for each set-up respectively. For patient scans, the mean percentage of image rows outside of the expected range was 3.9% (±2.8%), with 30% of patients exceeding 5%.
Discussion
Decreased signal in the region of a failed coil element could potentially obscure subtle pathology; however, phased array imaging may make this effect less apparent. Individual coil element image reconstruction is recommended for investigating image quality issues5 but is not routinely performed for clinical imaging.Persistently low signal from an element indicates a potential hardware issue and it is proposed that three consecutive instances should be investigated. This approach identified a broken coil element, which would have otherwise likely remained undetected until the coil’s next routine QA scan.
Images acquired with the integral body coil were used to assess coil positioning. The deliberately imperfect set-ups 4 and 5 resulted in substantial DWI anterior signal loss and it would be useful to identify similar issues in routine clinical examinations or clinical trial data.
It is proposed that greater than 5% of image rows outside of the expected signal difference range indicates a potential coil positioning issue, based on images acquired with with deliberately imperfect set-ups. This work was conducted using a single scanner although future work will implement this approach with a range of models and manufacturers.
This project has demonstrated the use of a WB-MRI QC acquisition for detecting broken coil elements outside of the routine QA schedule and identifying coil positioning errors. With an acquisition time of less than 90 seconds, it is practical to add this acquisition to the clinical WB-MRI protocol and work is ongoing to implement this more widely.
Acknowledgements
We acknowledge funding from Cancer Research UK National Cancer Imaging Translational Accelerator (NCITA) and Engineering and Physical Sciences Research Council support to the Cancer Imaging Centre at the Institute of Cancer Research and Royal Marsden Hospital in association with the Medical Research Council and Department of Health C1060/A10334, C1060/A16464 and National Health Service funding to the National Institute for Health Research Biomedical Research Centre, Experimental Cancer Medicine Centre, the Clinical Research Facility in Imaging, and the Cancer Research Network. The views expressed in this publication are those of the author(s) and not necessarily those of the National Health Service, the National Institute for Health Research or the Department of Health.References
- Messiou, C., Hillengass, J., Delorme, S., Lecouvet, F.E., et al., Guidelines for acquisition, interpretation, and reporting of whole-body MRI in myeloma: myeloma response assessment and diagnosis system (MY-RADS). Radiology, 2019. 291(1): p. 5-13.
- Padhani, A.R., Lecouvet, F.E., Tunariu, N., Koh, D.-M., et al., METastasis reporting and data system for prostate cancer: practical guidelines for acquisition, interpretation, and reporting of whole-body magnetic resonance imaging-based evaluations of multiorgan involvement in advanced prostate cancer. European urology, 2017. 71(1): p. 81-92.
- Peltonen, J.I., Mäkelä, T., and Salli, E., MRI quality assurance based on 3D FLAIR brain images. Magnetic Resonance Materials in Physics, Biology and Medicine, 2018. 31(6): p. 689-699.
- Simmons, A., Moore, E., and Williams, S.C., Quality control for functional magnetic resonance imaging using automated data analysis and Shewhart charting. Magnetic Resonance in Medicine: An Official Journal of the International Society for Magnetic Resonance in Medicine, 1999. 41(6): p. 1274-1278.
- Charles-Edwards, G., Graves, M., and Weir, N., Artefacts, in Quality Control and Artefacts in Magnetic Resonance Imaging IPEM report 112., McRobbie, D.W., Editor. 2016, Institute of Physics and Engineering in Medicine: York.
Figures
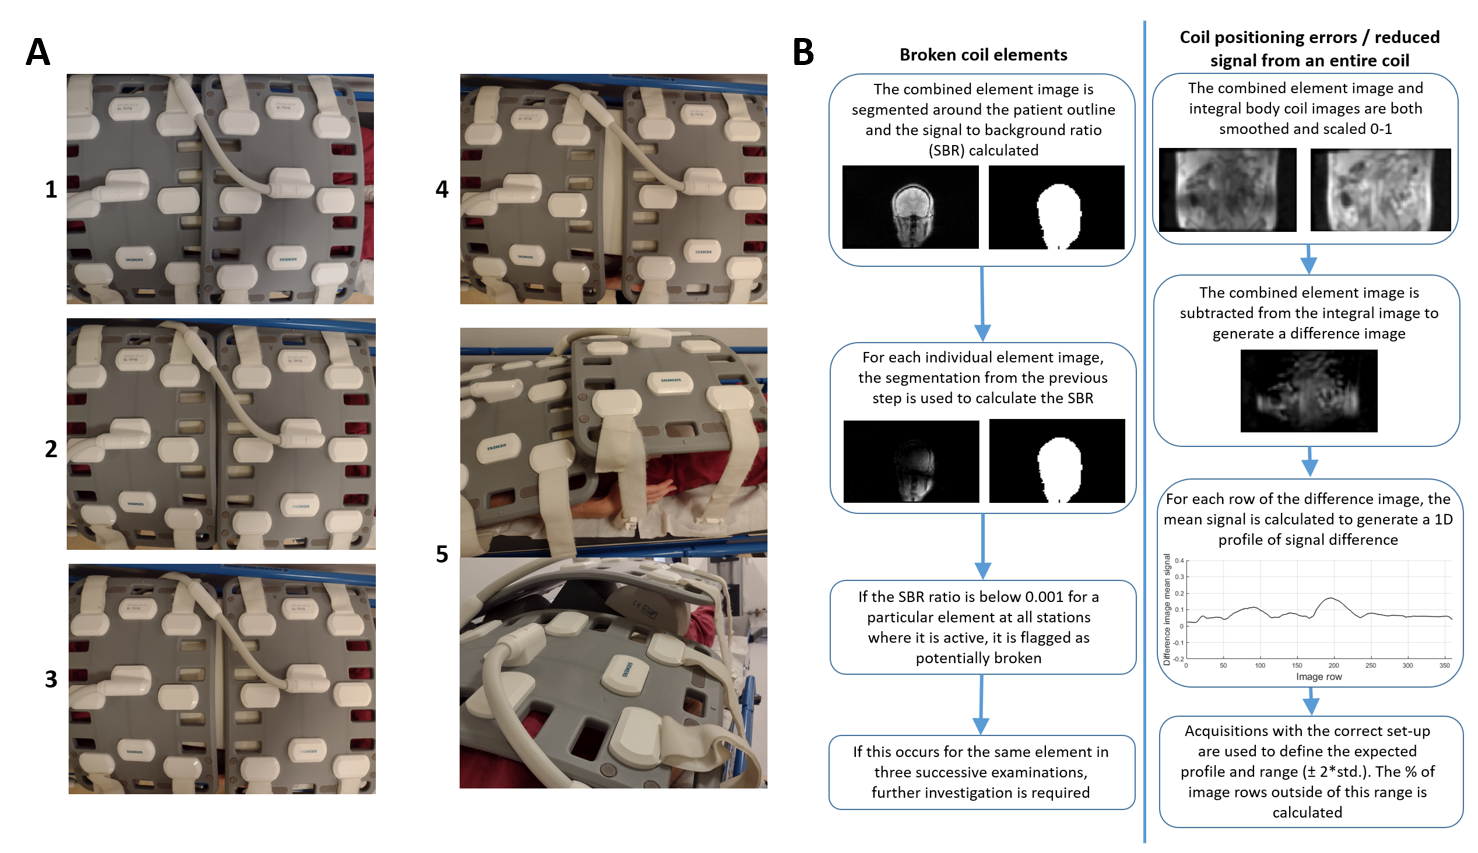
1 - A: Photographs to illustrate the different arrangements of Body Matrices A and B for volunteer scans. Images are numbered according to coil set-up: 1- ideal, 2- no overlap, 3- 2cm gap, 4- 5cm gap, 5- Body Matrix B lifted. B: Description of the analysis pipeline for identifying broken coil elements, coil positioning errors and reduced signal from an entire coil.
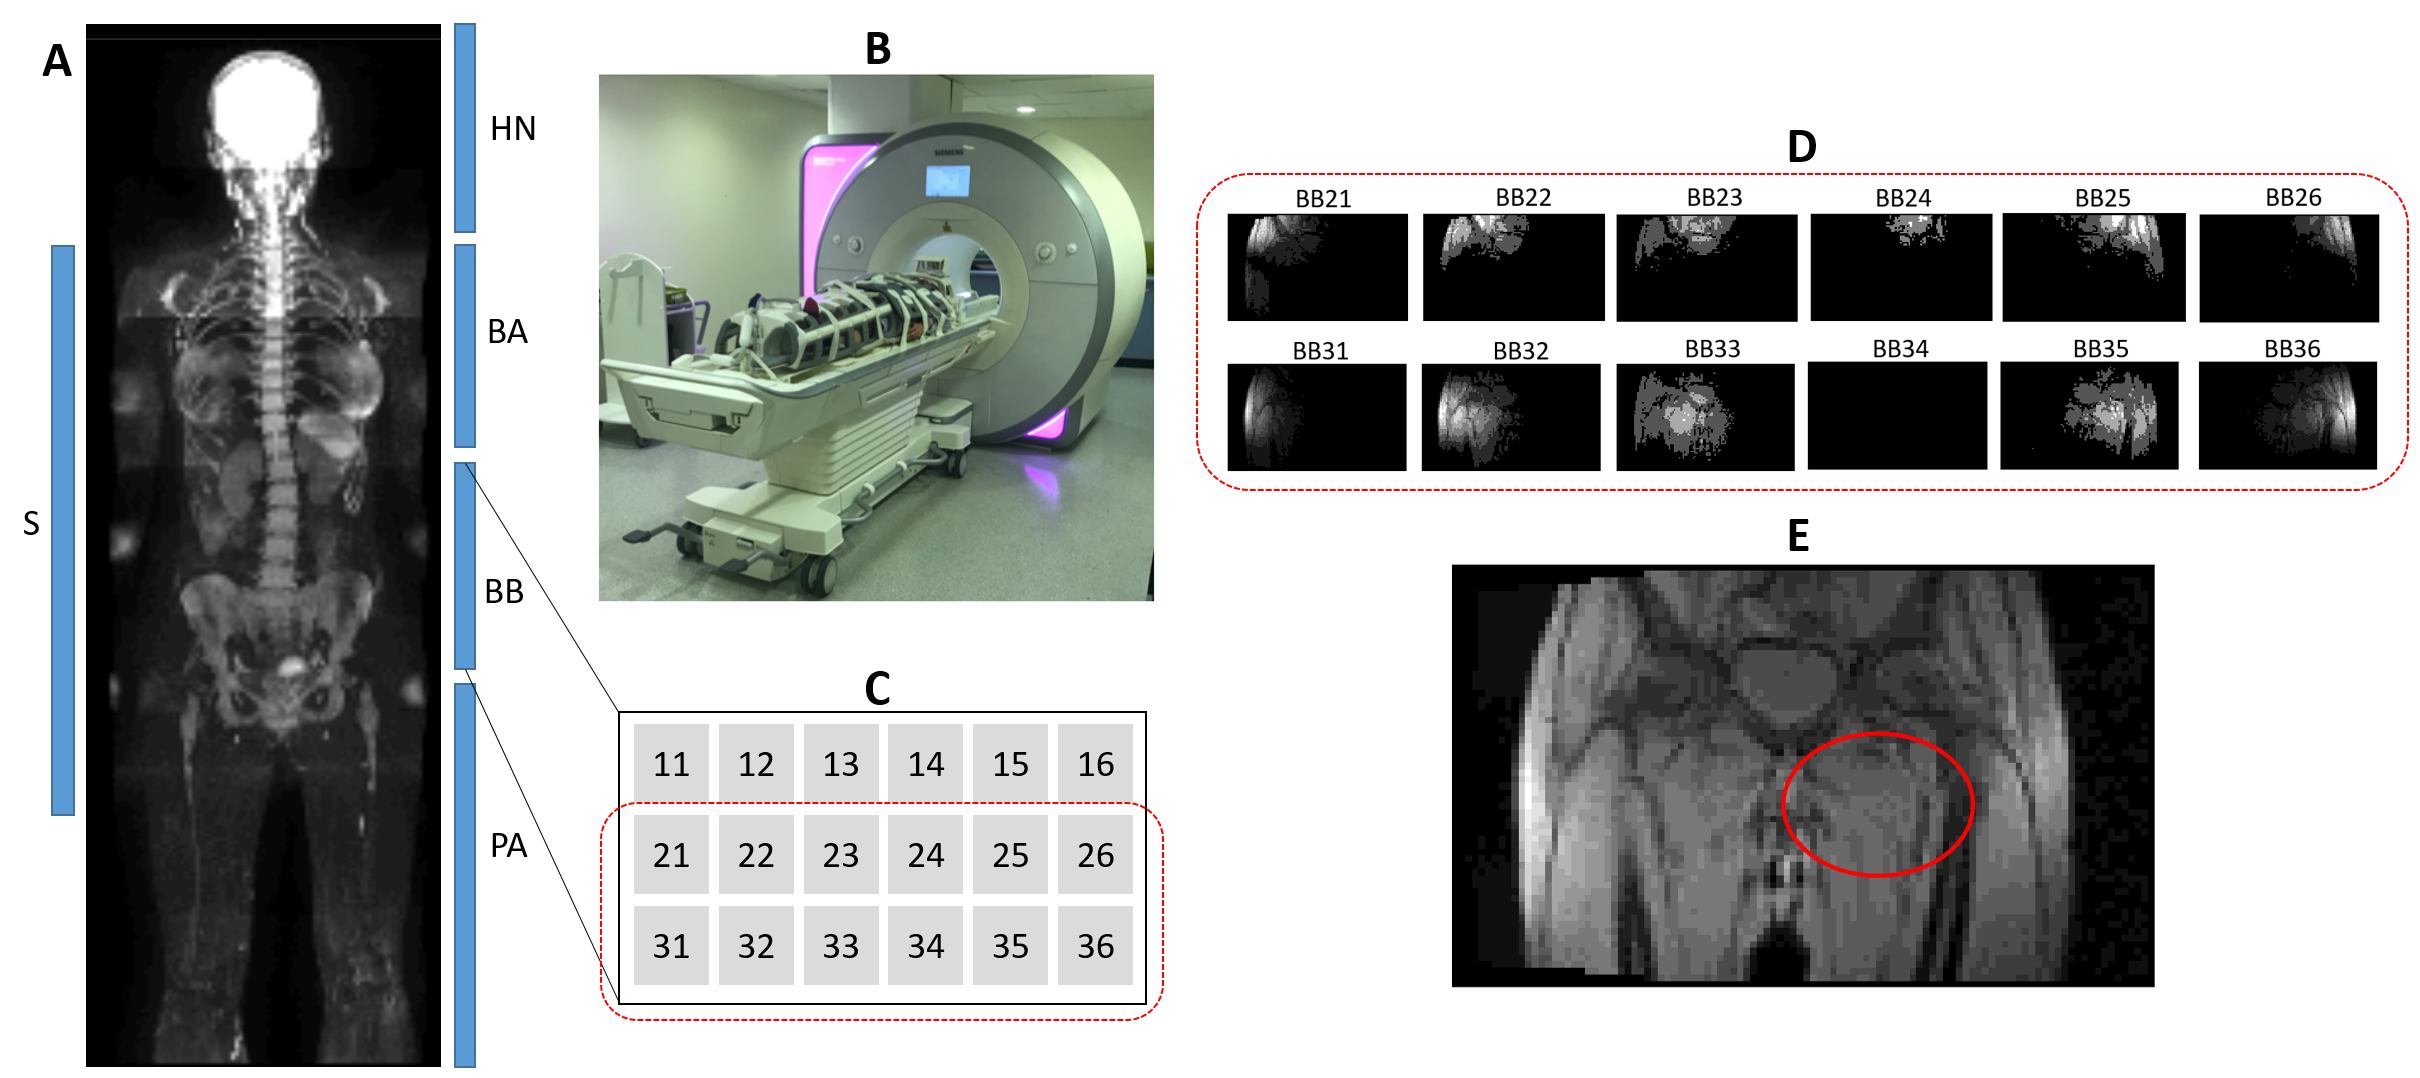
2 - A: Approximate location of coils (S - spine, HN - head & neck, BA/BB - Body Matrix A/B, PA - peripheral angiography) in the WB set-up, shown on a DW b900 maximum intensity projection (MIP) image. B: Photograph illustrating the WB-MRI set-up for a volunteer scan. C: Schematic showing positioning of individual elements for Body Matrix B. D: Individual coil element images for two groups of these elements at a particular station, illustrating low signal from BB34 (i.e. element B34 from Body Matrix B). E: Combined element image, with a red oval indicating the approximate location of BB34.
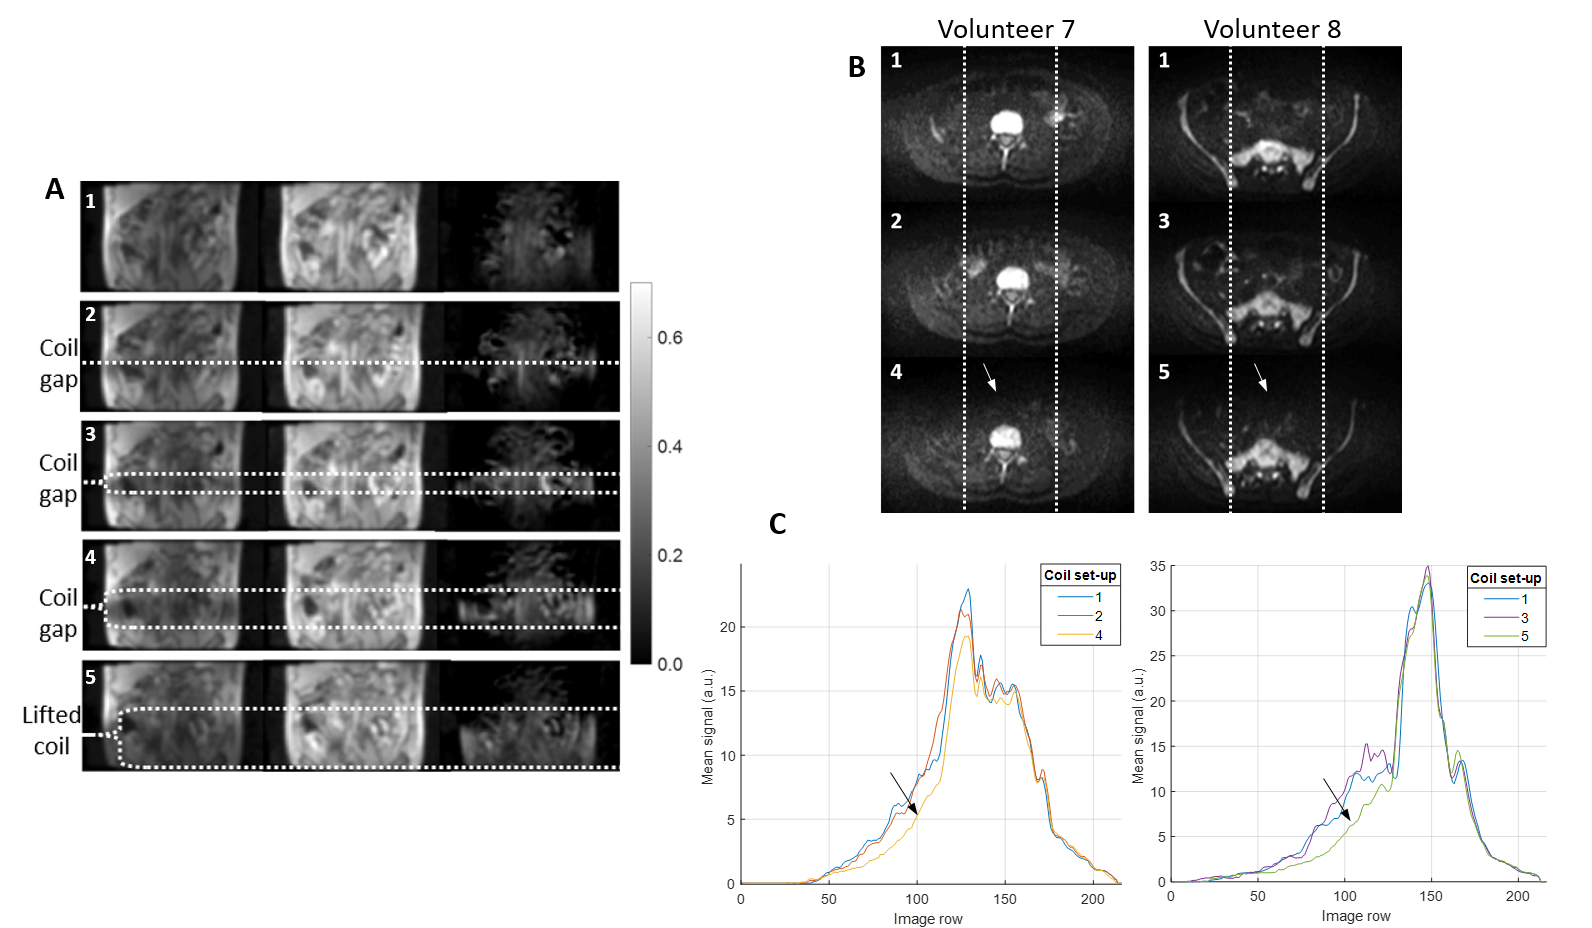
3 - A: Example images illustrating (from left to right) acquisitions with the coil array, the integral body coil and the difference image (integral - array). The scale bar applies to all difference images. Images are numbered according to coil set-up: 1- ideal, 2- no overlap, 3- 2cm gap, 4- 5cm gap, 5- Body Matrix B lifted. B: Example DW b900 images for two volunteers, each with three set-ups. C: Graphs showing the mean signal profile for the central third of the DW images, as indicated by the region between the dotted lines in B. Arrows in B and C indicate the anterior signal loss for set-ups 4 and 5.
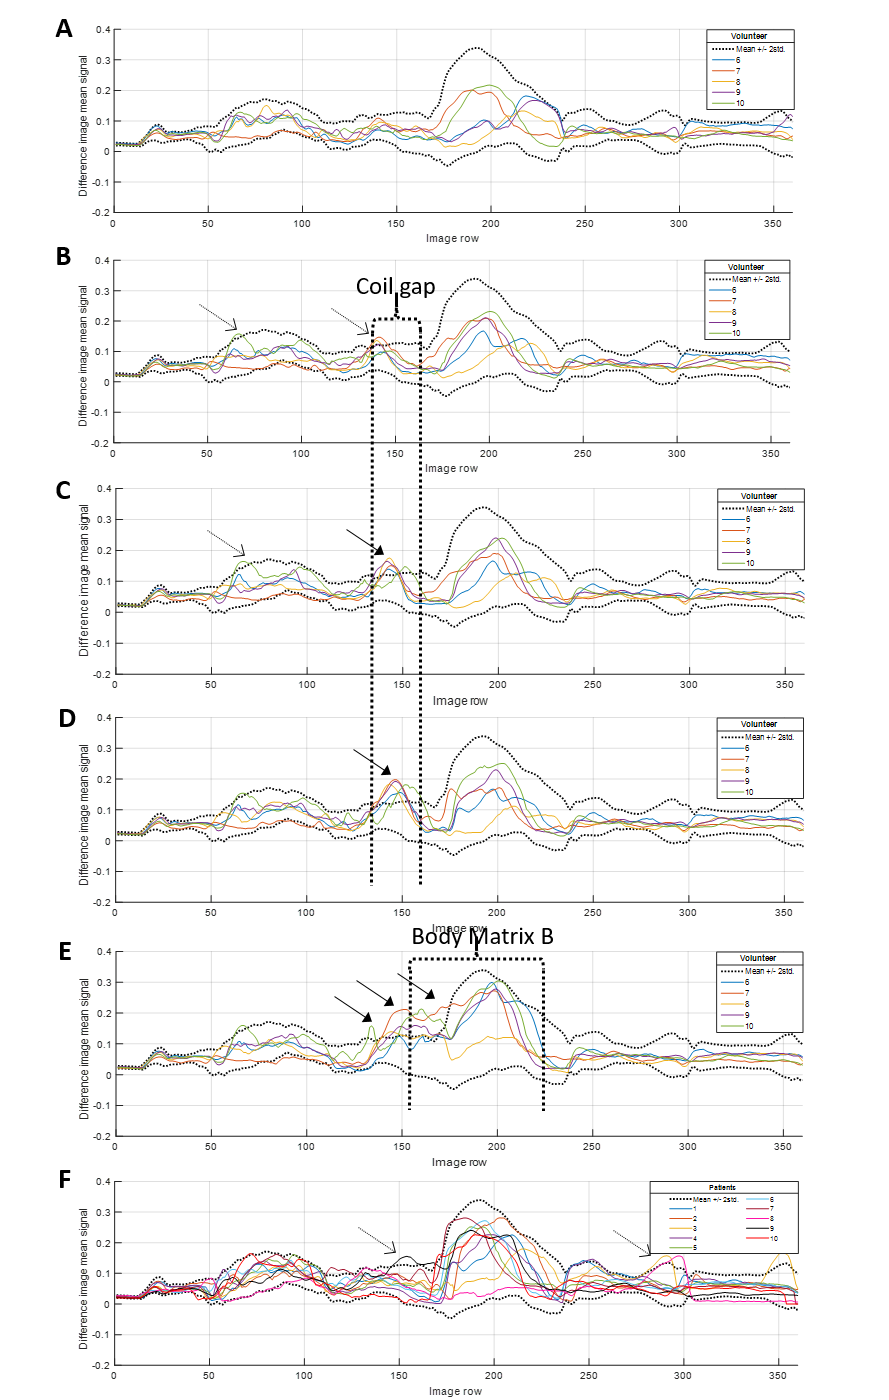
4 - Profiles showing the mean signal for each row of the difference image for the ideal (A), no overlap (B), 2 cm gap (C), 5 cm gap (D) and lifted body matrix (E) volunteer set-ups, and for the patient scans (F). Only scans conducted after the replacement of Body Matrix B are included. The expected profiles (mean +/- 2*standard deviation, calculated using the ideal set-up volunteer and patient data) are indicated on each graph by the black dotted lines. Dashed and solid arrows respectively highlight regions where the profiles occasionally and consistently exceed the expected range.
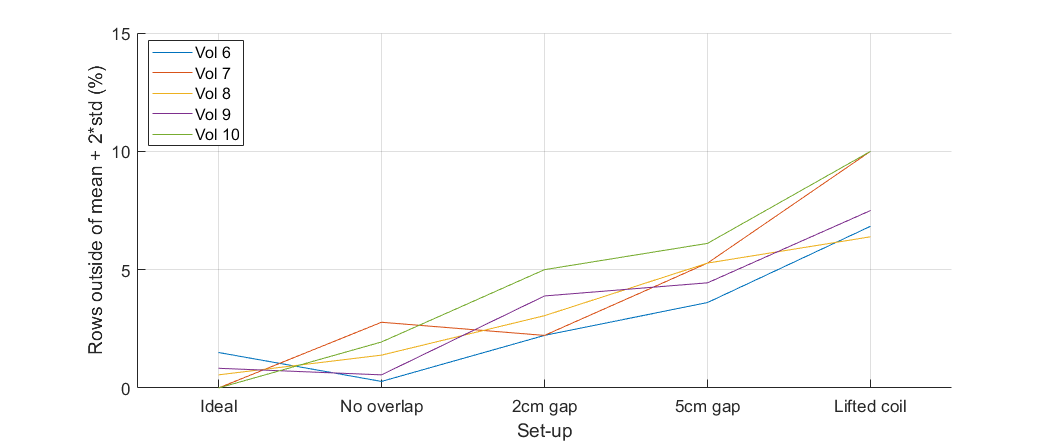
5 - Graphs showing the percentage of image rows where the mean signal difference was greater than the ideal set-up mean + 2*standard deviation, across all set-ups for volunteers scanned after the replacement of Body Matrix B. The mean and standard deviation are calculated using the scans acquired following the replacement of Body Matrix B (volunteers 6 to 10 and all patients).
DOI: https://doi.org/10.58530/2022/2838