2837
Identification of S100 Immunopositivity on T2-weighted MRI Using Deep Learning1Institute of Biomedical Engineering, Bogazici University, İstanbul, Turkey, 2Health Institutes of Turkey, Istanbul, Turkey, 3Department of Medical Pathology, Acibadem Mehmet Ali Aydinlar University, İstanbul, Turkey, 4Center for Neuroradiological Applications and Reseach, Acibadem Mehmet Ali Aydinlar University, İstanbul, Turkey, 5Center for Neuroradiological Applications and Reseach, Acibadem Mehmet Ali Aydinlar University, Istanbul, Turkey, 6Department of Neurosurgery, Acibadem Mehmet Ali Aydinlar University, İstanbul, Turkey, 7Department of Radiology, Acibadem Mehmet Ali Aydinlar University, İstanbul, Turkey, 8Center for Neuroradiological Applications and Reseach Acibadem Mehmet Ali Aydinlar University, Istanbul, Turkey
Synopsis
S100 protein expression is a relevant indicator of prognosis in meningiomas and it is more common in benign meningiomas. To our knowledge, a clinically feasible non-invasive method that preoperatively identifies S100 protein expression is not available. In this study, we proposed registration-free deep learning models to predict S100 expression non-invasively using T2-w MRI. The proposed hybrid deep learning model could predict S100 protein expression in meningiomas using T2-w MRI, with 91% accuracy on the validation set, and 83% accuracy on the test set.
Introduction
Meningiomas are the most common adult brain tumors. S100 protein expression is a relevant indicator of prognosis in meningiomas, and it is more common in benign meningiomas than atypical ones [1-3]. The five-year recurrence rate in grade I meningiomas is 5%, while this rate is 40% in grade II (atypical) meningiomas [4, 5]. Therefore, preoperative detection of S100 might play a significant role in the treatment planning of meningiomas [6]. This study aims to develop a non-invasive and registration-free approach to determine S100 protein expression from preoperative T2 weighted (T2w) MRI using deep learning approaches.Methods
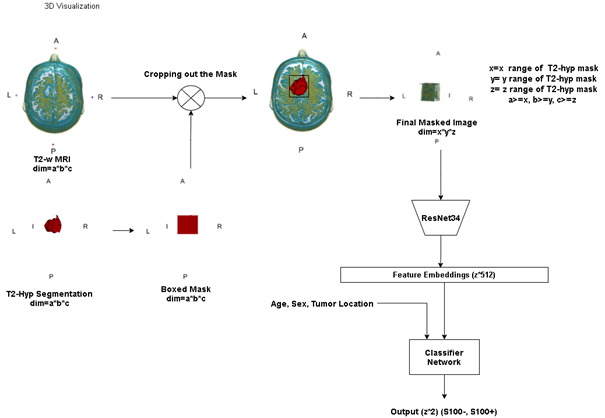
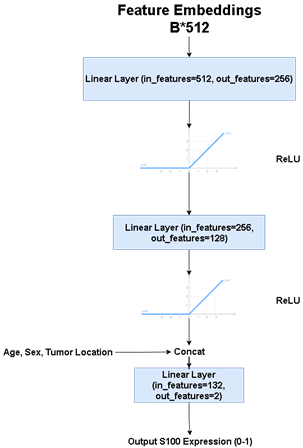
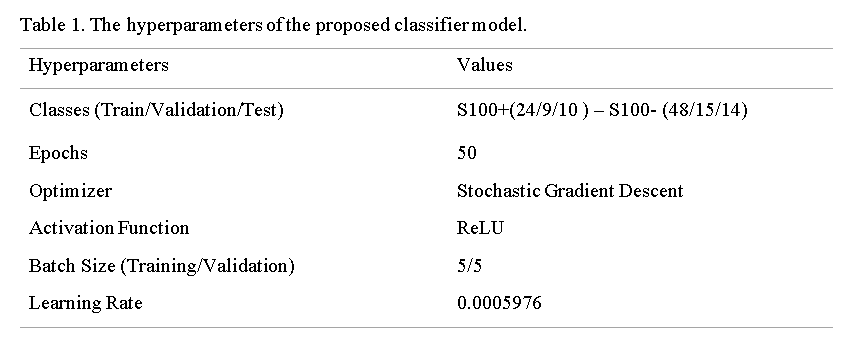
One hundred nineteen meningioma patients (38M/81F, mean age: 51.79±13.57 years, range: 18-86 years, 43 S100 positive (S100+) and 76 S100 negative (S100+)) were retrospectively included in this IRB approved study. The patients were scanned using a brain tumor imaging protocol that included T2w MRI (TR=5000ms, TE=105ms) on a 3T clinical MR scanner (Siemens Healthcare, Erlangen, Germany). Immunohistochemical analysis was performed on tumor samples to detect S100 protein expression. The hyperintense tumor region was manually segmented on T2w MRI using Slicer version 4.8.1 [7], and a cropped region of all the slices containing the tumor were used as the inputs to the deep learning models. A block diagram of the study pipeline is shown in Figure 1. For deep learning approaches, first, fine-tuned pre-trained well-known classifier models (vgg19-16, resnet18-34-50, densenet, efficientnet-b0-1-2-3-4) were used by changing the last linear layer’s output features to two classes for S100+ and S100-. Out of these models, efficientnet-b2 was determined as the most successful model concerning the validation accuracy after hyperparameter optimization. At the second phase, a hybrid model was defined, in which pre-trained resnet34 (chosen by hyperparameter optimization among the models listed above) architecture was used as a feature extractor followed by a classifier produced in this study. Afterwards, min-max normalization was used on each input image to make the model more robust and converge faster at the training stage. Loss penalization was implemented to overcome the imbalanced dataset problem [8]. Also, regularization and image augmentation methods, such as rotation, vertical/horizontal flipping, and random erasing were implemented to overcome the overfitting problem. Weight and Biases [9] (wandb) was used for hyperparameter optimization and performance visualization in this study. For enhancing the model performance we inserted normalized age (divided by 100), tumor location (calvarial, skull base), and sex (one-hot-encoded) as extra features to the last linear layer of the classifier. Table 1 shows the hyperparameters of the proposed model, which were determined by wandb while maximizing the validation accuracy. The classifier model architecture and details are shown in Figure 2. Three different metrics, which were the majority voting (MV), single slice positivity, and slice-wise, were implemented to assign a final S100 protein expression status to the patients, which were then used to calculate the model accuracy. Majority voting was defined as,$$ out label= (1/N ∑N argmax(output_i)) >0.5, $$
where output (N*c) is the two-class model output, N is the number of slices for a given patient, the target is the ground truth class for S100 (1 or 0), and the out label (1 or 0) is the result of the model for a given patient by taking into account all the slices. The single slice positivity was defined as,
$$ out label=max(argmax(output)), $$
which assigns 1 to the output label even if one of the slices is marked as positive for a given patient. In the slice-wise metric, each slice is treated independently, and its S100 status is assigned as a result of the model. Finally, the accuracy, sensitivity and specificity of the deep learning model are calculated to assess its performance.
Results
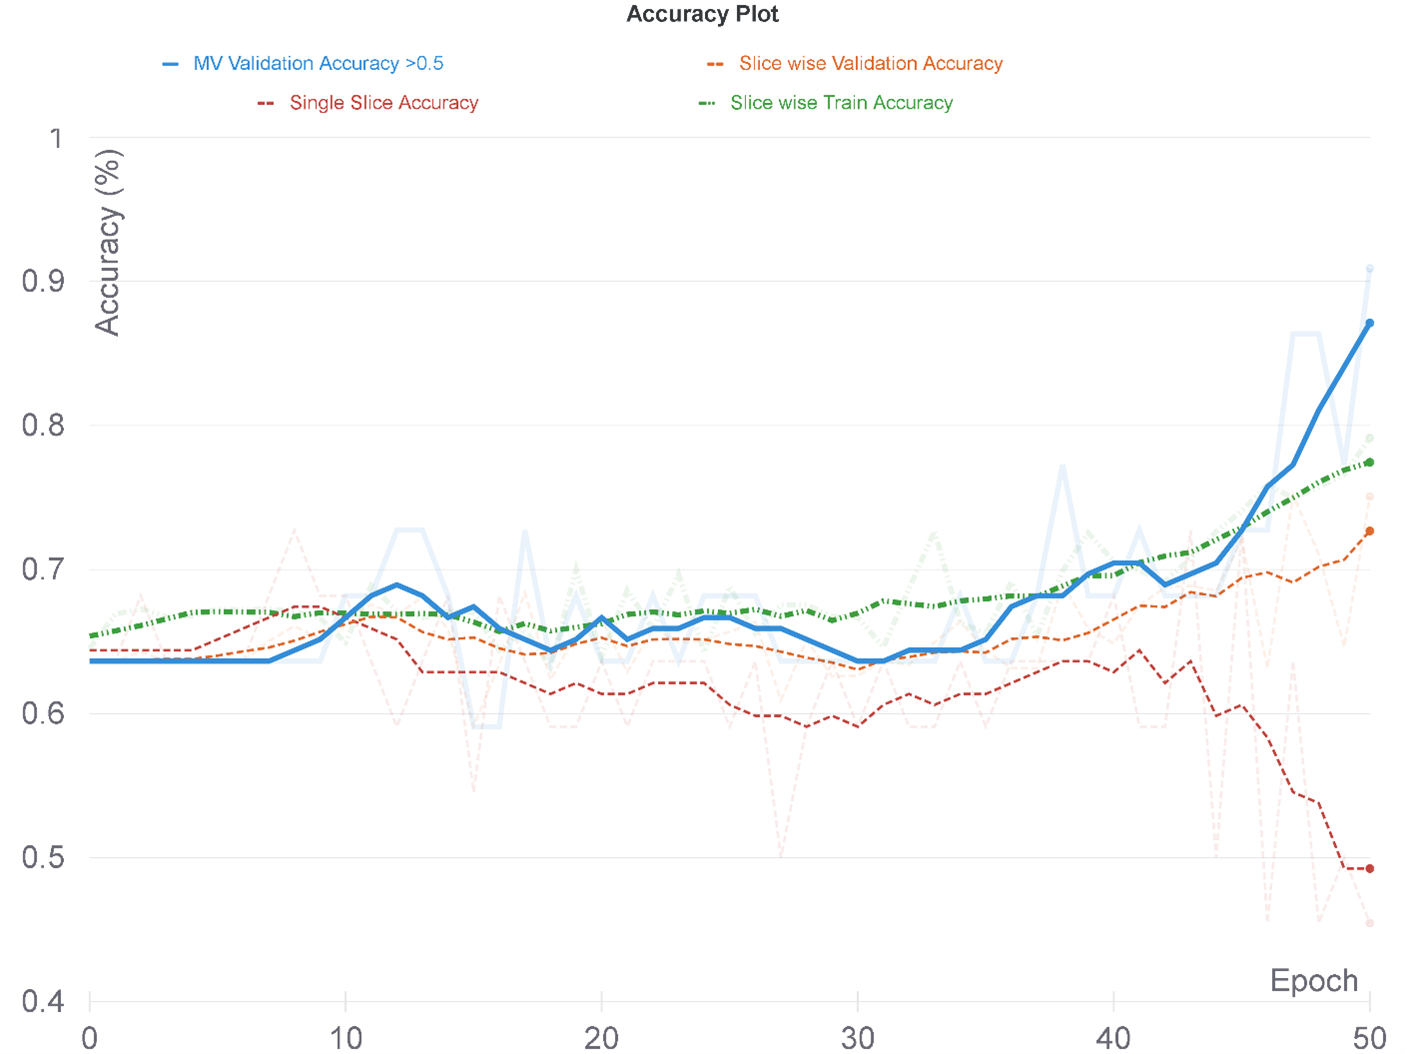
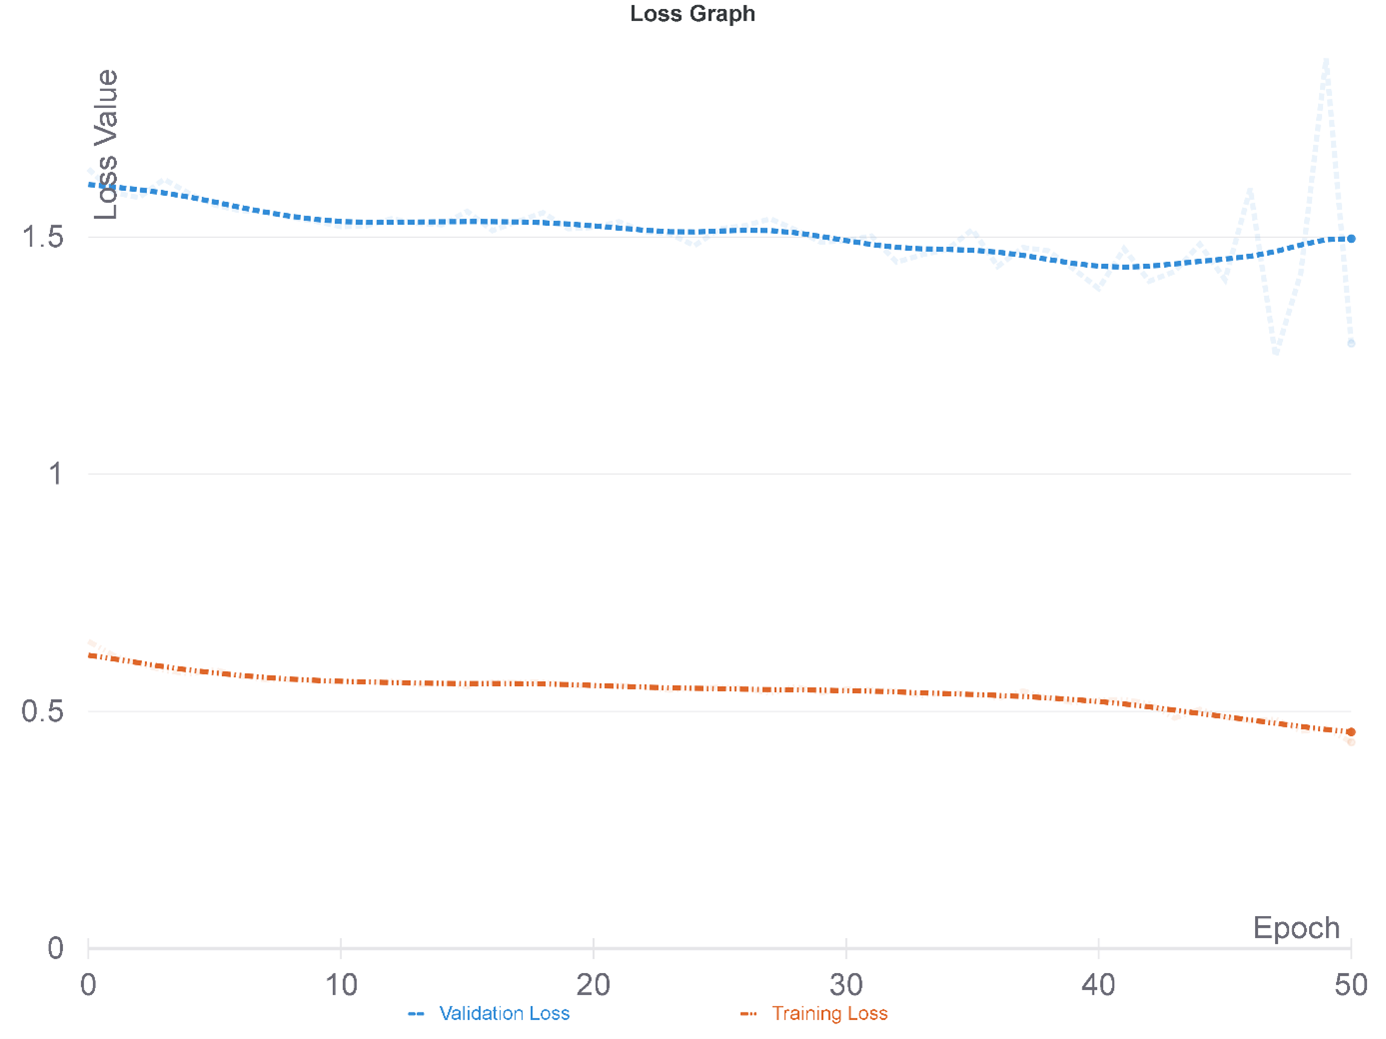
The hybrid deep learning model resulted in the best accuracy of 91% on the validation set and 83% on the test set (specificity=86%, sensitivity=78%) when majority voting was used as the accuracy measure. Figure 3 shows the accuracies and Figure 4 shows the train and validation losses of the proposed hybrid model for 50 epochs. Hyperparameter optimization selected efficientnet-b2 in the fine-tuning procedure. Using a pre-trained network performed worse than the hybrid model that has been proposed in this study. An MV accuracy of 77% was reached on the validation set, while the MV accuracy was 76.19% (specificity=64%, sensitivity=84%) for the validation set after fine-tuning the pre-trained network.Conclusion and Discussion
The accuracy results of the hybrid deep learning model for predicting S100 immunopositivity were better for the majority voting metric than the slice-wise or single slice positivity metrics, The lower slice-wise accuracy might be in agreement with possible heterogeneous biopsy results, which might indicate tumor heterogeneity resulting in signal intensity differences over the slices. On the other hand, reduction of the single slice positivity accuracy in contrast to other accuracy metrics after the 40th epoch might indicate higher misclassification rates for S100-. Future studies will employ attention algorithms for the proposed hybrid deep leaening model to focus more on the relevant parts of the input images to enhance the model performanceAcknowledgements
This study has been supported by TUBITAK 1001 grant 119S520.References
1. Hancq, S., et al., Detection of S100B, S100A6 and galectin-3 ligands in meningiomas as markers of aggressiveness. Int J Oncol, 2004. 25(5): p. 1233-1240.
2. Hancq, S., et al., S100A5: a marker of recurrence in WHO grade I meningiomas. Neuropathology and Applied Neurobiology, 2004. 30(2): p. 178-187.
3. Abeloos, L. and F. Lefranc, Could serum measurements of S100 proteins be reliable markers to predict recurrence in meningiomas? Clinical Chemistry and Laboratory Medicine, 2011. 49(6): p. 971-975.
4. Perry, A., et al., “Malignancy” in meningiomas. Cancer, 1999. 85(9): p. 2046-2056.
5. Perry, A., et al., Meningioma Grading: An Analysis of Histologic Parameters. The American Journal of Surgical Pathology, 1997. 21(12).
6. Zhao, P., et al., Prognostic factors for patients with atypical or malignant meningiomas treated at a single center. Neurosurgical Review, 2015. 38(1): p. 101-107.
7. Fedorov, A., et al., 3D Slicer as an image computing platform for the Quantitative Imaging Network. Magnetic resonance imaging, 2012. 30(9): p. 1323-1341.
8. Kim, Y., Y. Lee, and M. Jeon, Imbalanced image classification with complement cross entropy. Pattern Recognition Letters, 2021. 151: p. 33-40.
9. Biewald, L.J.S.a.f.w.c., Experiment tracking with weights and biases, 2020. 2(5).
Figures