2835
In vivo characterization of preclinical hereditary RCC models by Electron Paramagnetic Resonance and Magnetic Resonance Imaging1Urologic Oncology Branch, National Institute of Health, Bethesda, MD, United States, 2Radiation Biology Branch, National Institute of Health, Bethesda, MD, United States
Synopsis
Human renal cell carcinomas (RCC) have a variety of pathologies and are known to have alterations in cellular metabolism, although many aspects remain unknown. Fumarate hydratase (FH)-deficient tumors exhibit a shift to aerobic glycolytic system due to several factors including loss and mutation of mitochondrial DNA. We investigated the partial pressure of oxygen, vascular permeability, and blood perfusion in FH-deficient UOK262 xenografts and a type 1 papillary RCC xenograft using EPRI and DCE-MRI. Despite low oxygen consumption rates in vitro, UOK262 xenografts showed a modest median pO2 and increased hypoxic fraction as compared to a type 1 papillary RCC xenografts.
Introduction
Hereditary renal cell carcinoma is a disease with a variety of pathologies, different clinical courses, therapeutic treatments differ for each1. Hereditary leiomyomatosis and renal cell carcinoma (HLRCC), caused by autosomal dominant inactivating mutations in the fumarate hydratase (FH) gene, exhibits high glucose uptake, rapid growth, and a propensity to metastasize early1,2. Because of the energy metabolic shift to aerobic glycolytic system, it is possible that the partial pressure of oxygen is low in HLRCC tumors. In addition, type 1 papillary RCC is characterized by mesenchymal epithelial transition (MET) gene mutation, which activates signaling pathways favorable for tumor growth1,3. In hereditary renal cell carcinoma, this type of non-invasive imaging to distinguish features has not been studied yet, which is important for understanding the pathogenesis of the disease. Therefore, in this study, as a beginning of renal cell carcinoma characteristic imaging, we performed EPR oxygen partial pressure imaging and DCE-MRI of these two preclinical renal cell carcinoma models.Methods
UOK262 cell line was established from HLRCC patient and UOK342 cell line was derived from type 1 papillary RCC patient who had surgery at National Institution of Health Clinical Center. NOD scid gamma (NSG) mice were injected with these cell lines. Approximately 5 × 10⁶ cells in 0.1 mL Matrigel (BD Bioscience) were injected subcutaneously into NSG mice, in the right hind leg. In vitro oxygen consumption rates of these cell lines were measured using an XFe Extracellular Flux Analyzer from Seahorse Bioscience. EPRI: Parallel coil resonators tuned to 300 MHz were used for EPRI. OX063 (1.125 mmol/kg bolus) was injected intravenously to a mouse through a tail vein cannula. The free induction decay (FID) signals were collected following the radiofrequency excitation pulses (65 ns) with a nested looping of the x, y, and z gradients, and each time point in the FID underwent phase modulation, enabling 3D spatial encoding (Repetition time: 8.0 μs, Number of averages: 4,000). Following EPR imaging, anatomic T2-weighted MR images were collected with a 1T scanner. DCE-MRI: DCE-MRI studies were performed on a 3T scanner (Bruker BioSpec 3T). T1-weighted fast low-angle shot (FLASH) images were obtained with TR = 117.2 ms; TE = 6 ms; flip angle = 30˚; two slices; 28 x 28 mm resolution; 15-second acquisition time per image; and 45 repetitions. Gd-DTPA solution (4 mL/g of body weight of 50 mmol/L Gd-DTPA) was injected through a tail vein cannula 1 minutes after the start of the dynamic FLASH sequence. To determine the local concentrations of Gd-DTPA, T1 maps were calculated from three sets of Rapid Imaging with Refocused Echoes (RARE) images obtained with TR = 320, 400, 600, 1,000, 2,000, and 3,000 ms, with the acquisitions being made before running the FLASH sequence.Results
As observed previously, FH-deficient UOK262 cells showed very low oxygen consumption rate in vitro, whereas UOK342 cells showed relatively robust respiration which was sensitive to inhibitors of the respiratory chain (Fig. 1). FH-deficient UOK262 xenografts exhibited a median pO2 of 19.8 mmHg, whereas type 1 papillary UOK342 xenografts exhibited a median pO2 of 25.4 mmHg, a difference which was statistically significant (p=0.02; Welch’s t-test) (Fig. 2A,B). UOK262 xenografts had a significantly higher hypoxic fraction compared with UOK342 xenografts, as defined by percentage area with pO2<10 mmHg (HF10) (Fig. 2C). DCE-MRI showed that UOK262 had higher median Ktrans as compared to UOK342 xenografts (Fig. 3B) and also, area under curve (AUC) 1 minute of Gd-concentration curve was relatively lower on UOK262 compared to UOK342 xenografts (Fig. 3C,D) which AUC 10 min did not show almost no difference between them (Fig. 3E).Conclusion
Despite low respiration rates observed in vitro, EPR imaging of revealed that tumor pO2 was relatively low in UOK262 xenografts compared to UOK342 xenografts. DCE-MRI studies indicated that perfusion characteristics we different between the two RCC models. Since there are many aspects of the in vivo tumor microenvironment that are not present in vitro, tumor oxygen levels are likely to be influenced by additional factors. In addition, since the growth characteristics of transplanted tumors differs across different RCC models, we believe that some structural characteristics may be different, resulting in different tumor pO2 and perfusion values. Further studies are needed to clarify these findings.Acknowledgements
We are deeply grateful to members of Radiation Biology Branch, National Institute of Health for their skillful technical assistance.References
1. Linehan WM, Schmidt LS, Crooks DR, et al. The metabolic basis of kidney cancer. Cancer Discov. 2019;9;1006 – 1021.
2. Yang Y, Valera VA, Padilla-Nash HM, et al. UOK 262 cell line, fumarate hydratase deficient (FH-/FH-) hereditary leiomyomatosis renal cell carcinoma: in vitro and in vivo model of an aberrant energy metabolic pathway in human cancer. Cancer Genet Cytogenet. 2010;196;45 – 55.
3. Schmidt L, Duh F, Chen F, et al. Germline and somatic mutations in the tyrosine kinase domain of the MET proto-oncogene in papillary renal carcinomas. Nat Genet. 1997;16;68 – 73.
Figures
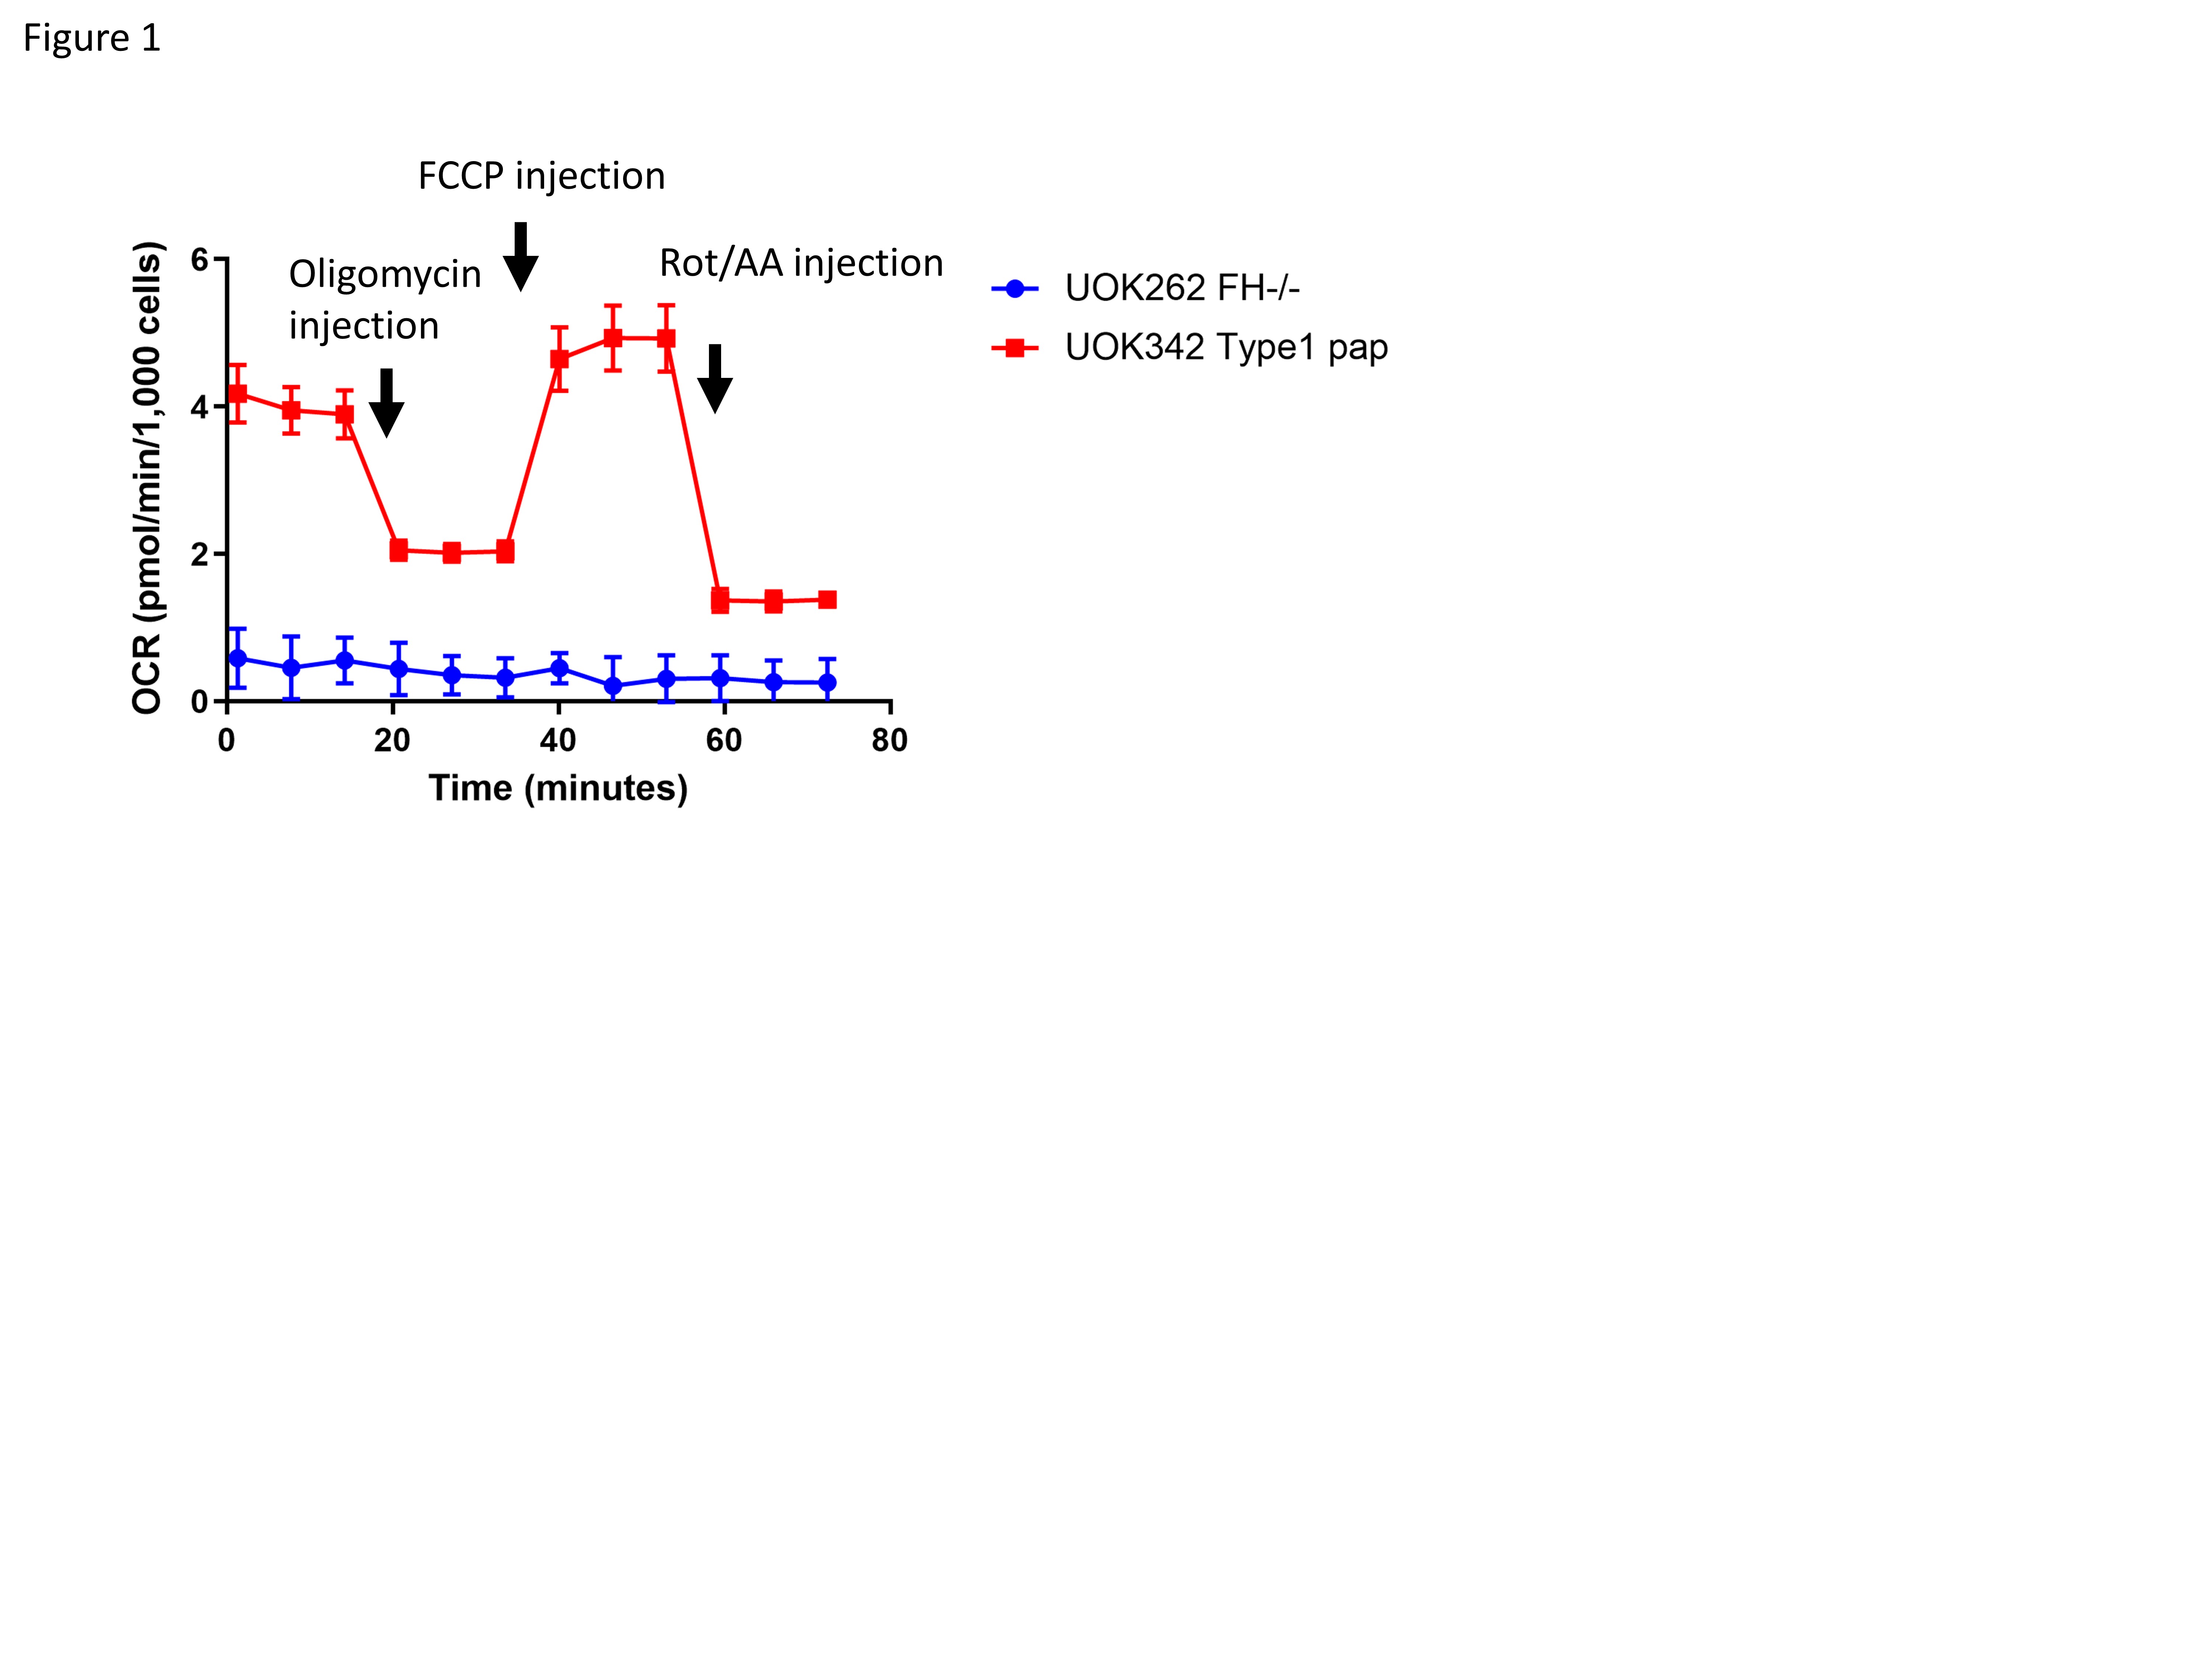
Figure 1. Evaluation of mitochondrial respiration in HLRCC and Type1 papillary RCC.
Mito stress test of HLRCC cell line UOK262 cells and type 1 papillary RCC cell line UOK342 cells. Oxygen consumption rate (OCR) was measured under basal condition and after the addition of inhibitors of mitochondrial respiration (1 µM oligomycin, 1 µM FCCP and 0.5 µM rotenone/antimycin A) . Data are expressed as mean ± SD (n = 3).
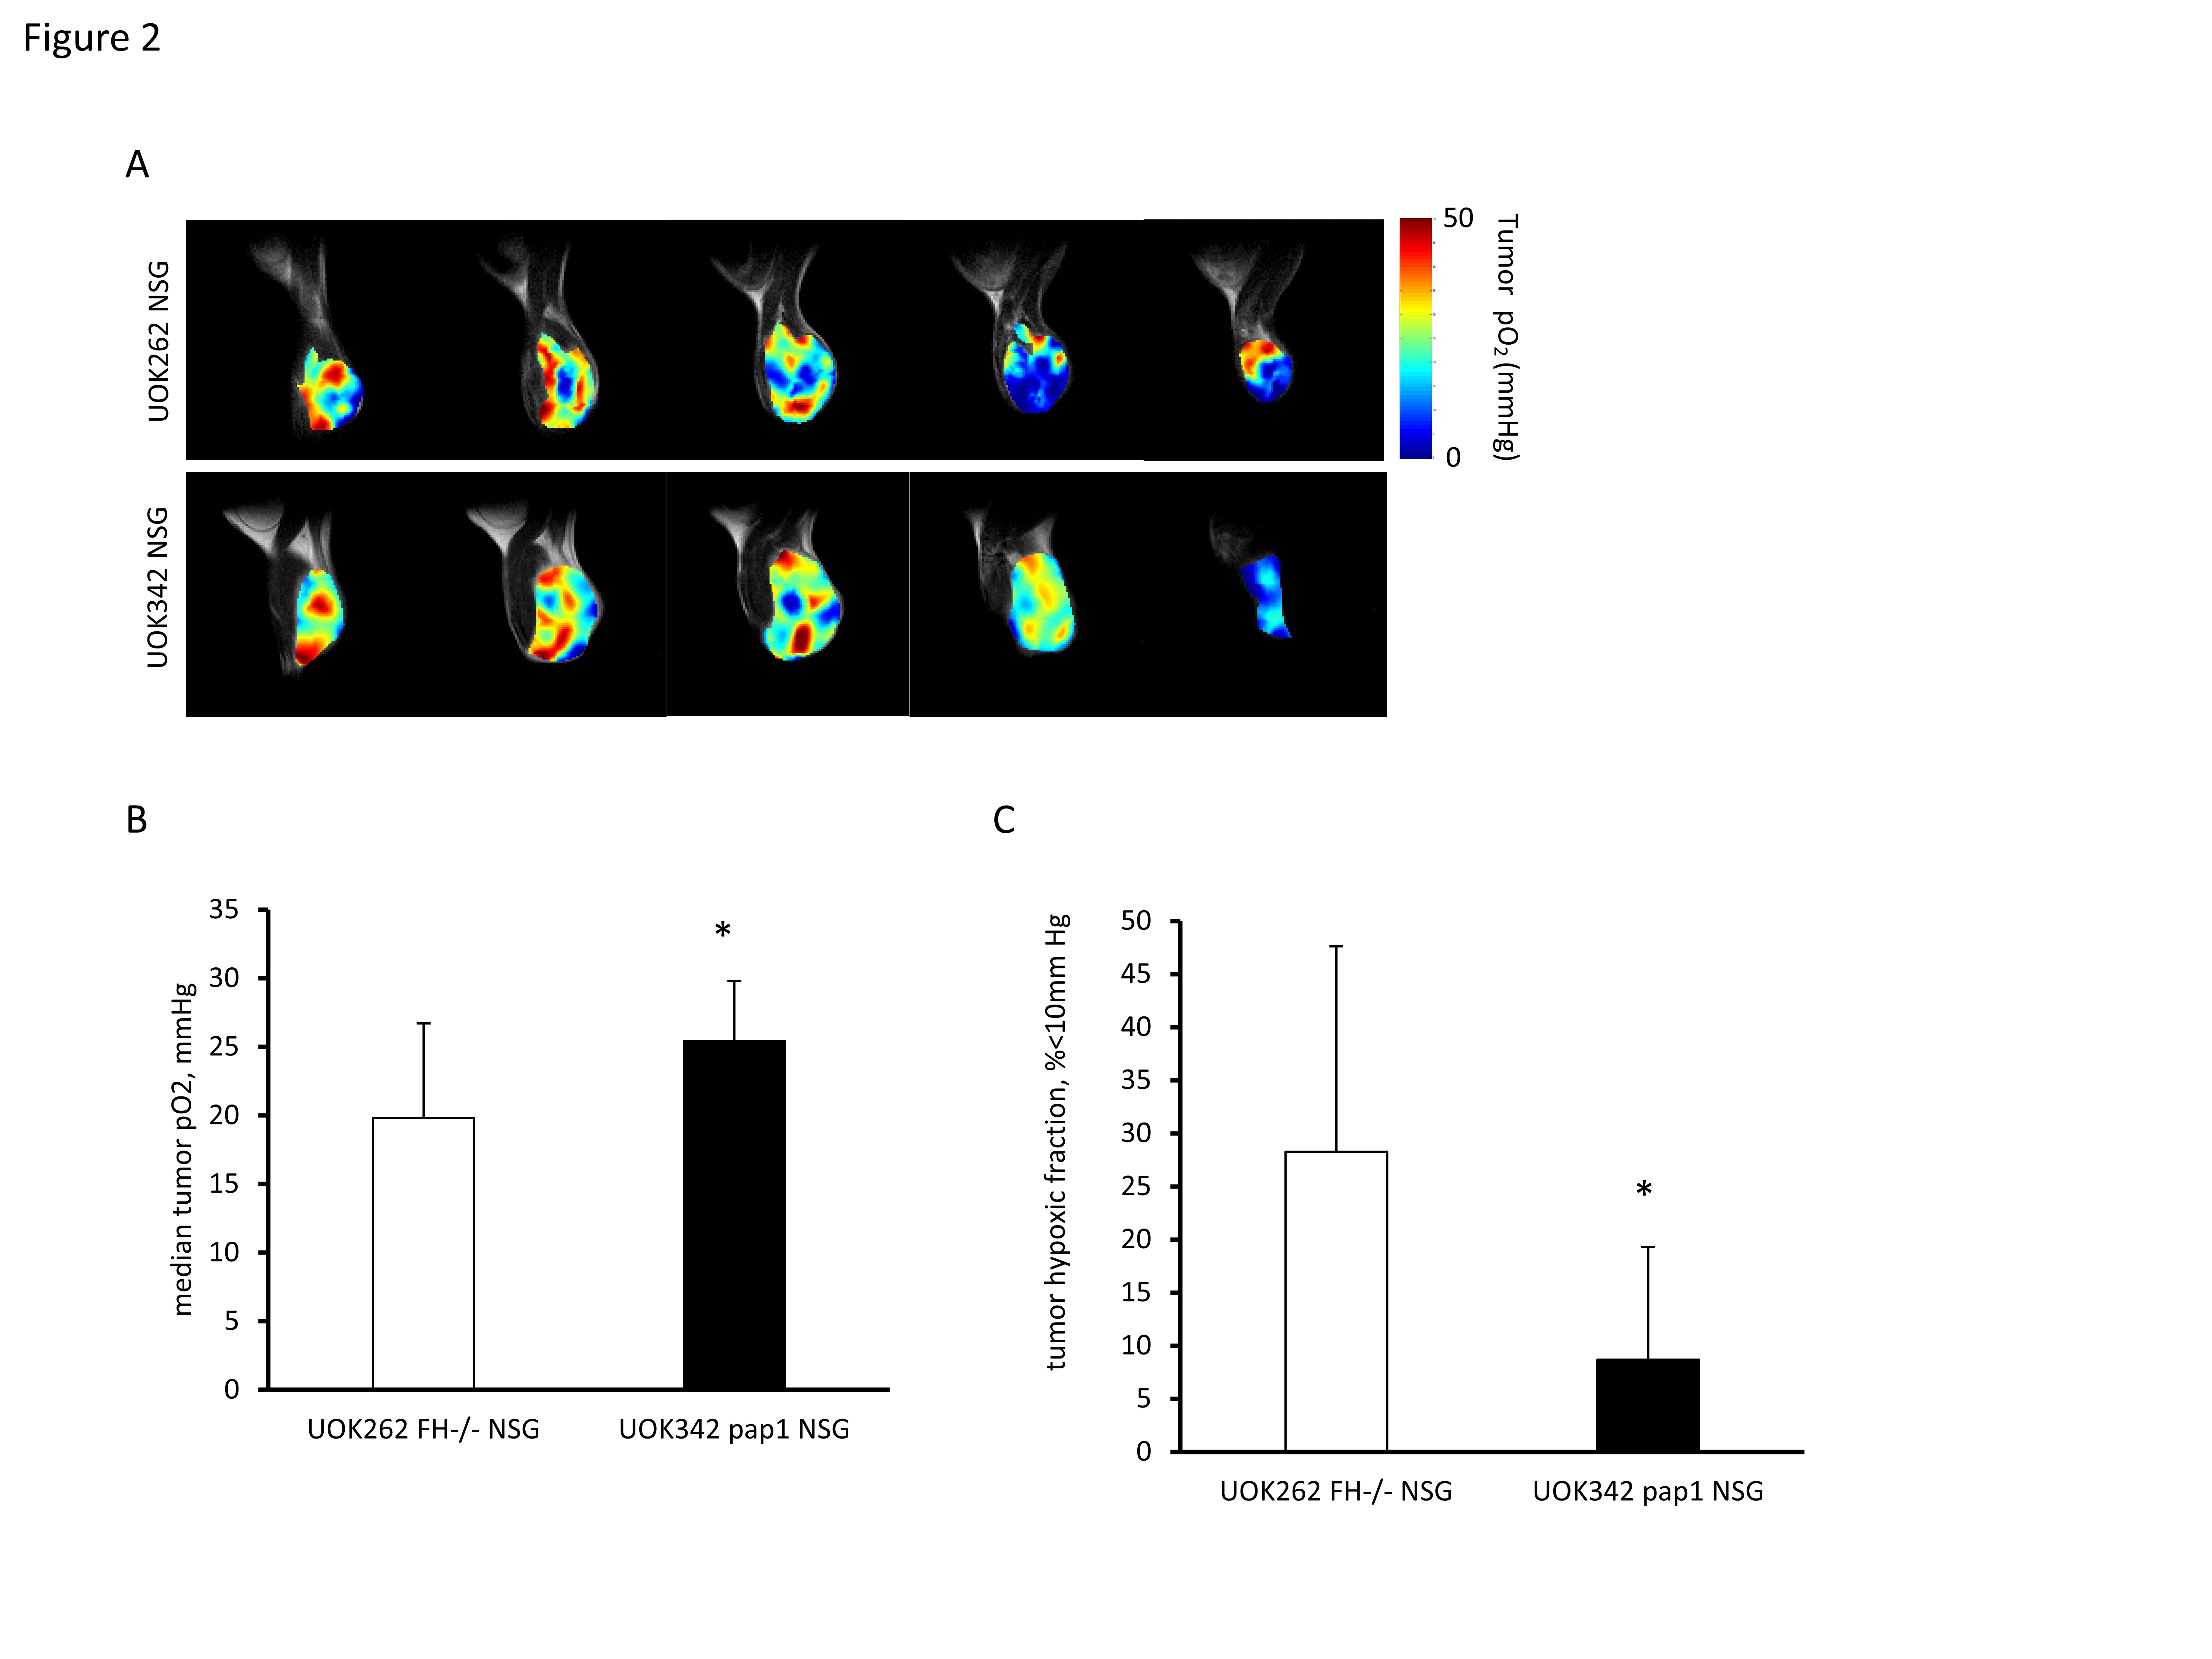
Figure 2. Measurement of partial pressure of oxygen in hereditary RCC xenografts using EPR oximetry.
(A-C) EPR imaging in two RCC tumor model. (A) Representative EPR images and histogram of UOK262 and UOK342 xenograft in NSG mice. (B and C) Difference of pO2 (B) and HF10 (C) between RCC xenografts. Data are expressed as mean ± SD. Statistical significance between groups was determined by Welch’s t-test (UOK262; n = 6, UOK342; n = 8, *p < 0.05).
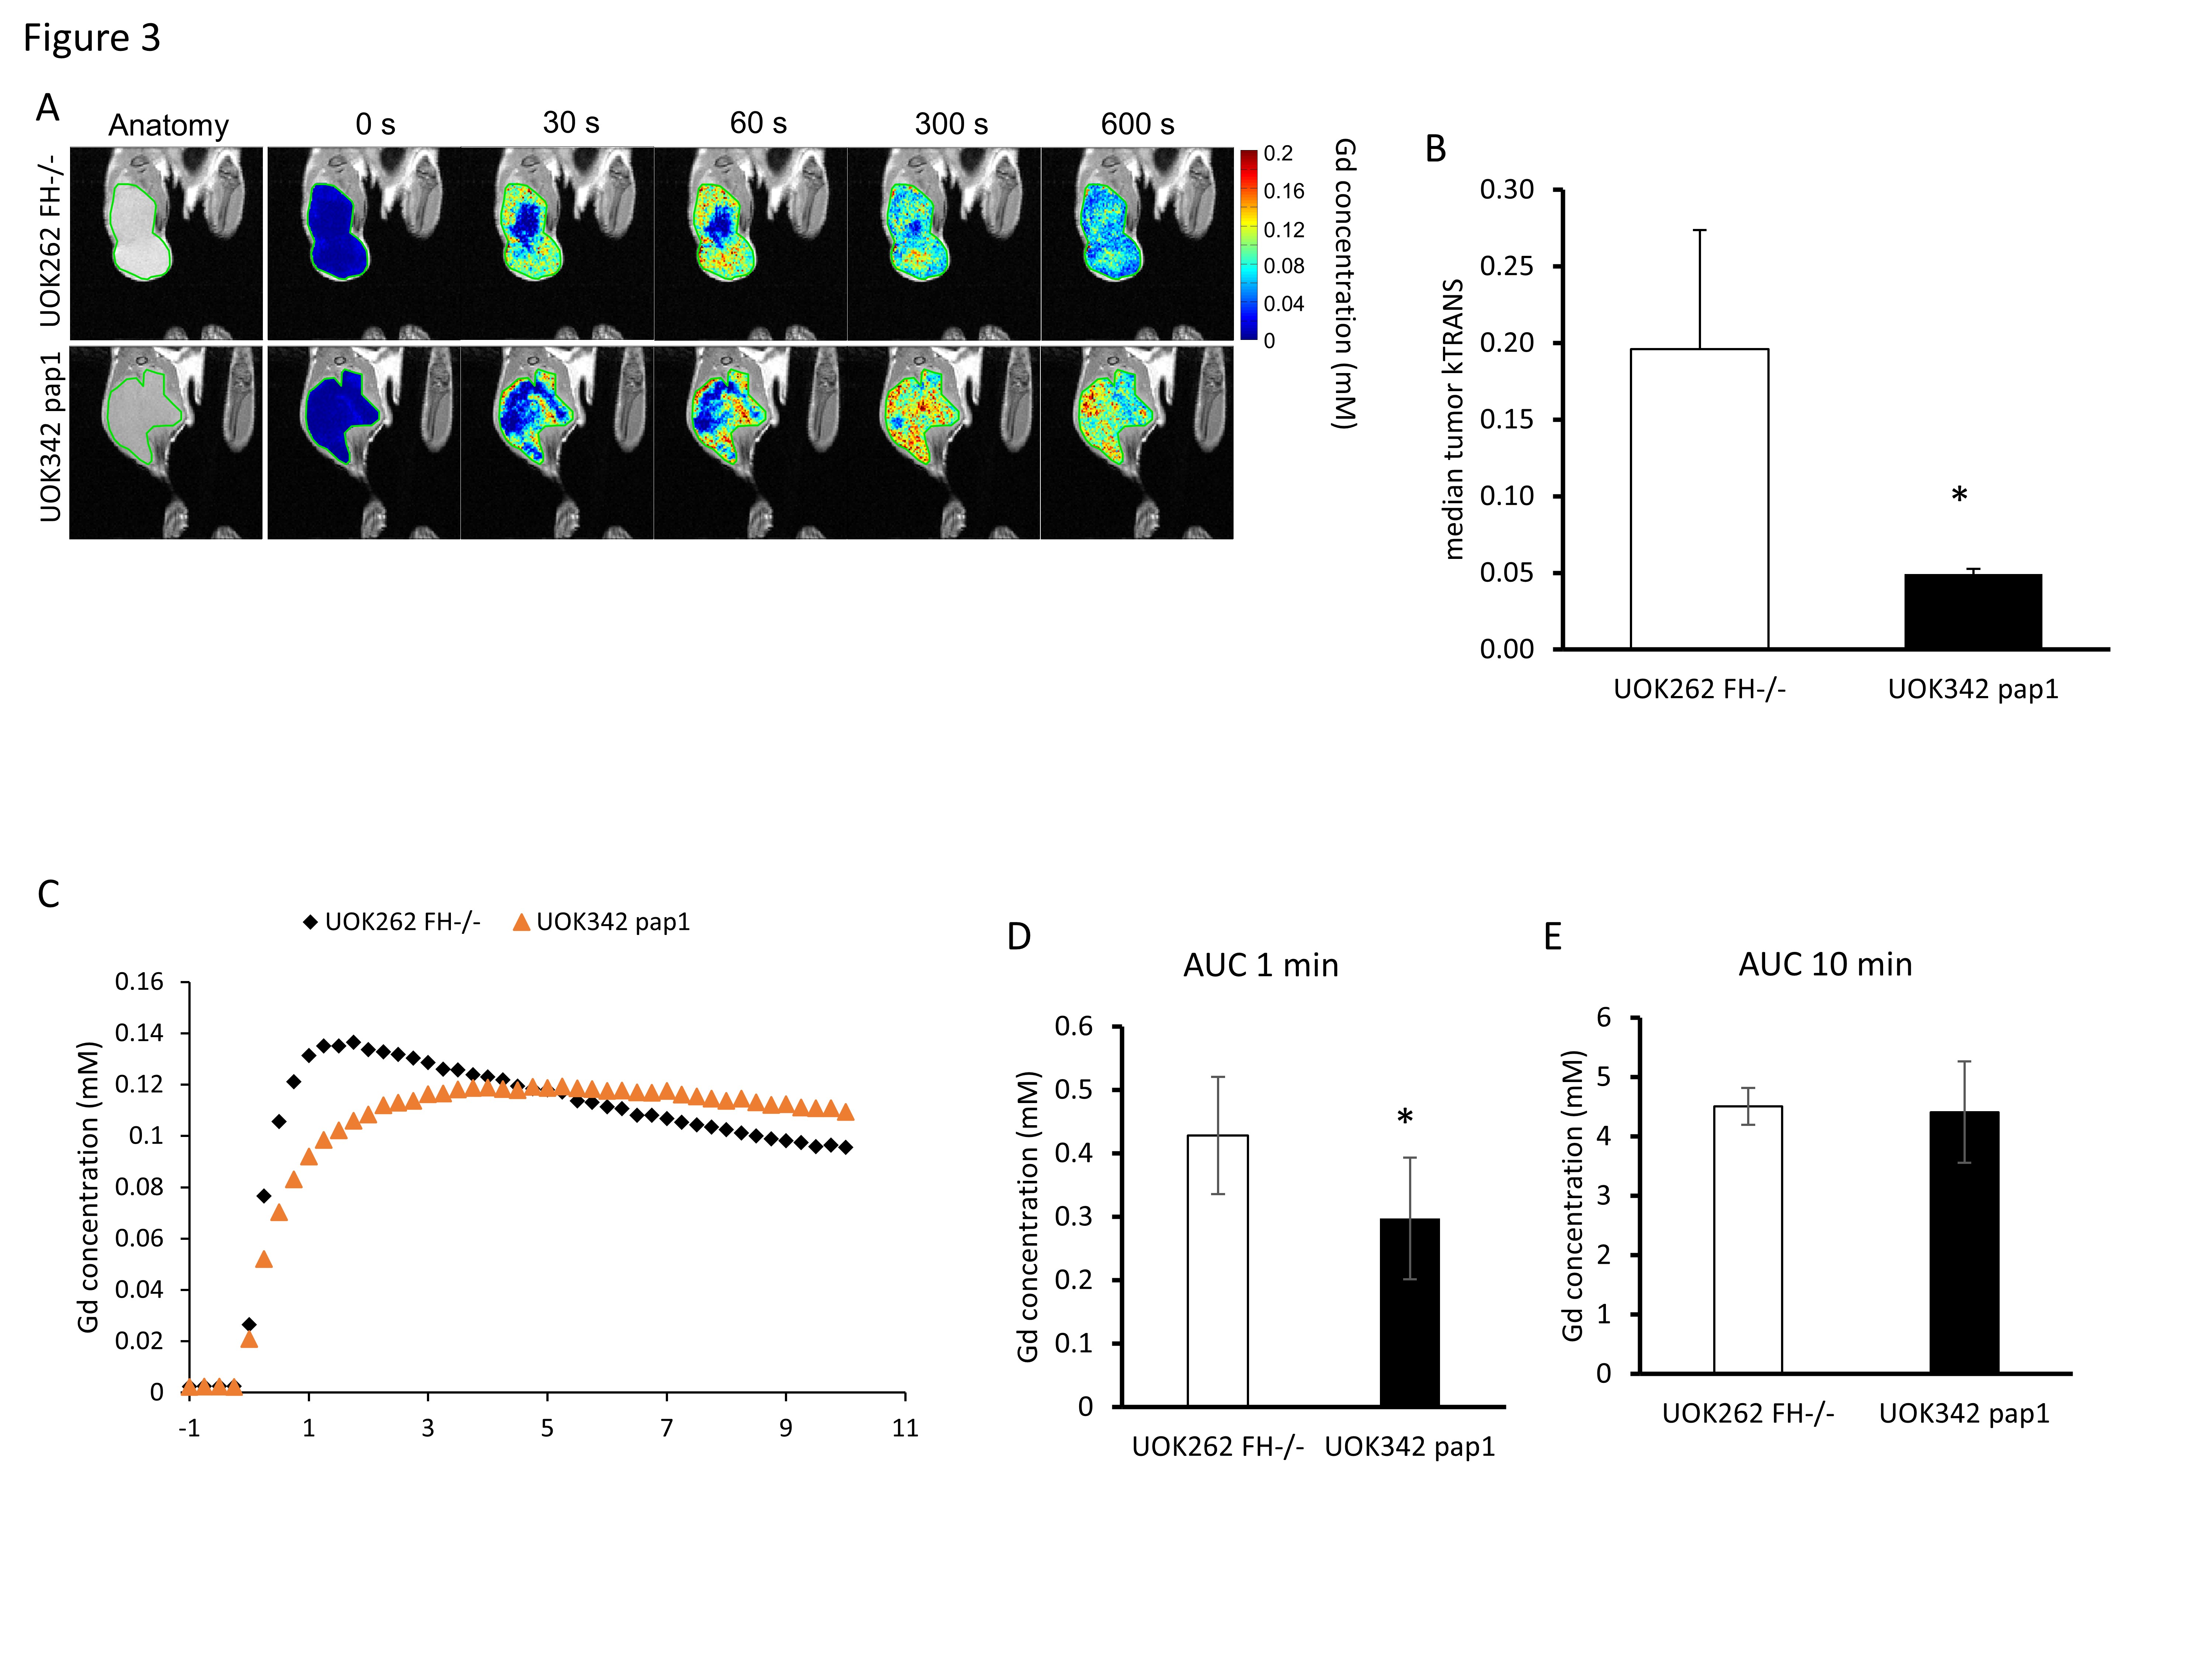
Figure 3. Comparison of tumor perfusion index in tumor between UOK262 and UOK342 xenograft using DCE-MRI.
(A) Representative images of DCE-MRI of UOK262 and UOK342 xenografts. (B) Ktrans median of UOK262 and UOK342 xenografts. (C) Time-intensity kinetic curves of DCE-MRI ,(D) AUC 1 min, and (E) AUC 10 min of UOK262 and UOK342 xenografts. Data are expressed as mean ± SD. Statistical significance between groups was determined by Welch’s t-test (n = 10, *p < 0.05).