2833
Intravoxel Incoherent Motion Combined With DCE-MRI of Endometrial cancer:Correlations Between Multimodal Parameters and Her-2 Expression1Department of Radiology, the First Affiliated Hospital of Dalian Medical University, Dalian,China, China, 2Department of Radiology, the First Affiliated Hospital of Dalian Medical University, Dalian, China
Synopsis
At present, there are few reports on the application of imaging methods to predict the Her-2 gene expression of EC. This study will use the two functional sequences of IVIM and DCE-MRI to explore its preoperative prediction of the Her-2 gene expression of EC. Value, at the same time, discuss the correlation between the parameters of the two functional sequences.
Introduction and Purpose
To explore the value of IVIM and DCE-MRI in predicting the expression of human epidermal growth factor receptor 2(Her-2) in EC.Materials and Methods
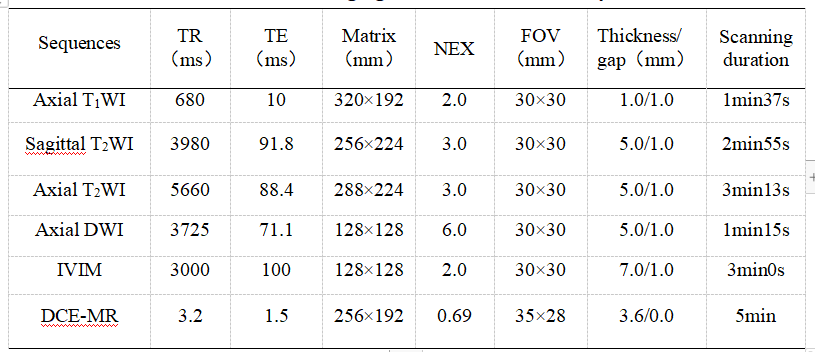
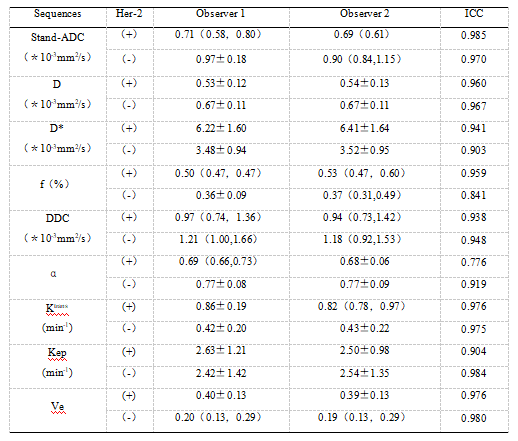
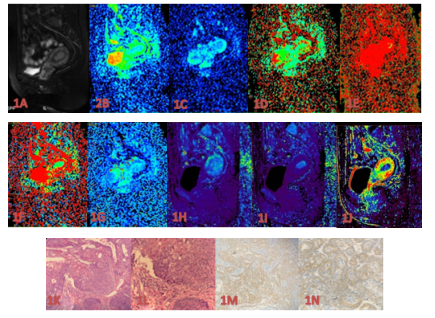
The clinical and imaging data of 53 EC patients confirmed by pathology from February 2016 to 2019 were retrospectively analyzed, and they were divided into 22 cases in the Her-2 positive group and 31 cases in the Her-2 negative group. 1.5T magnetic resonance examinations were performed before surgery, and the scanning sequence included T1WI, T2WI, DWI, IVIM (10 b values: 0, 20, 50, 100, 150, 200, 400, 800, 1200, 2000s/mm2), DCE -MRI etc. The two observers independently measured the data when the clinical and pathological information of the patient were unknown. Intraclass Correlation Coefficient (ICC) was used to test the IVIM multi-model parameters (Stand-ADC, D, D*, f, DDC, α) and the quantitative parameters of DCE-MRI (Ktrans, Kep, Ve) consistency of measurement results; according to whether the data conforms to the normal distribution or not, independent sample t test or Mann-Whitney rank sum is used Test and compare the difference of each parameter value, and use ROC curve to evaluate the statistically different parameters to predict the AUC of the Her-2 gene expression of EC. The Delong test was used to compare the differences between the AUCs.The correlations between IVIM or DCE perfusion parameters and Her-2 expression were analyzed with the Pearson or Spearman rank correlation test.Results
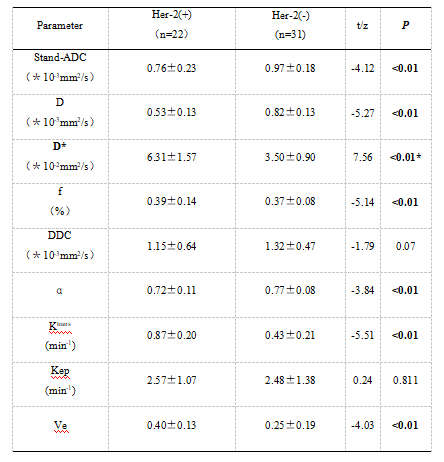
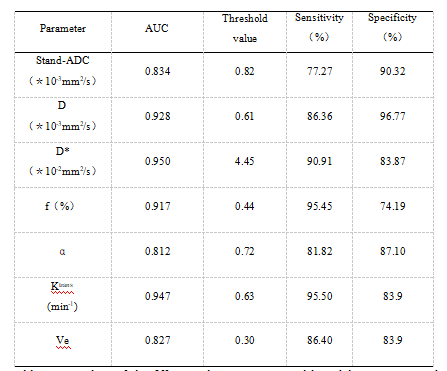
The measurement results of the two observers are in good agreement (ICC>0.75). The Stand-ADC value, D value, and α value of the Her-2 positive group were lower than the Her-2 negative group's EC, and the D* value, f value, Ktrans value, and Ve value were all higher than the Her-2 negative group. The differences in parameters were statistically significant(P<0.05); the DDC value of the Her-2 positive group was lower than that of the Her-2 negative group while the Kep value was higher than that of the Her-2 negative group, but the difference was not statistically significant(P>0.05). Stand-ADC, D, D*, f, α, Ktrans, Ve predict the AUC, threshold, sensitivity, and specificity of Her-2 expression of EC are 0.843, 0.928, 0.950, 0.917, 0.812, 0.947, 0.827, 0.82, respectively ×10-3mm2/s, 0.61×10⁻³mm2/s, 4.45×10⁻²mm2/s, 0.44%, 0.72, 0.63min-1, 0.30, 77.27%, 86.36%, 90.91%, 95.45%, 81.82%, 95.50%, 86.40%, 90.32%, 96.77%, 83.87%, 74.19%, 87.10%, 83.90%, 83.90%. The AUC of the Her-2 gene expression of each parameter predicted by the Delong test showed that only the AUC of the Stand-ADC and D parameters were different (P=0.01).There was a statistically significant moderate positive correlation between D* and f (r= 0.531; P < 0.01), and between f and Ktrans(r= 0.556;P < 0.001). Notably, D* exhibited a stronger correlation with Ktrans (r= 0.625 ; P < 0.001). Additionally, we also observed a weak correlation between D* and Ve(r= 0.370; P <0.001).Discussion and Conclusion
In this study, the Stand-ADC value and D value of EC of the Her-2 negative group were higher than those of the Her-2 positive group, and the difference was statistically significant (P<0.05). The analysis may be due to the Her-2 gene The expression enhances the proliferation activity of tumor cells [1,2], increases the cell density, narrows the intercellular space, and restricts the diffusion and movement of water molecules. Therefore, the Stand-ADC value and D value of the Her-2 positive group EC are lower than Her-2 negative group. At the same time, in this study, the Stand-ADC values of the two groups of EC are higher than D, which also verifies that Stand-ADC is a comprehensive consideration of the microcirculation perfusion of living tissues and the diffusion of water molecules compared with the D value. Reflecting the advantage of the double exponential model, that is, reflecting the real water diffusion movement information, which is consistent with the research results of Cheng Nan [3].The D* value and f value of the EC of the Her-2 positive group are higher than the EC of the Her-2 negative group, indicating that the EC of the Her-2 positive group has more new blood vessels, resulting in higher tumor microvessel density and faster blood flow in the microvessels. Because Her-2 gene can induce the production of vascular endothelial growth factor (ascular endothelial growth factor, VEGF), increase tumor angiogenesis and increase blood perfusion [4]. The results of this study are consistent with the results of CHO [5] and other studies on the correlation of Her-2 gene expression in breast cancer.
The results of the correlation analysis in this study showed that there is a strong positive correlation between the D* value and the Ktrans value (r = 0.625; P <0.001), and there is a moderate positive correlation between the f value and the Ktrans value (r = 0.556; P < 0.001), which is related to the microcirculation perfusion of the tissues they all reflect. Additionally, we also observed a weak correlation between D* and Ve(r= 0.370; P <0.001).This is because the Ve value is not only affected by the blood flow velocity, but also mainly affected by the extravascular space, such as tumor cell density, the degree of necrosis of the diseased cyst, and the extracellular matrix. This reduces the correlation between the D* value and the Ve value.
Acknowledgements
NoReferences
[1]]Liu YL,Zhang R,Lu DM,et al.Correlations of whole volume intravoxel incoherent motion-diffusion weighted imaging (IVIM-DWI) histogram quantitative parameters andER, PR and HER-2 expression in breast cancer[J].Chinese Journal of Medical Imaging Technology,2021,37(3):380-385
[2]RAKOVITCH E,NOFECH MS,HANNA W,et al. HER2/neu and Ki-67 expression predict non-invasive recurrence following breastconserving therapy for ductal carcinoma in situ [J].Br J Cancer,2012,106(6)1160-1165.
[3]Chen N,Lv XH,Ren K,et al.Diagnostic Value of IVIM - DWI Multi-model Parameter Analysis for Cervical Cancer[J].Radiol Practice,2017,32(2):157-161.
[4]LEE EY,YU X,CHU MM,et al.Perfusion and diffusion characteristics of cervical cancer based on intraxovel incoherent motion MR imaging—a pilot study[J] Eur Radiol,2014,24(7):1506—1513.
[5]CHO GY,MOY L,KIM SG,et a1.Evaluation of breast cancer using intravxel incoherent motion (IVIM) histogram analysis:Comparison with malignant status, histologicaI subtype,and molecular prognostic factors[J].Eur Radiol,2016,26(8):2547-2558.
Figures