2827
Separation of Intra- and Extra-cellular Sodium Using A Rotation of Spiral Disc (RSD) Sequence with Multiple Echoes1Biomedical Imaging Center, Beckman Institute for Advanced Science and Technology, University of Illinois at Urbana-Champaign, Urbana, IL, USA, IL, United States, 2Department of Kinesiology and Community Health, University of Illinois at Urbana-Champaign, Urbana, IL, USA, IL, United States, 3Department of Bioengineering, University of Illinois at Urbana-Champaign, Urbana, IL, USA, IL, United States
Synopsis
An efficient sequence to acquire sodium image, i.e., rotation of the spiral disc, was developed last year. This sequence is further developed to separate the sodium signal into intra- and extra-cellular sodium by collecting multiple echoes and bi-exponential curve fitting. This method is confirmed on agarose phantom for T2* mapping and on human lower-leg muscle with an isometric plantar flexion exercise for separation of intra- and extra-cellular sodium. In the calf muscle experiment, it was found that the intracellular sodium was increased more than the extra-cellular sodium. This method finally allows studying separately the intra- and extra-cellular sodium in muscles.
Introduction
We incidentally found that the sodium of the gastrocnemius muscle was much higher than other muscles on calf muscle sodium MRI. The participant was jogging regularly. The question was whether this was due to the increase in intra- or extra-cellular sodium. The existing methods such as multiple-quantum filtering1 and inversion recovery2 are not practical for in vivo studies due to low signal. So, we started to expand the RSD sequence3 to acquire multiple echoes and separate intra- and extra-cellular sodium signals in lower leg muscles using bi-exponential curve fitting exploiting their T2 difference.Methods
The RSD sequence was expanded to multiple echoes by adding a rewinder gradient pulse after each spiral readout (Fig. 1). The trajectory details were: number of trajectories per disc=98, number of discs=88, dwell time=5us, readout time=3.02ms, and number of echoes=8. The MRI scanner was 3T. A body-array surface and a quadrature RF coil were used for proton and sodium MRI, respectively. The scan parameters for sodium were: TR=70ms, flip angle=90degree, FOV=224mm, image matrix=56x56x56, TE= 0.28, 5.33, 10.38, 15.43, 20.48, 25.53, 30.58, and 35.63ms. A T1-weighted water/fat proton image was obtained and served as an anatomic reference for muscle segmentation. The leg was wrapped with fiducial markers to assist the coregistration between proton and sodium images using FSL’s FLIRT (Fig. 2A and 2B). A rubber band was used for ankle plantar flexion exercise (Fig. 2C) and this task is described in Fig. 2D. The RSD data were reconstructed into 3D volume images using BART tool with adjoint4. Last year we used the inverse method of the BART tool, but it resulted in image artifacts. The adjoint matrix was calculated by summing up the trajectories and weighted by a Shepp-Logan filter. The sodium images were analyzed for bi-exponential relaxation using Matlab’s lsqcurvefit function. The muscle was segmented manually and filtered out for vessels using an intensity threshold. Phantoms with various concentrations of agarose were used in sequence testing and in the development of data analysis. Then, we applied the methodology above to investigate the acute effects of exercise on total, intra- and extracellular sodium in human lower-leg muscles. To achieve this, we recruited two healthy participants (a female of 27 yr and a male of 30 yr) to participate in this study with IRB approval. The participant’s exercise procedure is shown in Fig. 2D. The sodium concentration was calibrated using the 50mM reference tube and its measured T1 relaxation time of 71ms.Results
The RSD sequence with multiple-echo resulted in good image quality for all echoes with expected T2*-weighting. T2* values of agarose gel tubes were confirmed to be within the expected trend (Fig. 3). The calf sodium images are shown in Fig. 4 with the muscle segmentation map. The averaged T2* of muscles were 1.5 and 15.5ms for fast and slow relaxation, respectively. The total and intracellular sodium concentrations at the baseline acquisition were 12.8 and 8.5mM for the female participant, while they were 14.4 and 9.8mM for the male participants, respectively. The sodium change after the exercise is plotted in Fig. 5 for each muscle of two participants. As shown in both participants, at the end of exercise (denoted as Post1), total sodium signal increased to a greater extent in all muscles responsible for plantar flexion of the foot (EDL, PL, SOL, LG, and MG) than in TA muscle, which acts as a dorsiflexor. The exercise-induced increase in total muscle sodium signal was mainly driven by increased intracellular sodium. Both total and intracellular sodium in the muscles decreased toward baseline levels at the second post-exercise sodium scan (denoted as Post2), while the changes in extracellular sodium lasted longer.Discussion
The separation of intra- and extra-cellular sodium using the bi-exponential curve fitting seemed to work without any penalty other than larger data. The time for collecting multi-echoes did not increase TR or scan time because the sodium scan requires a time delay due to elevated SAR of sodium scan compared to proton. The scan time of 10 min for each 3D volume might not be short enough for dynamic study. The RSD trajectory was designed to reconstruct each volume using only half of the shots, but it was not tested in this abstract. The exercise protocol was not optimized for its setup and duration, but this can be further refined in future studies.Conclusion
The RSD sequence with multiple echoes was successfully demonstrated in separating the tissue sodium into intra- and extra-cellular sodium using the difference in their T2 relaxation times without any penalty to the scan time or signal. Additionally, potentially important information on muscle sodium physiology was discovered, opening new avenues for further research on muscle sodium regulation and associated diseases.Acknowledgements
The BART tool was critically important in image reconstruction and their webinars were very helpful in resolving the reconstruction artifacts. The authors appreciate the pilot scan hours generously granted by the BIC director, Dr. Wszalek.
References
1. Jung KJ, Cannon PJ, Katz J. Measurement of transverse relaxation times and content ratio from phantoms simulating 23Na in biological systems using multiple-quantum filtering. J Magn Reson. 1997;124(1):393–399.
2. Nagel Am, Amarteifio E, Lehmann-Horn F, et al. 3 Tesla sodium inversion recovery magnetic resonance imaging allows for improved visualization of intracellular sodium content changes in muscular channelopathies. Investigative Radiology. 2011;46(12):759-766.
3. Jung KJ, Sutton B. Three-dimensional sodium MRI using a rotation of spiral disc (RSD) trajectory. Int Soc Magn Reson Med. 2021.
4. Jonathan I Tamir, Frank Ong, Joseph Y Cheng, Martin Uecker, and Michael Lustig. Generalized Magnetic Resonance Image Reconstruction using The Berkeley Advanced Reconstruction Toolbox. ISMRM Workshop on Data Sampling and Image Reconstruction, Sedona 2016.
Figures
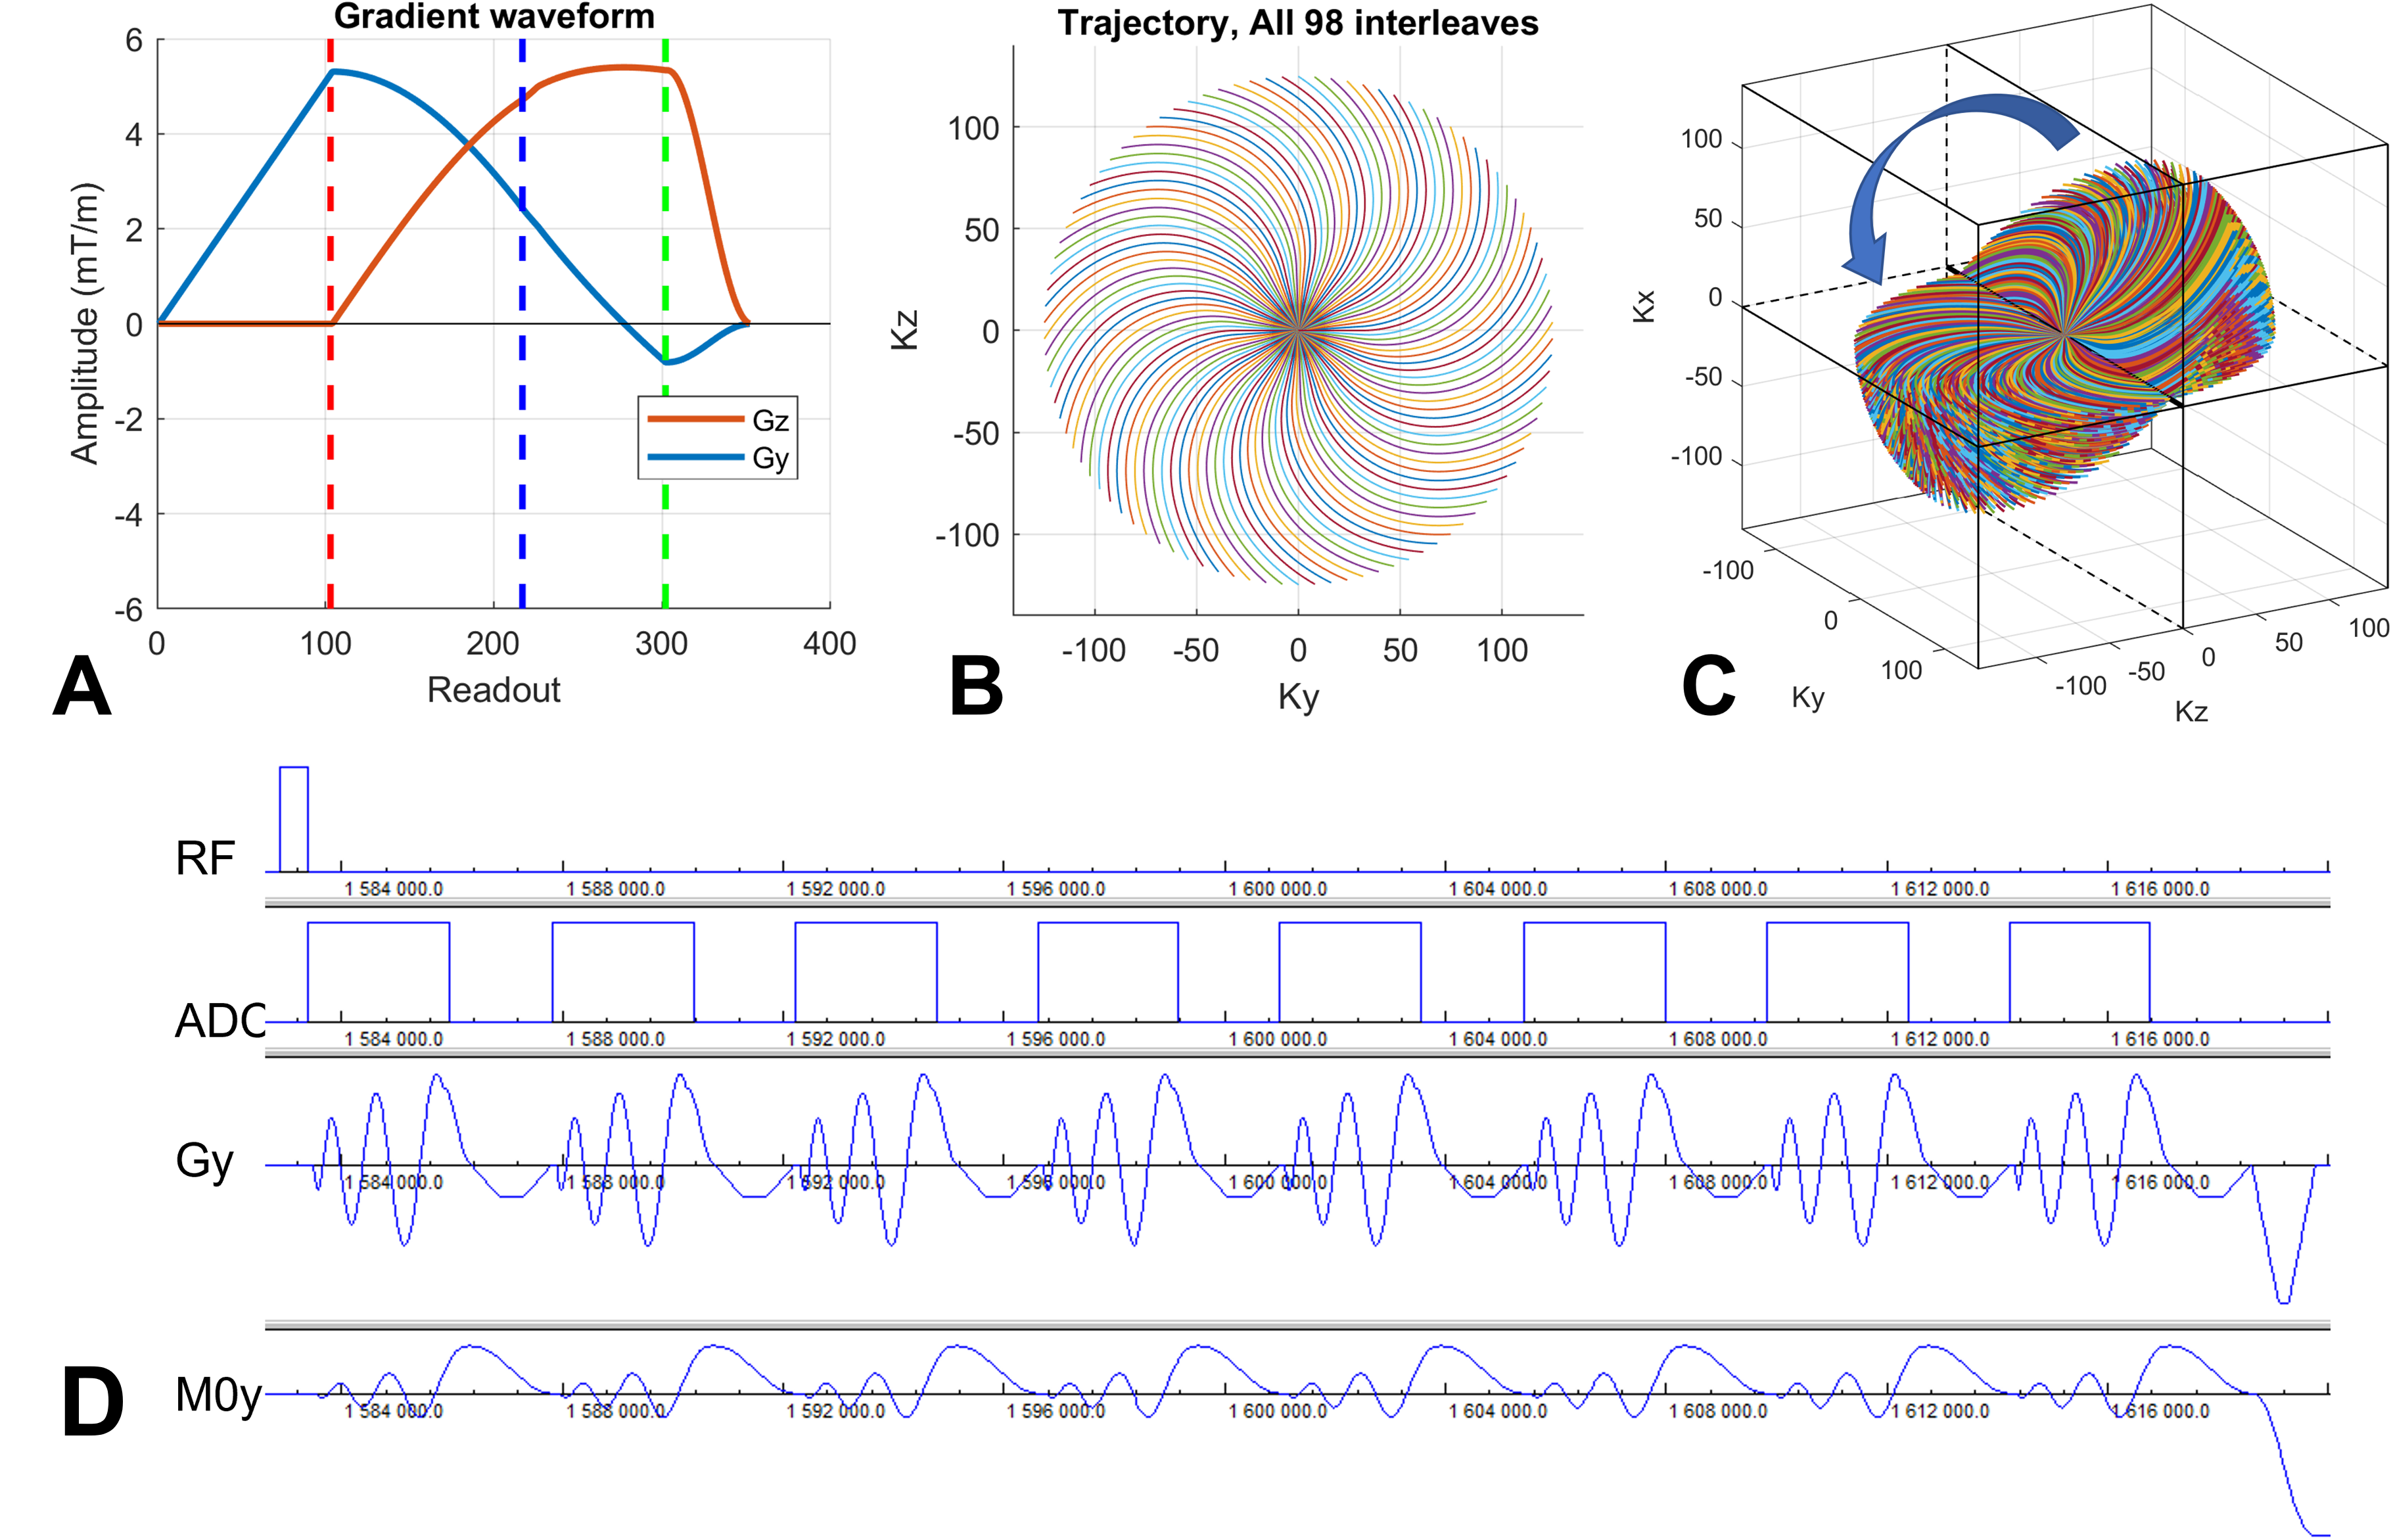
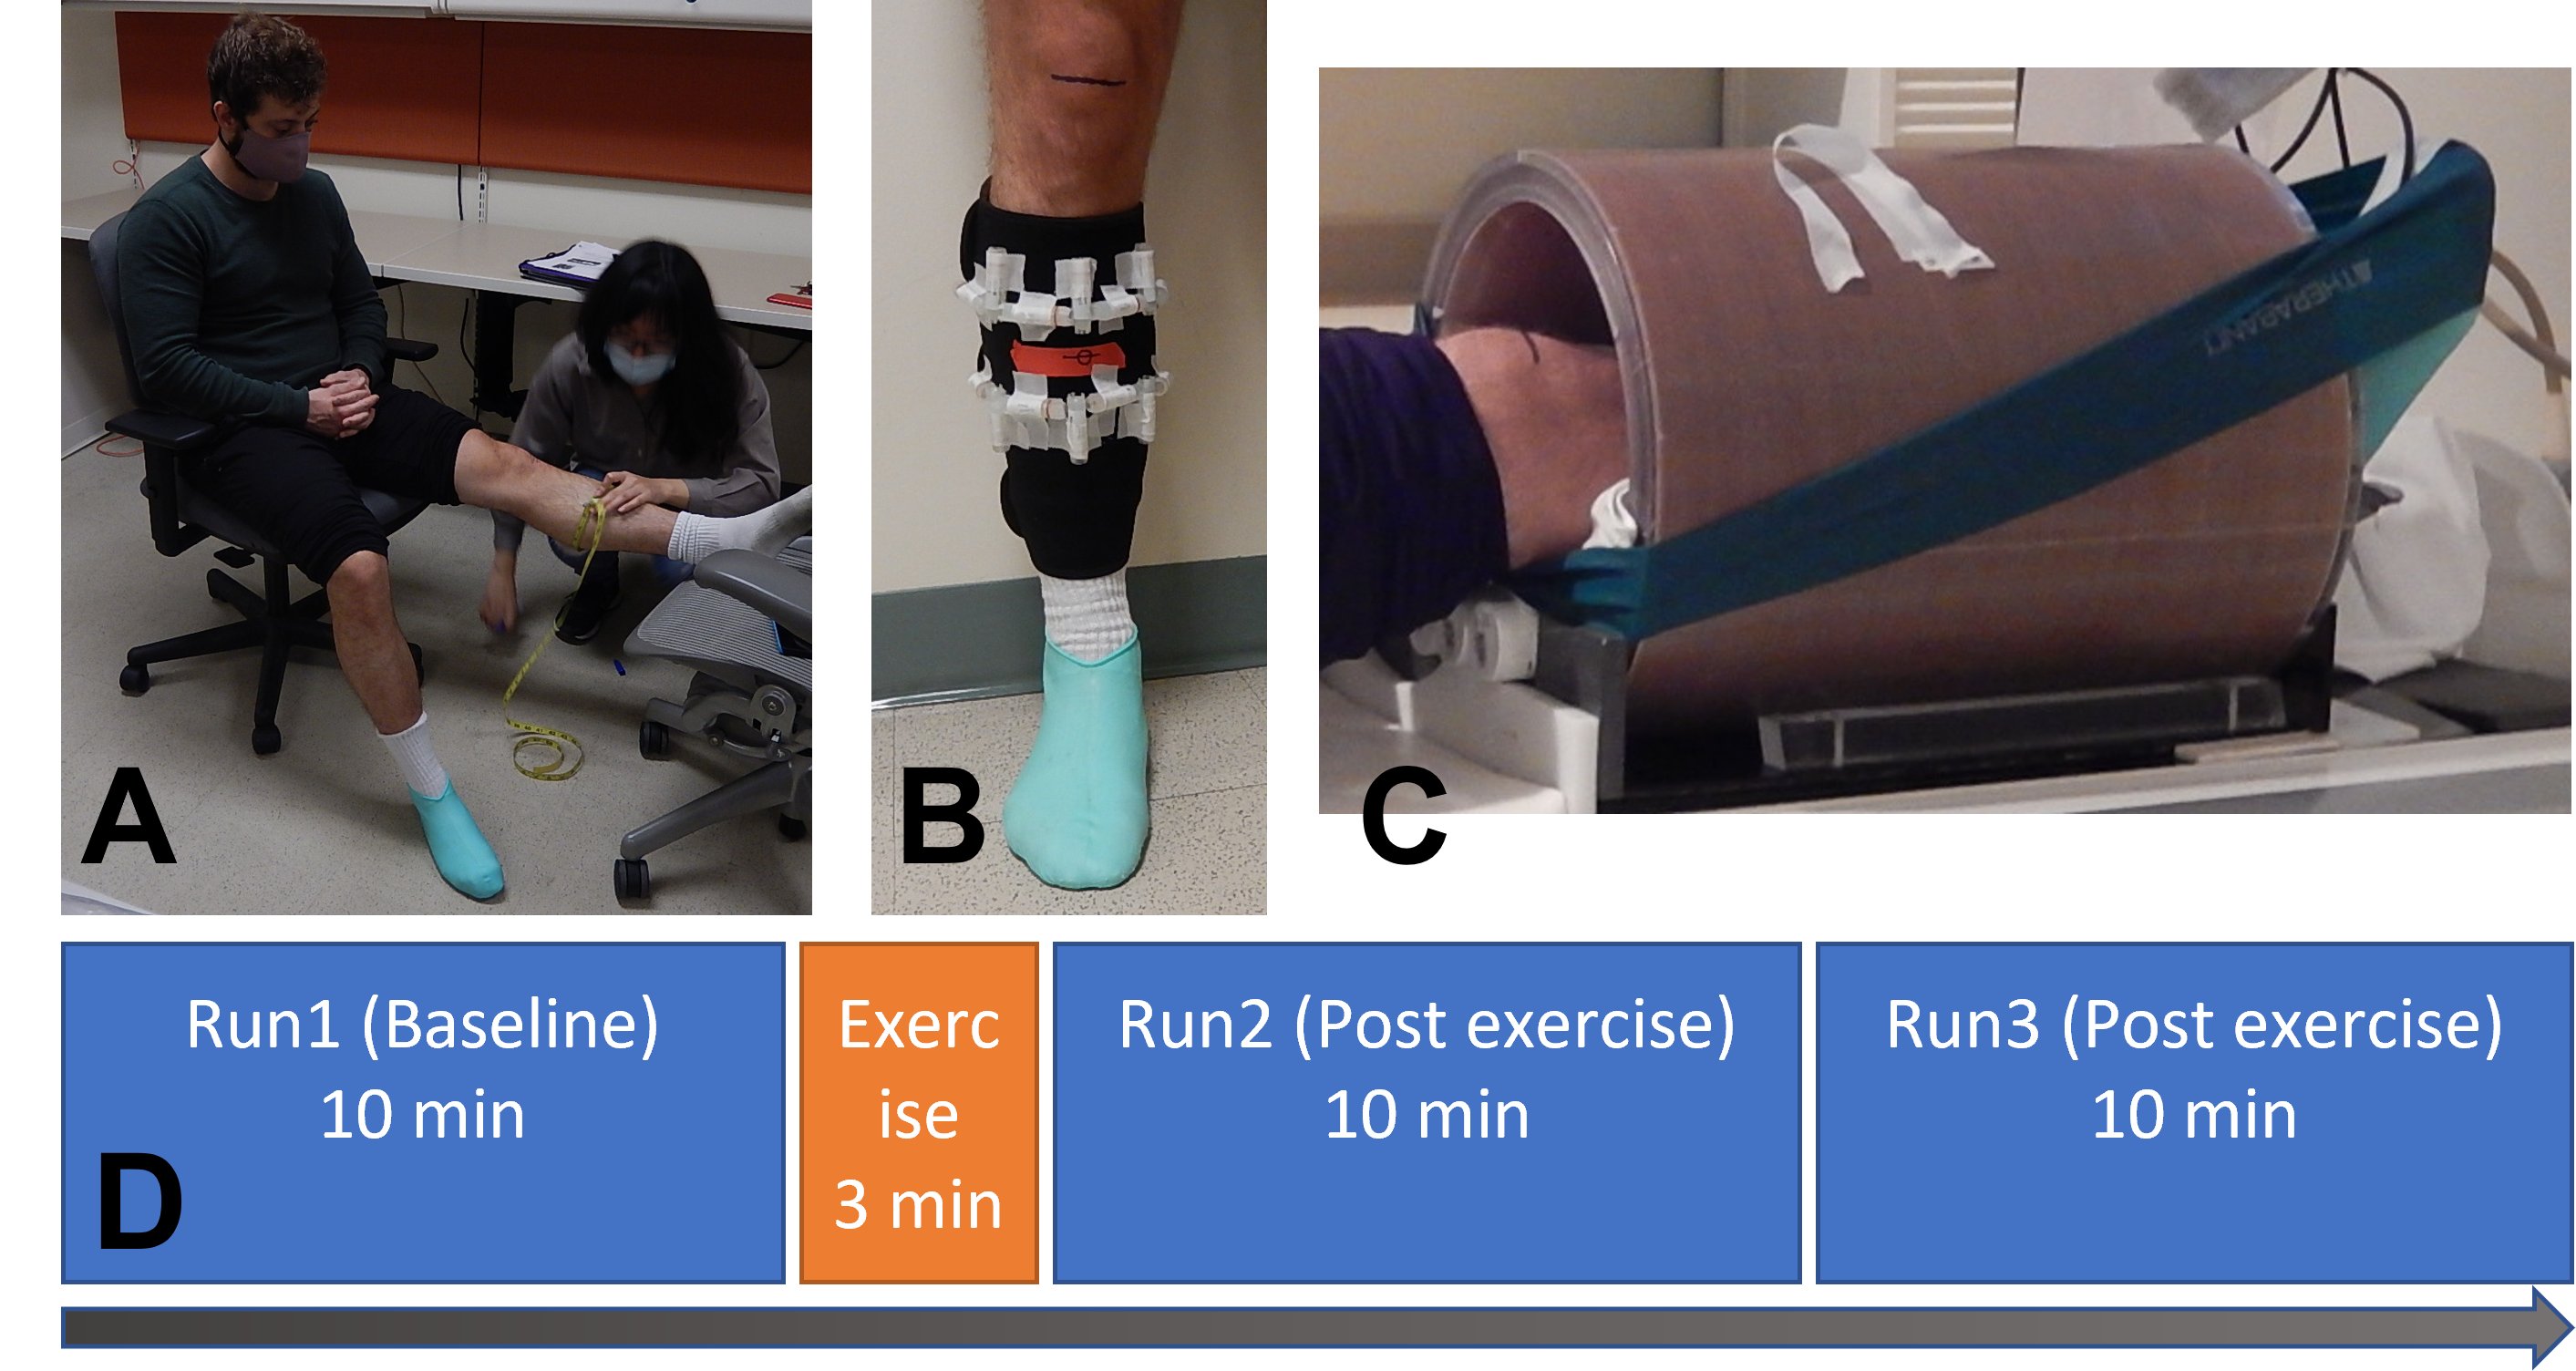
Figure 2. Muscle exercise. (A) A marking of the target calf muscle. (B) Fiducial markers formed in two rings were attached to a fabric band. The fiducial markers were 2 cc tubes filled with 2% agarose and 160mM sodium. (C) A sodium RF coil and the elastic band (Theraband non-latex) for exercise. (D) An exercise protocol. The exercise is 18 repeats of ‘push and hold’ (6 sec) and ‘relax’ (4 sec) of the plantar. The task was paced by an audio command generated from an ePrime program.
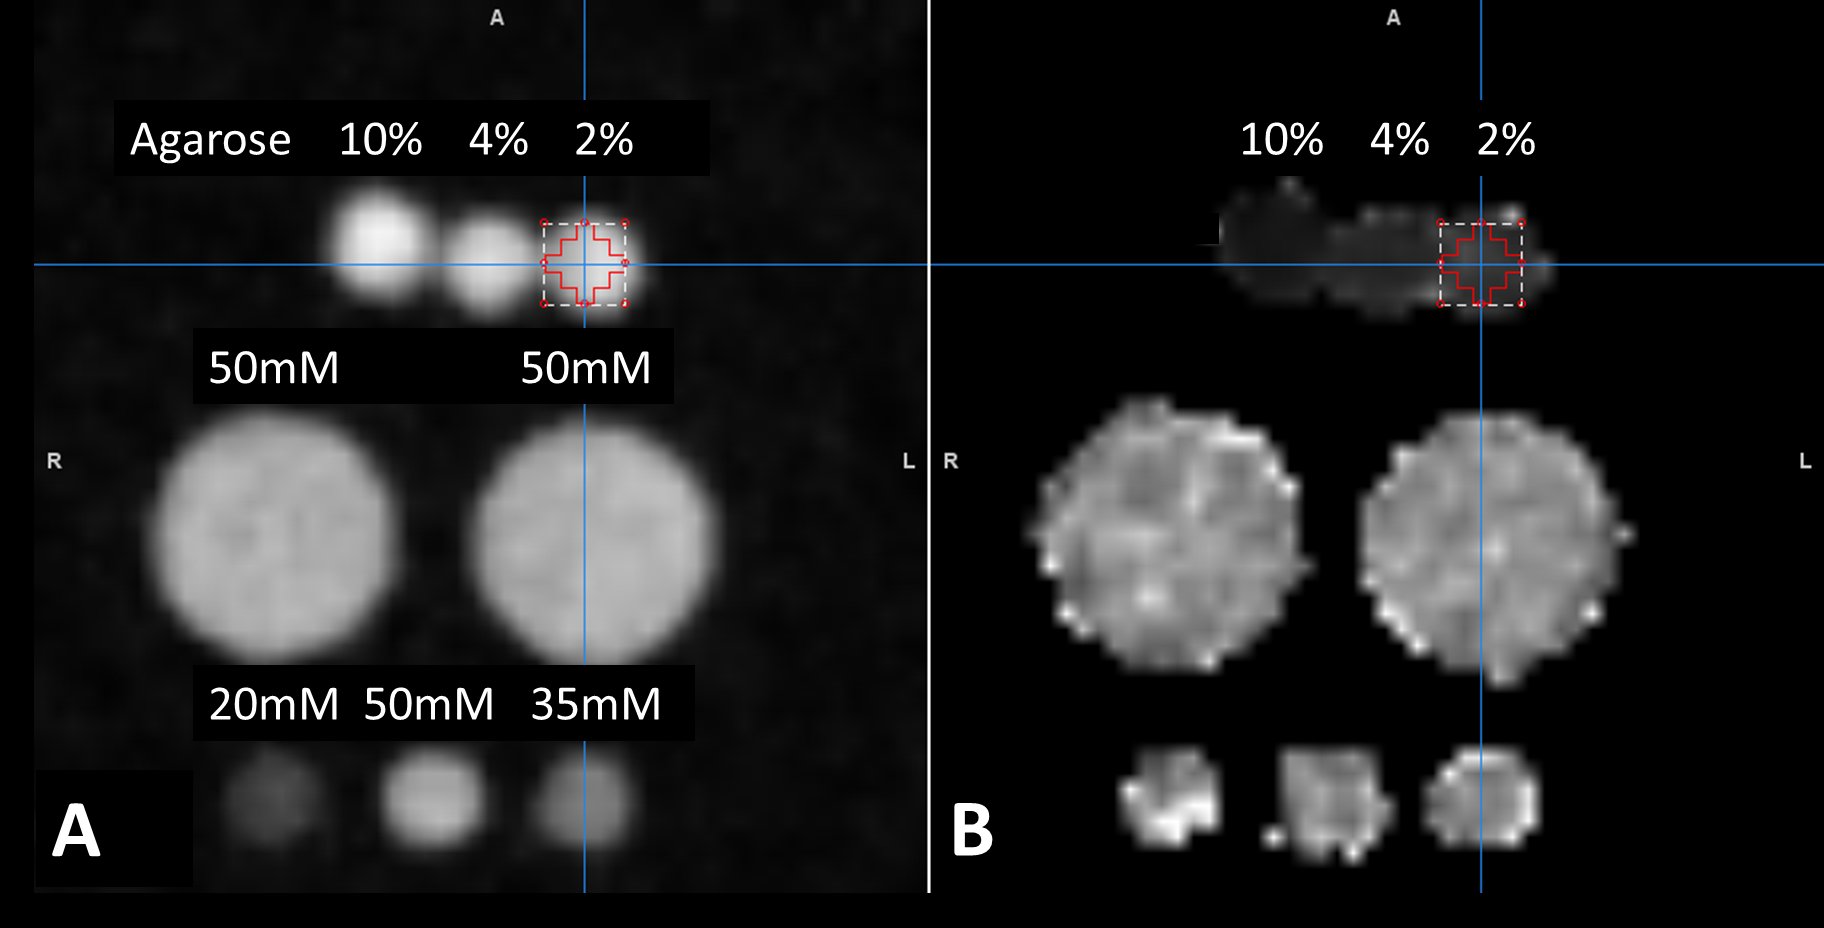
Figure 3. Sodium phantom images: (A) Sum-of-square magnitude images of the first 3 echoes, (B) Estimated T2* map using a mono-exponential curve fitting. The 3 small tubes at the bottom row are the reference sodium solutions with 3 different sodium concentrations. The two large tubes at the middle row are sodium solutions to load the RF coil. The small tubes at the top row are filled with different concentrations of agarose. The T2* of agarose tubes were 6.4, 12.0, and 17.2 ms for 10%, 4%, and 2% agarose, respectively.
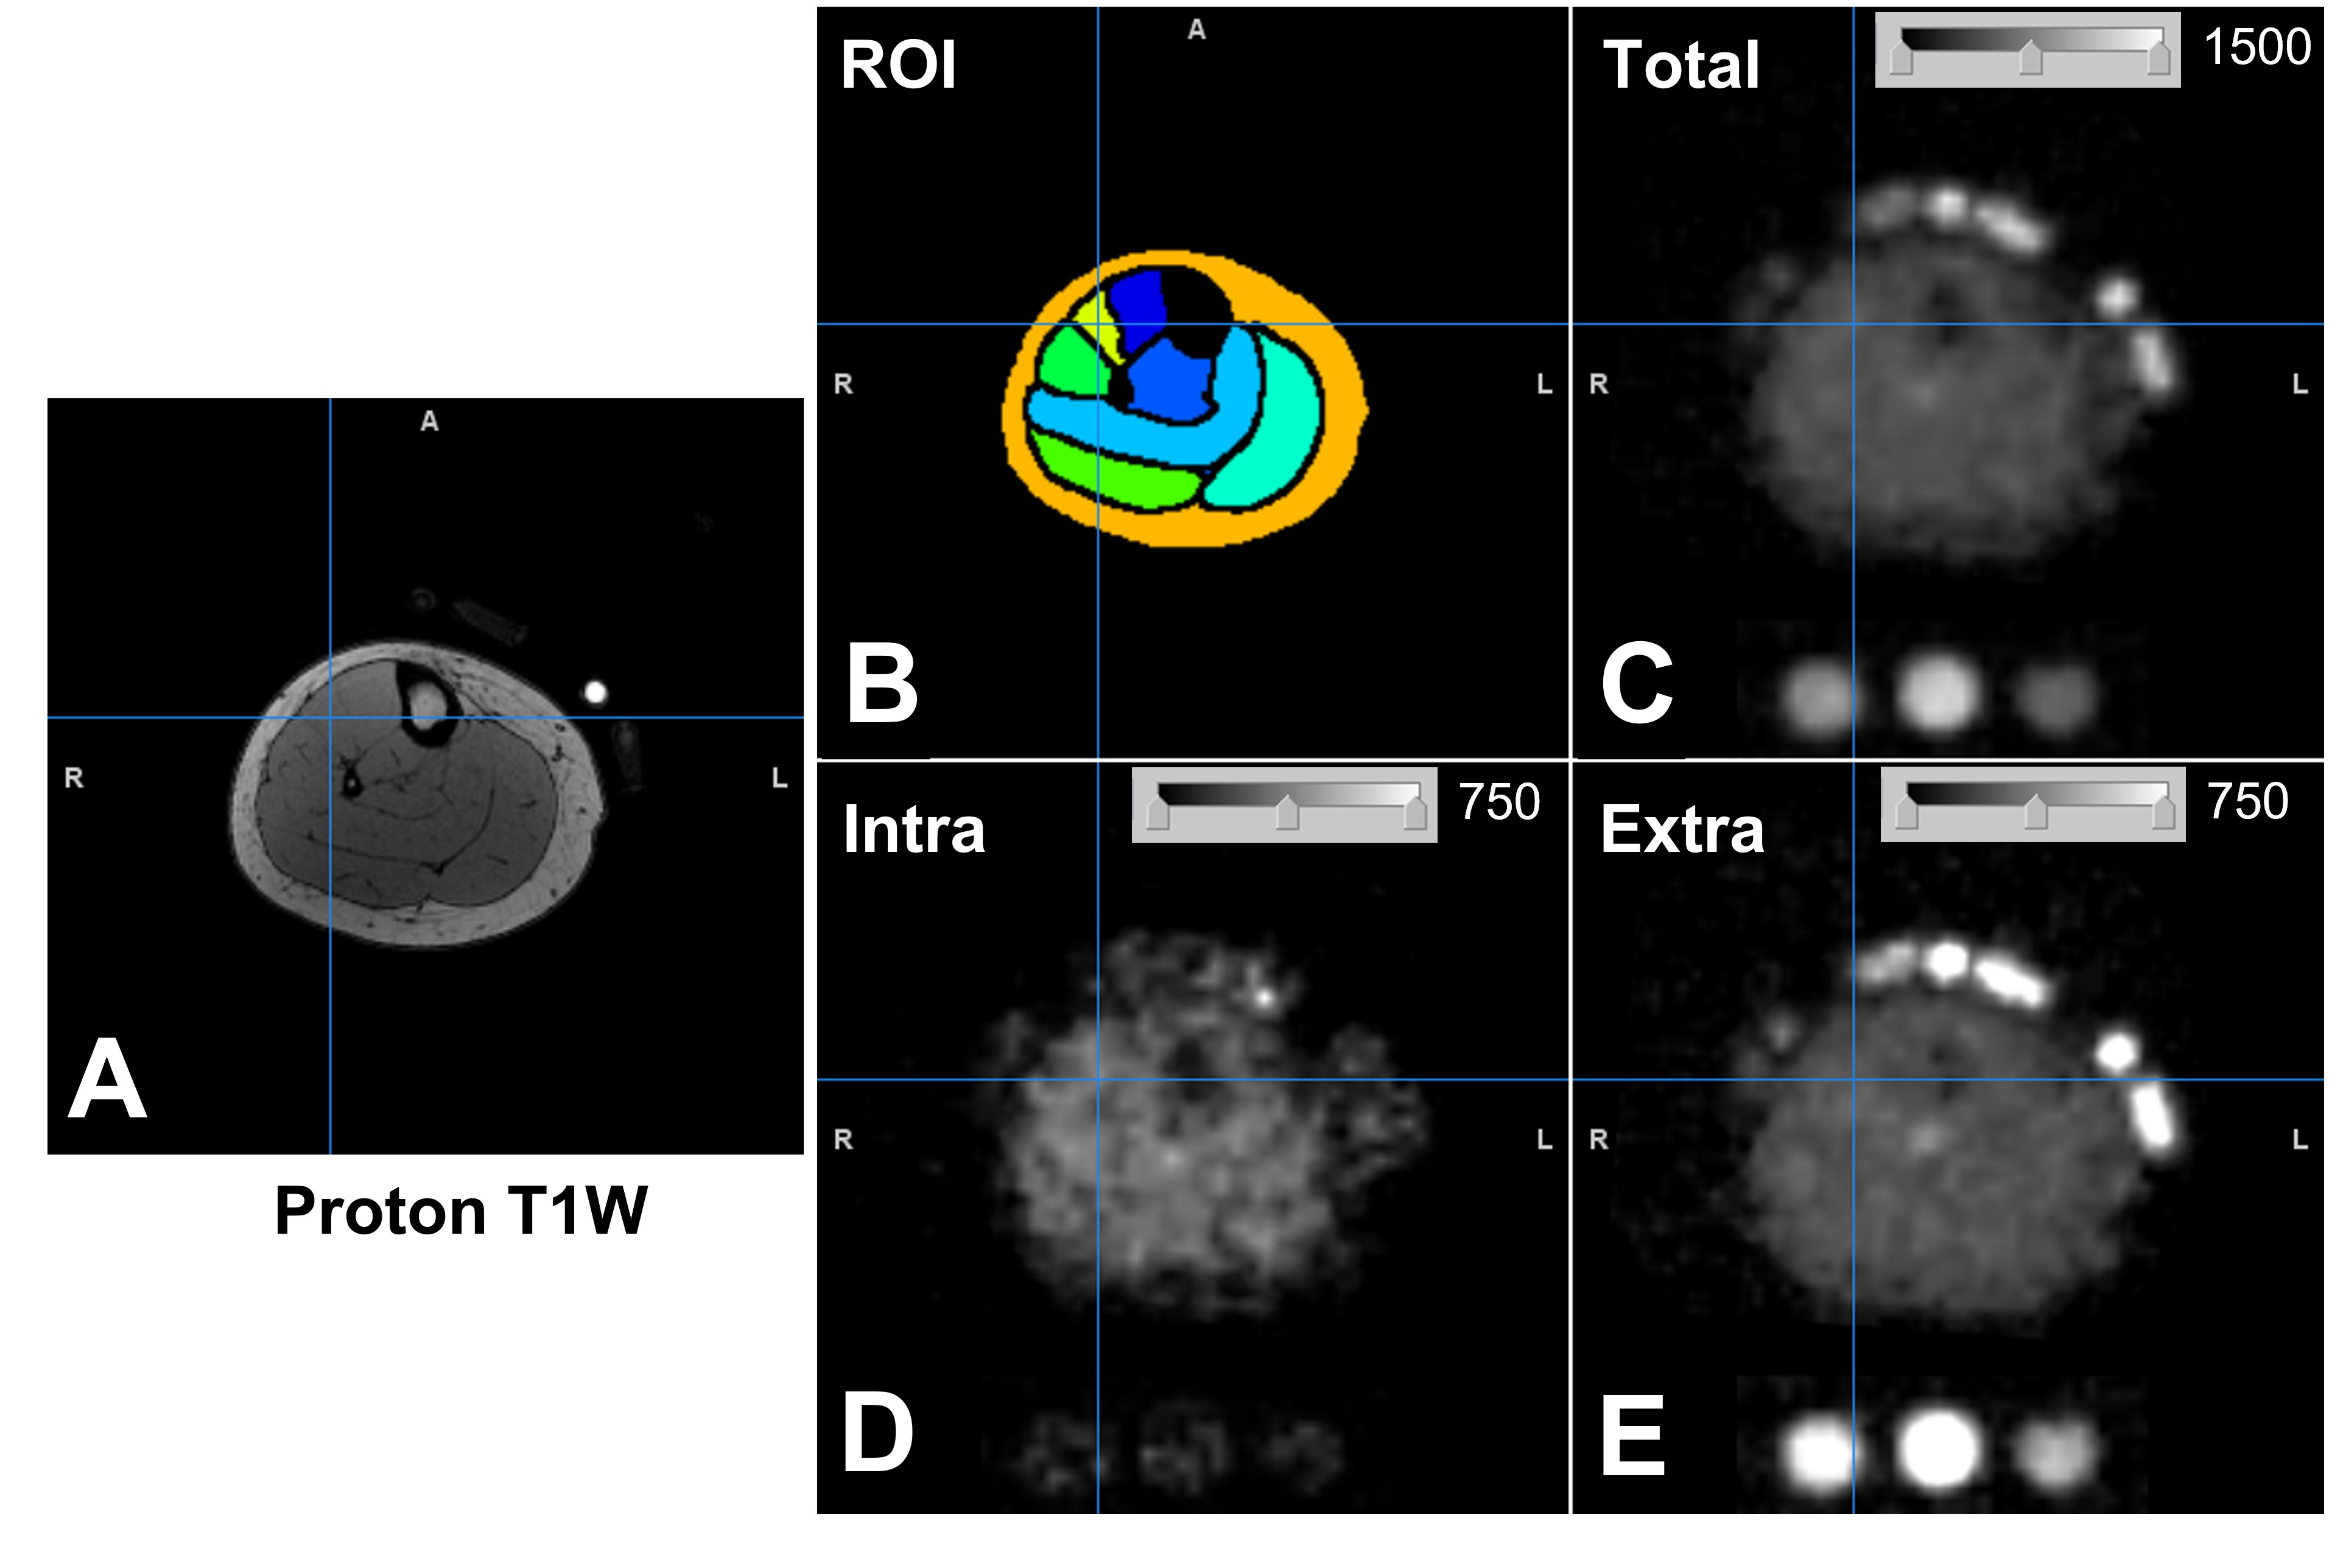
Figure 4. Proton and sodium images of the right lower leg of 1 healthy participant. (A) Proton T1-weigthed image. (B) Manual definition of region of interest (ROI) on the proton image. (C) Total sodium signal intensity of the sodium image. The sodium signals of this image were subsequently separated into intracellular (D) and extracellular (E) sodium signals using bi-exponential curve fitting. The gray-scale bar inserted in the sodium images denotes the display window range.
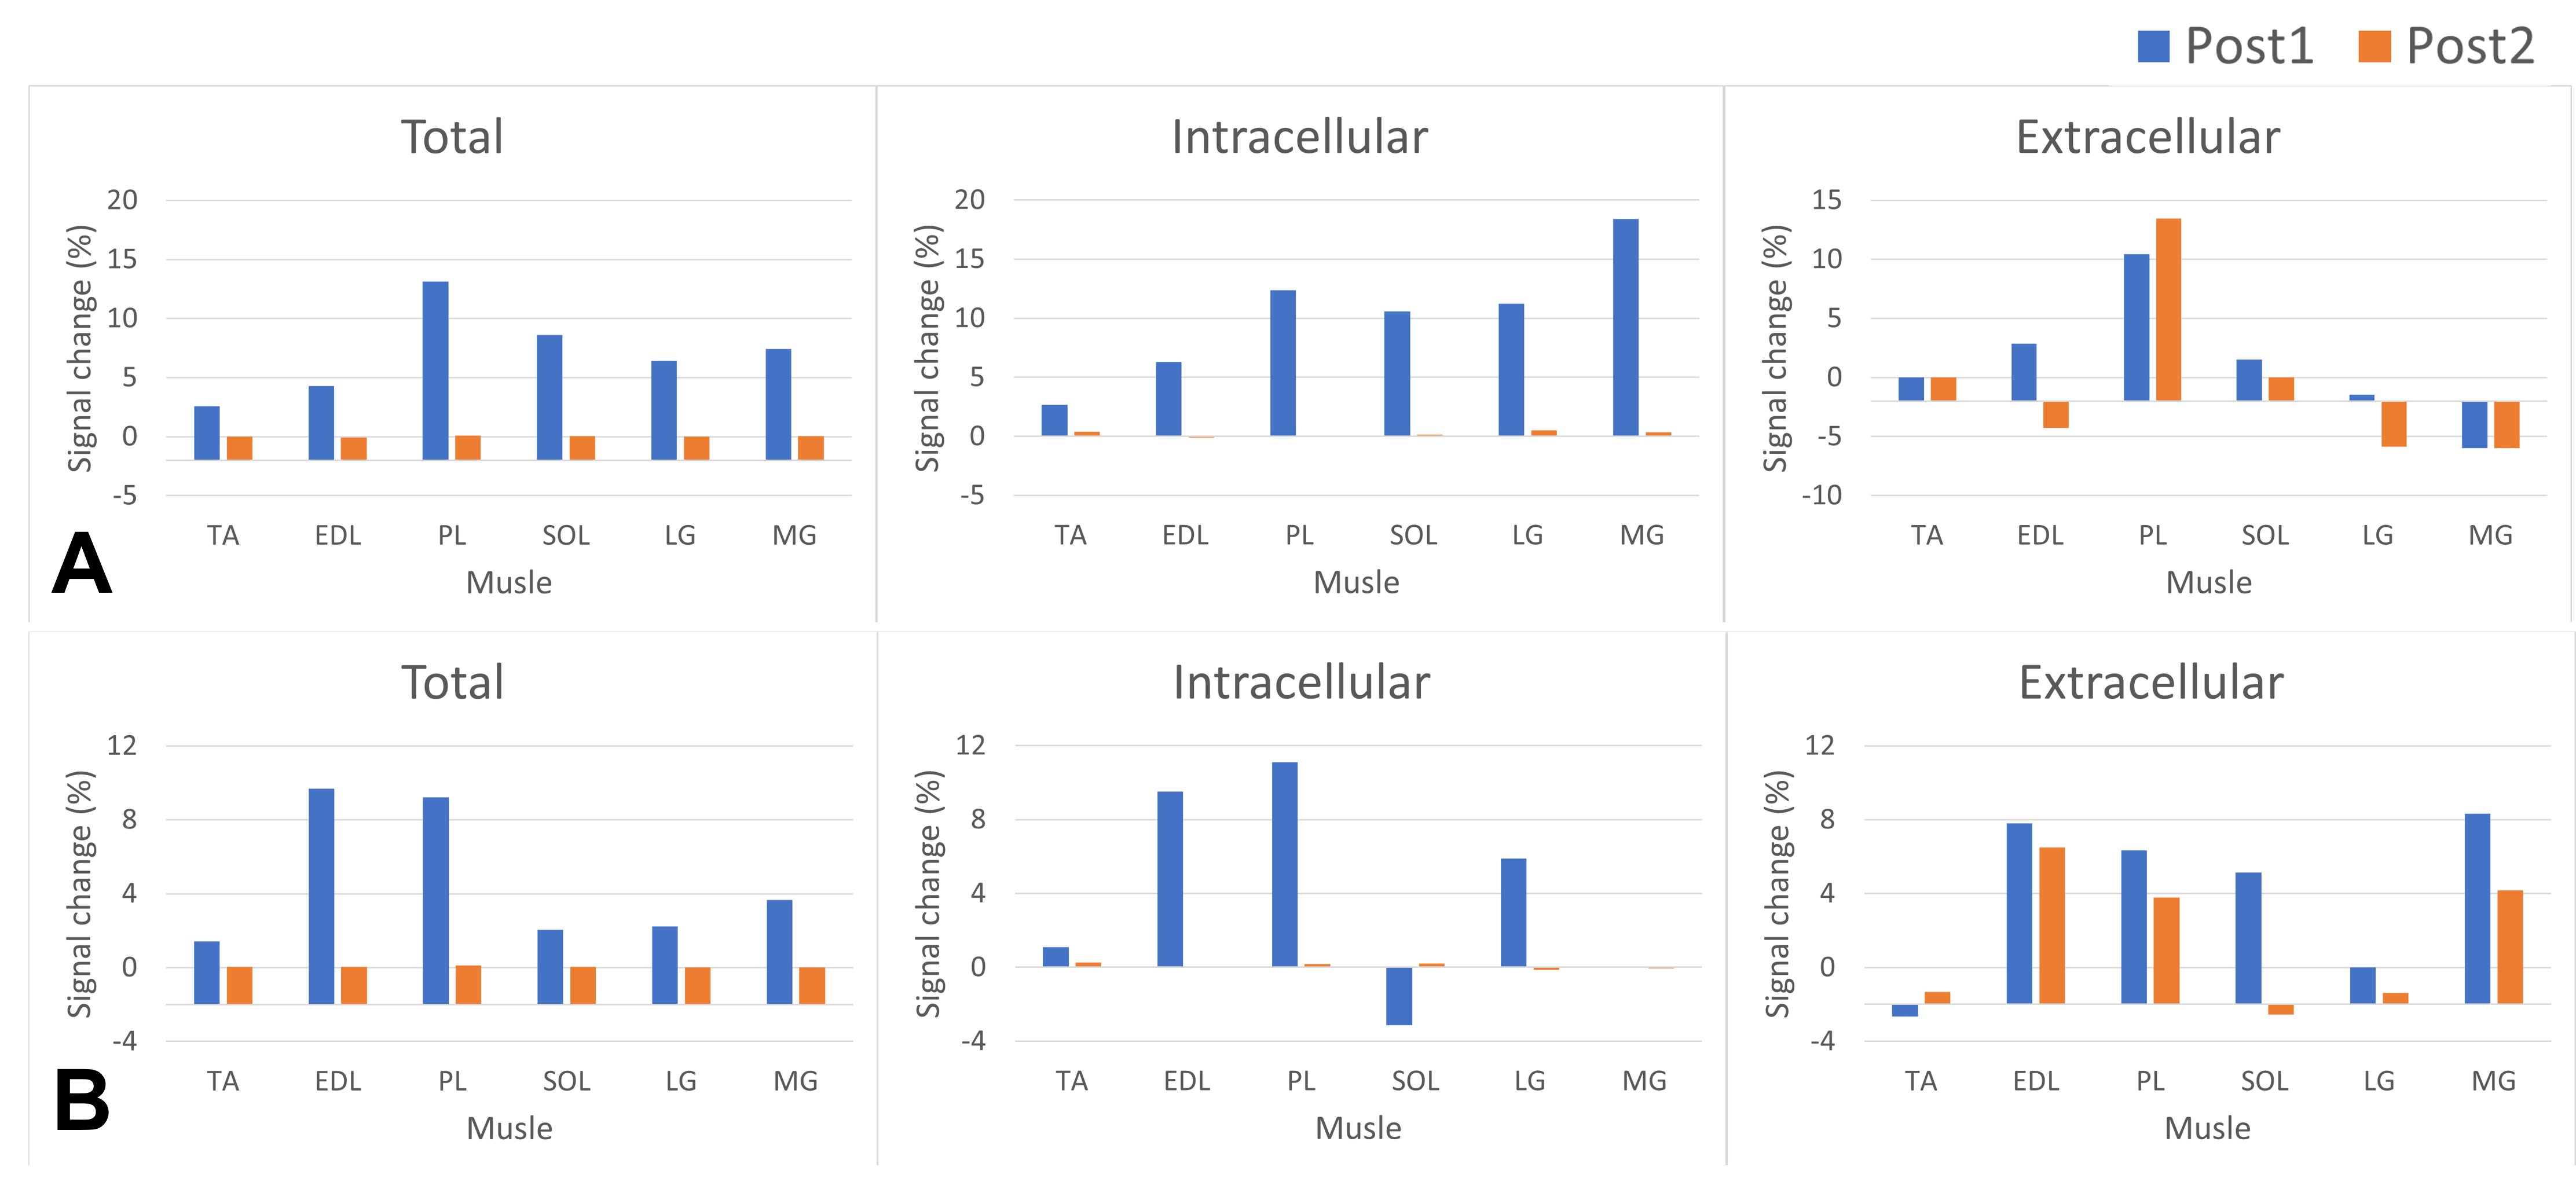
Figure 5. Sodium changes relative to the baseline sodium in different muscles of two participants (the top row A is from the female participant). The sodium was increased in EDL and PL muscles that were expected to be used in the plantar extension exercise. The intracellular sodium recessed at the second post-exercise denoted as Post2 while the exercise-induced change in extra-cellular sodium persisted longer. Muscle annotations are Tibialis Anterior (TA), EDL and EHL (EDL), Peroneus Longus (PL), Soleus (SOL), Lateral Gastrocnemius (LG), and Medial Gastrocnemius (MG).