2826
Restoration of Missing or Erroneous Muscle Fiber Tracking Data Using Smoothed Polynomial Coefficients1Stephens Family Clinical Research Institute, Carle Health, Urbana, IL, United States, 2Carle Clinical Imaging Research Program, Carle Health, Urbana, IL, United States, 3Amsterdam University Medical Center, Amsterdam, Netherlands, 4Biomedical Engineering, Vanderbilt University, Nashville, TN, United States
Synopsis
Diffusion-tensor tractography is used to quantify functionally relevant muscle architectural variables, including fiber tract length, orientation, and curvature. However, image noise and artifacts cause positional errors in the fiber tracking points and may cause tracts to terminate prematurely. The effect of the points’ positional errors on estimates of muscle fiber curvature can be mitigated through the use of polynomial fitting. Here we test several approaches for smoothing the spatial field of polynomial fitting coefficients and reconstructing missing or shortened-length fiber tracts. We show that median filtering of the polynomial coefficients retains additional fiber tracts without altering the median architectural properties.
Introduction
Muscle architecture, defined as the geometric arrangement of muscle fibers with respect to the axis of force generation, affects several physiological and mechanical aspects of muscle contraction1. Diffusion-tensor muscle fiber tractography is used to reconstruct this architecture and quantify functionally relevant variables such as fiber tract length, orientation, and curvature2. However, image noise and artifacts cause positional errors in the fiber tracking points and may cause tract propagation to terminate prematurely. The effect of the points’ positional errors on estimates of muscle fiber curvature can be mitigated through the use of polynomial fitting3. Here we show that the distribution of polynomial fitting coefficients across the entire fiber tract population can further be used to reconstruct fiber tracts that failed to propagate fully.Theory
In the MuscleDTI_Toolbox4, muscle fiber tracts are propagated from a matrix of seed points defined across the surface of the aponeurosis of muscle fiber insertion. After converting the fiber tract points to units of length, the tracts’ X, Y, and Z positions can be fitted to Nth order polynomials, where N is typically 2-4. After performing this procedure for every fiber tract in the dataset, the spatial distribution of the coefficients can be visualized (Figure 1A). Here we test several methods for using the polynomial coefficients from full-length fiber tracts to estimate the corresponding coefficients for missing or prematurely terminated tracts:- 2D Fitting: The distribution of coefficients across the seed point matrix is fitted to a 2-dimensional polynomial function, C = F(r,c), where r and c are the row and column positions of the seed points and the fit is weighted by using only the data from full-length tracts (Figure 1B).
- Interpolation: Missing coefficients are estimated using either nearest neighbor or natural scattered interpolation to the seed points’ X, Y, and Z positions, weighting the interpolation by using only the data from full-length tracts.
- Median filtering: The distribution of coefficients across the seed point matrix is 2D median filtered using a specified kernel size (Figure 1C)
- Gaussian filtering: The distribution of coefficients across the seed point matrix is convolved with a Gaussian function having a specified variance.
Methods
Image Acquisition and Analysis: These procedures were approved by the local Institutional Review Board and the participants (n=5) provided written informed consent. Quantitative fat/water and diffusion-tensor MRI data were obtained from the lower leg using a 3T Philips Elition MR scanner and processed using previously described methods4. Briefly, this included a 24-direction diffusion encoding scheme with b=450 s/mm2; image registration using a multislice, 2D Demons method; denoising using anisotropic smoothing5; estimation of the diffusion tensor; muscle fiber tractography in the tibialis anterior muscle; fiber tract smoothing using 3rd order polynomials; and architectural quantification/goodness selection.Evaluation of Fiber Reconstruction Approaches: Restoration of missing fiber tracts was performed using each of four methods1) 2D polynomial fitting, with orders of 4 and 6 tested; 2) Scattered interpolation, with nearest neighbor and natural interpolation tested; 3) Median filtering, with kernel sizes of 3, 5, and 7 pixels; and 4) Gaussian convolution, with variances of 3, 5, and 7 pixels. Outcomes were evaluated as follows:
- The number of fiber tracts in the original dataset, reconstructed dataset, and merged dataset (original fiber tracts with missing fiber tracts added from the reconstructed dataset) that met the goodness criteria were computed.
- The type (3,1) intraclass correlation coefficients (ICCs) were calculated between the tracts’ curvature, pennation angle, and fiber tract length values, at the intersection of tracts populating the original and reconstructed datasets.
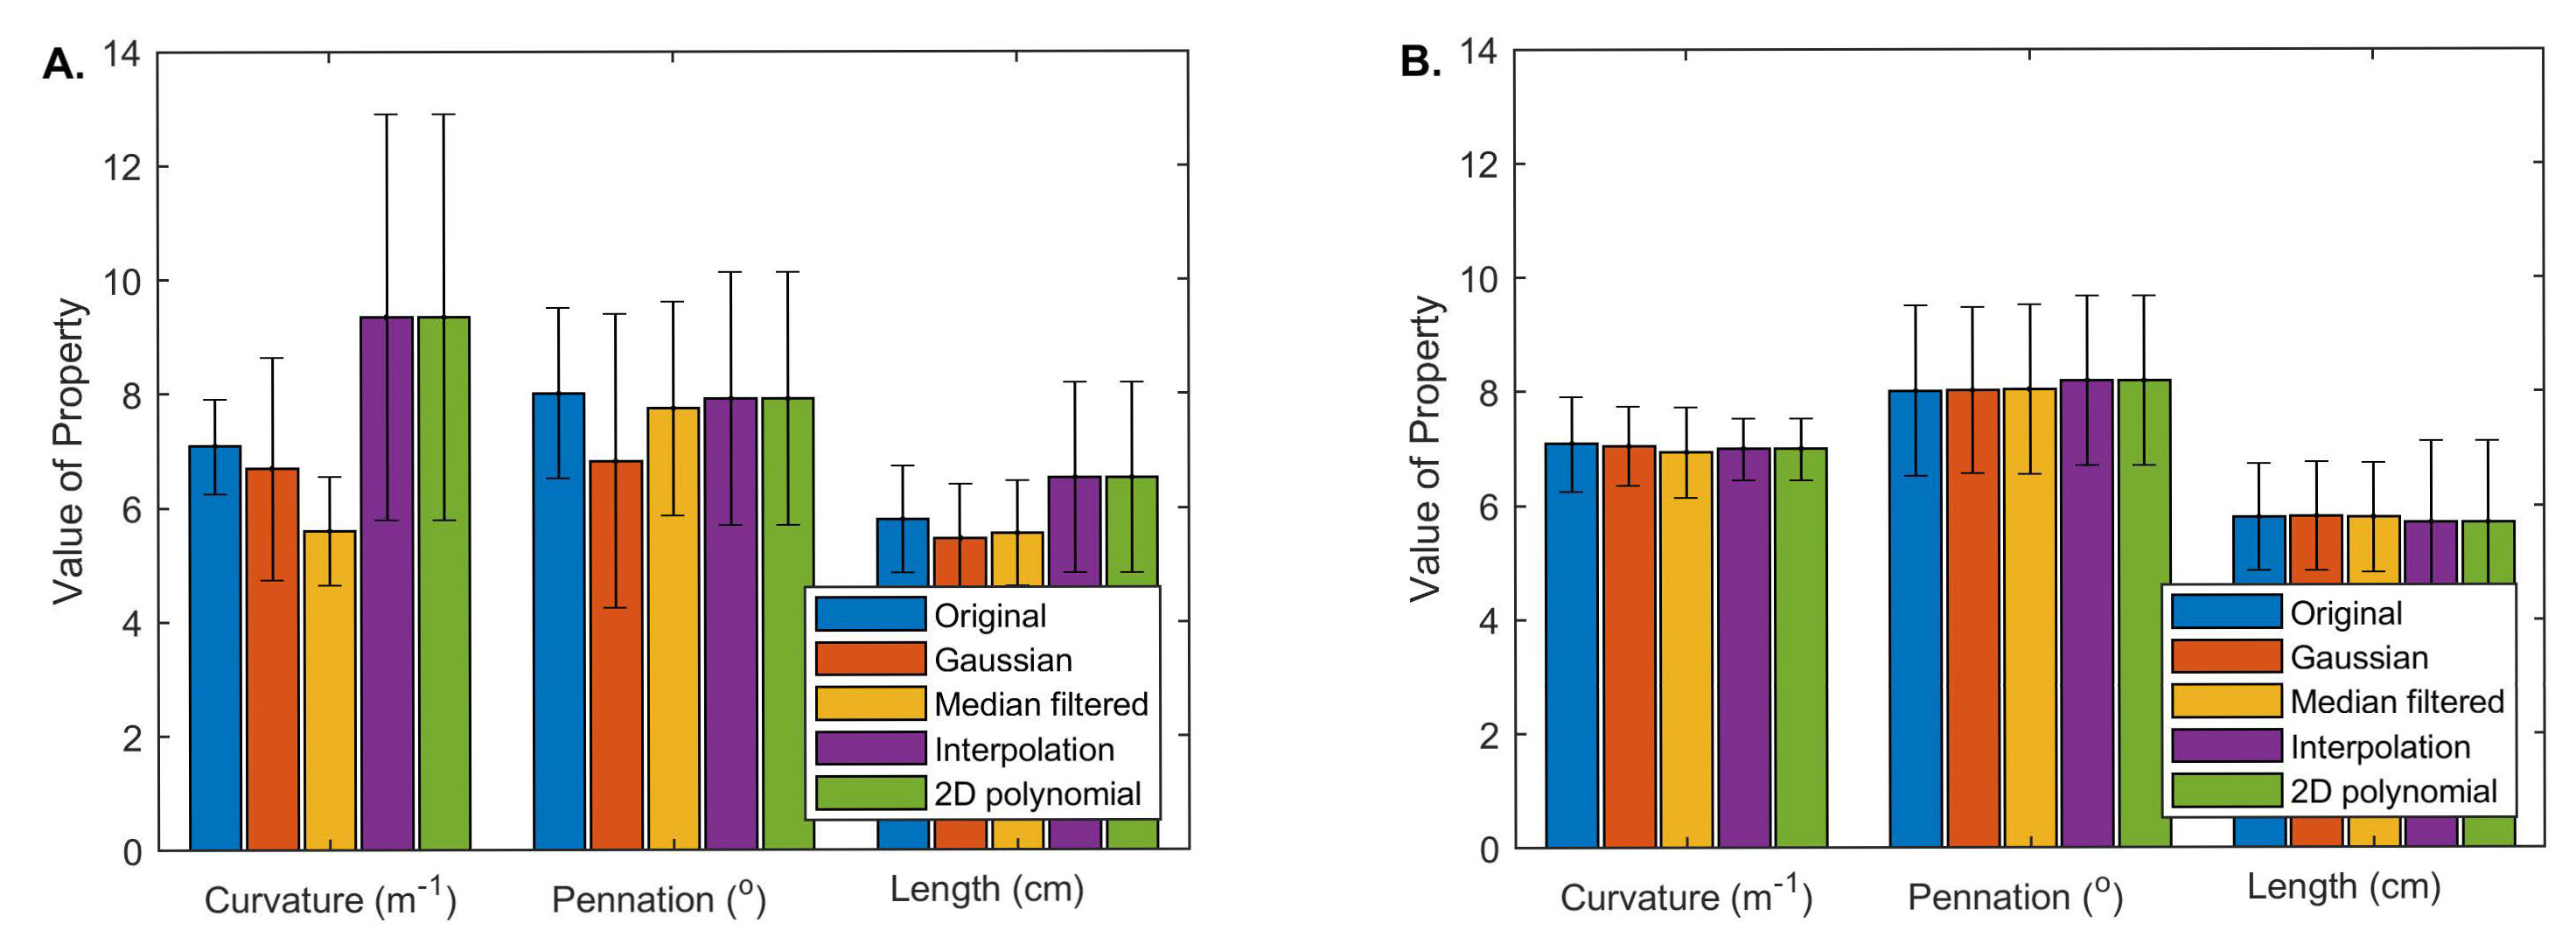
- The median and interquartile range were calculated for the curvature, pennation angle, and fiber tract length for the original, reconstructed, and merged datasets.
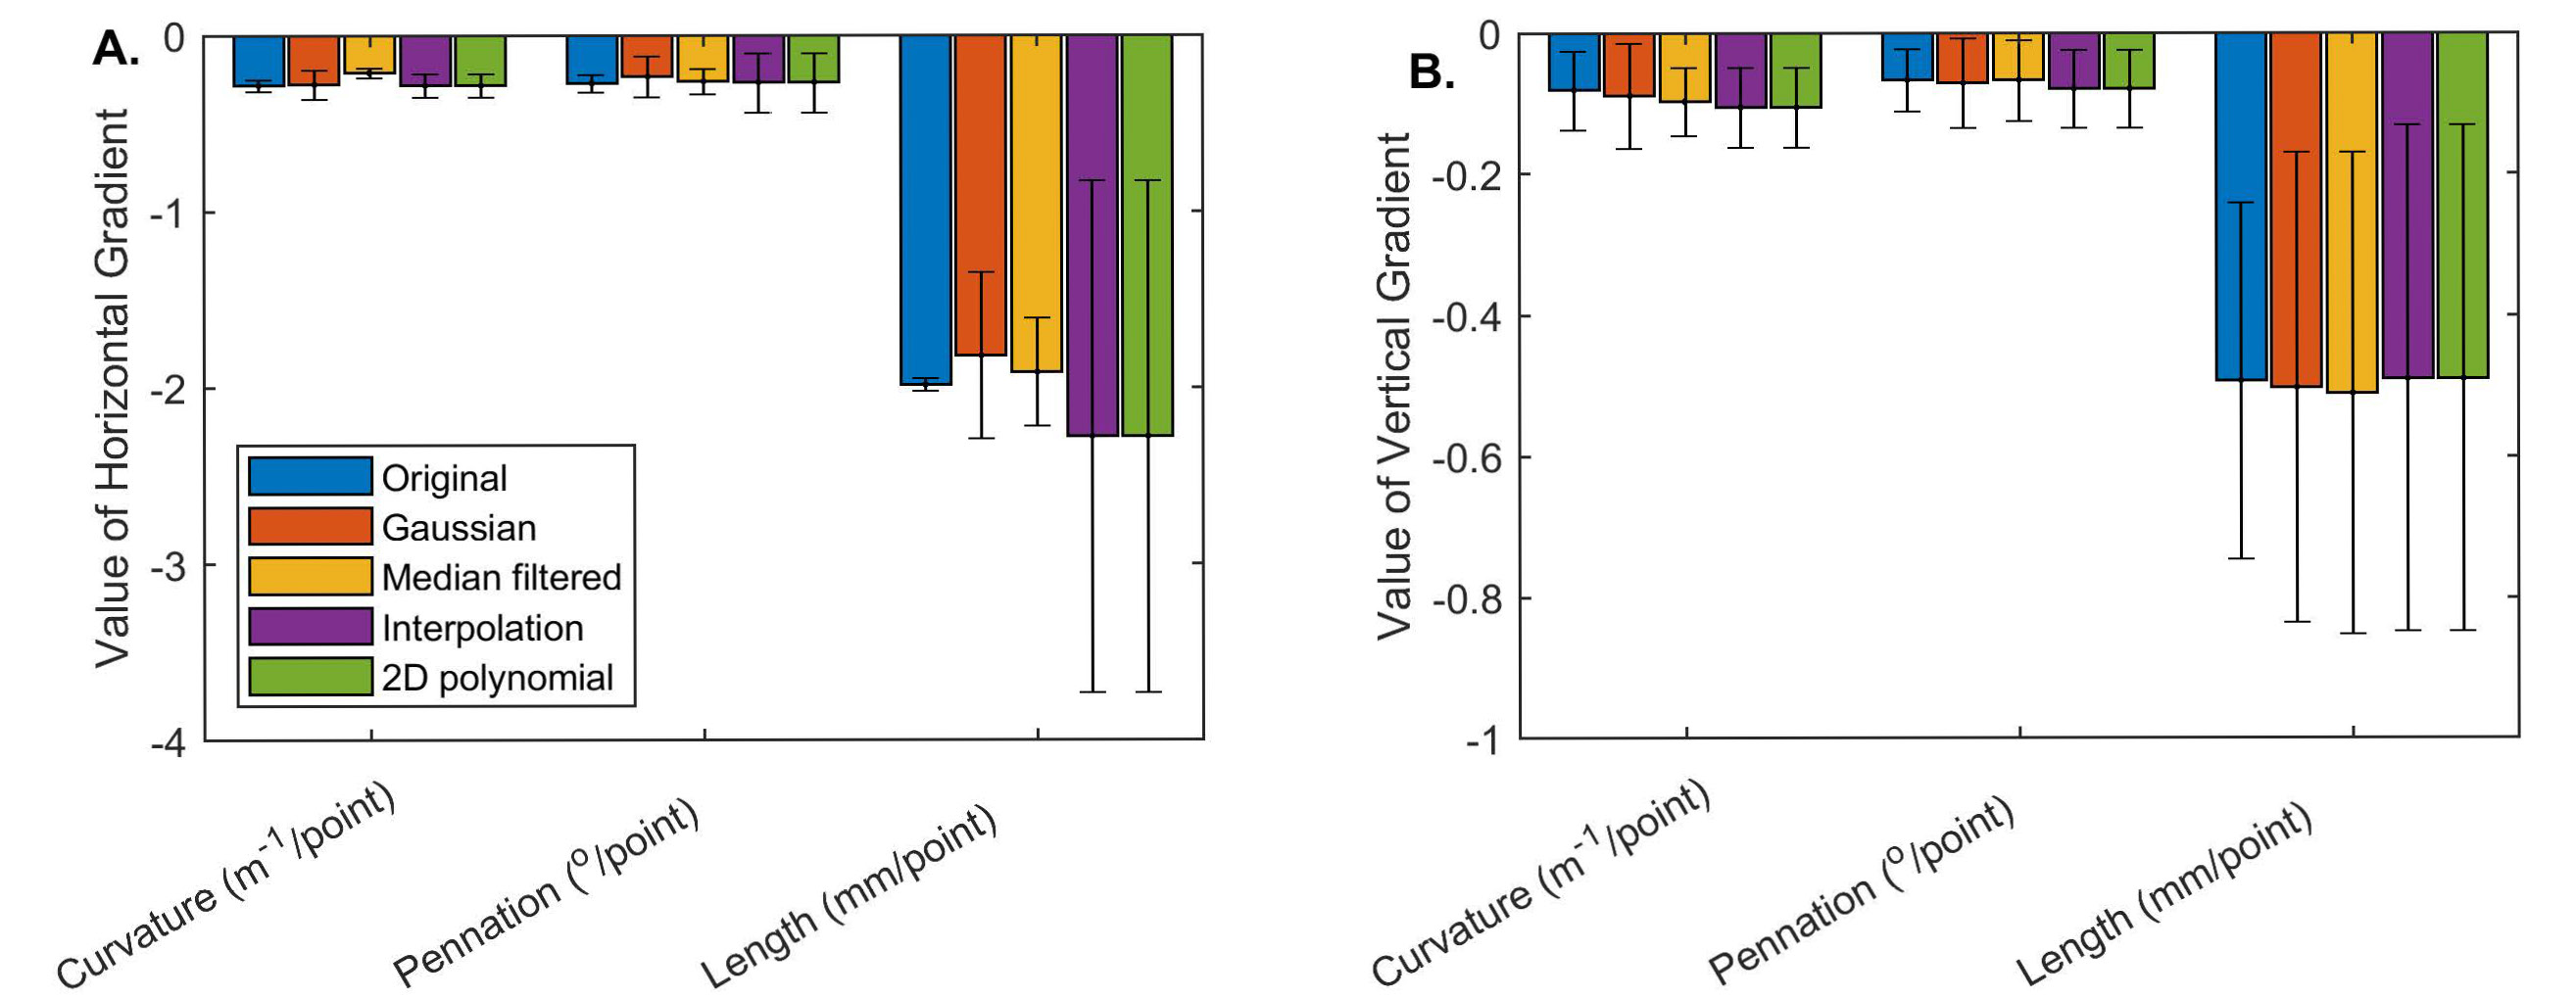
- The smoothness of spatial distributions of curvature, pennation angle, and length were computed as the mean gradients in the horizontal and vertical directions for the original, reconstructed, and merged datasets.
Results and Discussion
Figure 1 shows sample results for the original (E), reconstructed (F), and the merged (G) datasets. Figure 2 shows the number of tracts that met the goodness criteria in each dataset, with Gaussian convolution and median filtering increasing the number of retained tracts in the merged dataset. Figure 3 shows the ICC values between the intersection of the original and reconstructed fiber tract datasets, with median filtering being consistently the highest. Figure 4 shows the median values of the architectural parameters for the tracts in the original, reconstructed, and merged datasets, with the values generally unchanged except for an increase in the estimated curvature with polynomial and scattered interpolation. Figure 5 shows the horizontal and vertical gradients of the architectural parameters for the tracts in the original, reconstructed, and merged datasets; there were few differences having practical significance.Conclusion
Using median filtering to smooth polynomial coefficients and recover missing fiber tracts retained more fiber tracts and maintained good agreement between the median values and gradients in the spatial distributions of architectural properties. When the kernel size was varied, no practical differences were observed between the median values of the architectural properties.Acknowledgements
NIH/NIAMS 1 R01 AR073831References
1Lieber, R. L. & Ward, S. R. Skeletal muscle design to meet functional demands. Philos. Trans. R. Soc. B Biol. Sci. 366, 1466–1476 (2011).
2Damon BM, Froeling M, Buck AKW, Oudeman J, Ding Z, Nederveen A, Bush EC, Strijkers GJ. Skeletal muscle DT-MRI fiber tracking: Rationale, data acquisition and analysis methods, applications, and future directions. NMR in Biomedicine. 30m e3563, doi: 10.1002/nbm.3563. (2017).
3Damon, B. M., Heemskerk, A. M. & Ding, Z. Polynomial fitting of DT-MRI fiber tracts allows accurate estimation of muscle architectural parameters. Magn. Reson. Imaging 30, 589–600 (2012).
4Damon, B. M. et al. A MATLAB toolbox for muscle diffusion-tensor MRI tractography. J. Biomech. 124, 110540–110540 (2021).
5Ding Z, Gore JC, Anderson AW. Reduction of noise in diffusion tensor images using anisotropic smoothing. Magn Reson Med 53. 485–490 (2005).
Figures
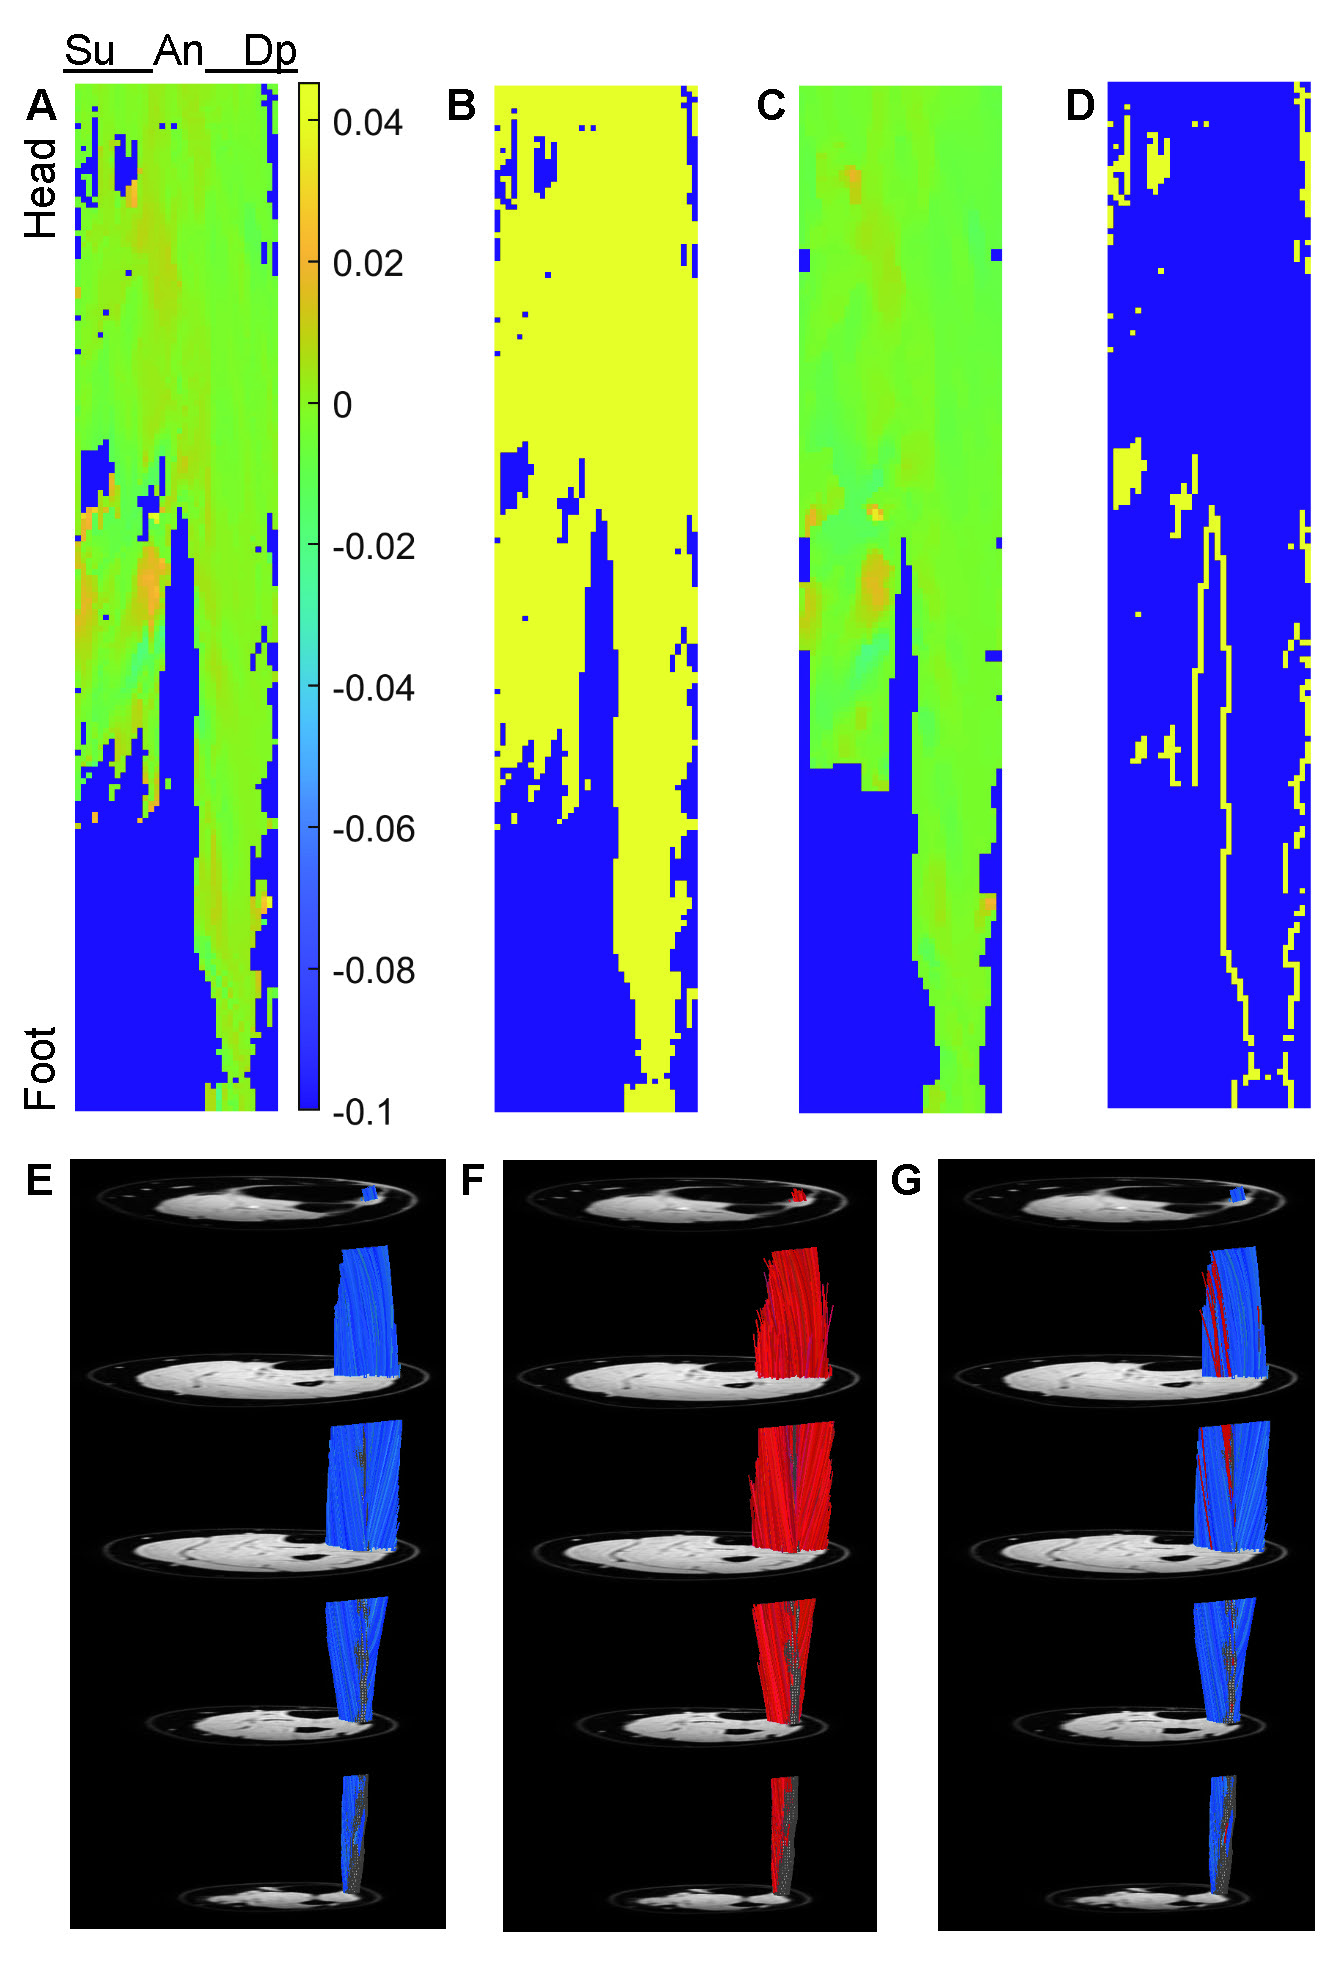
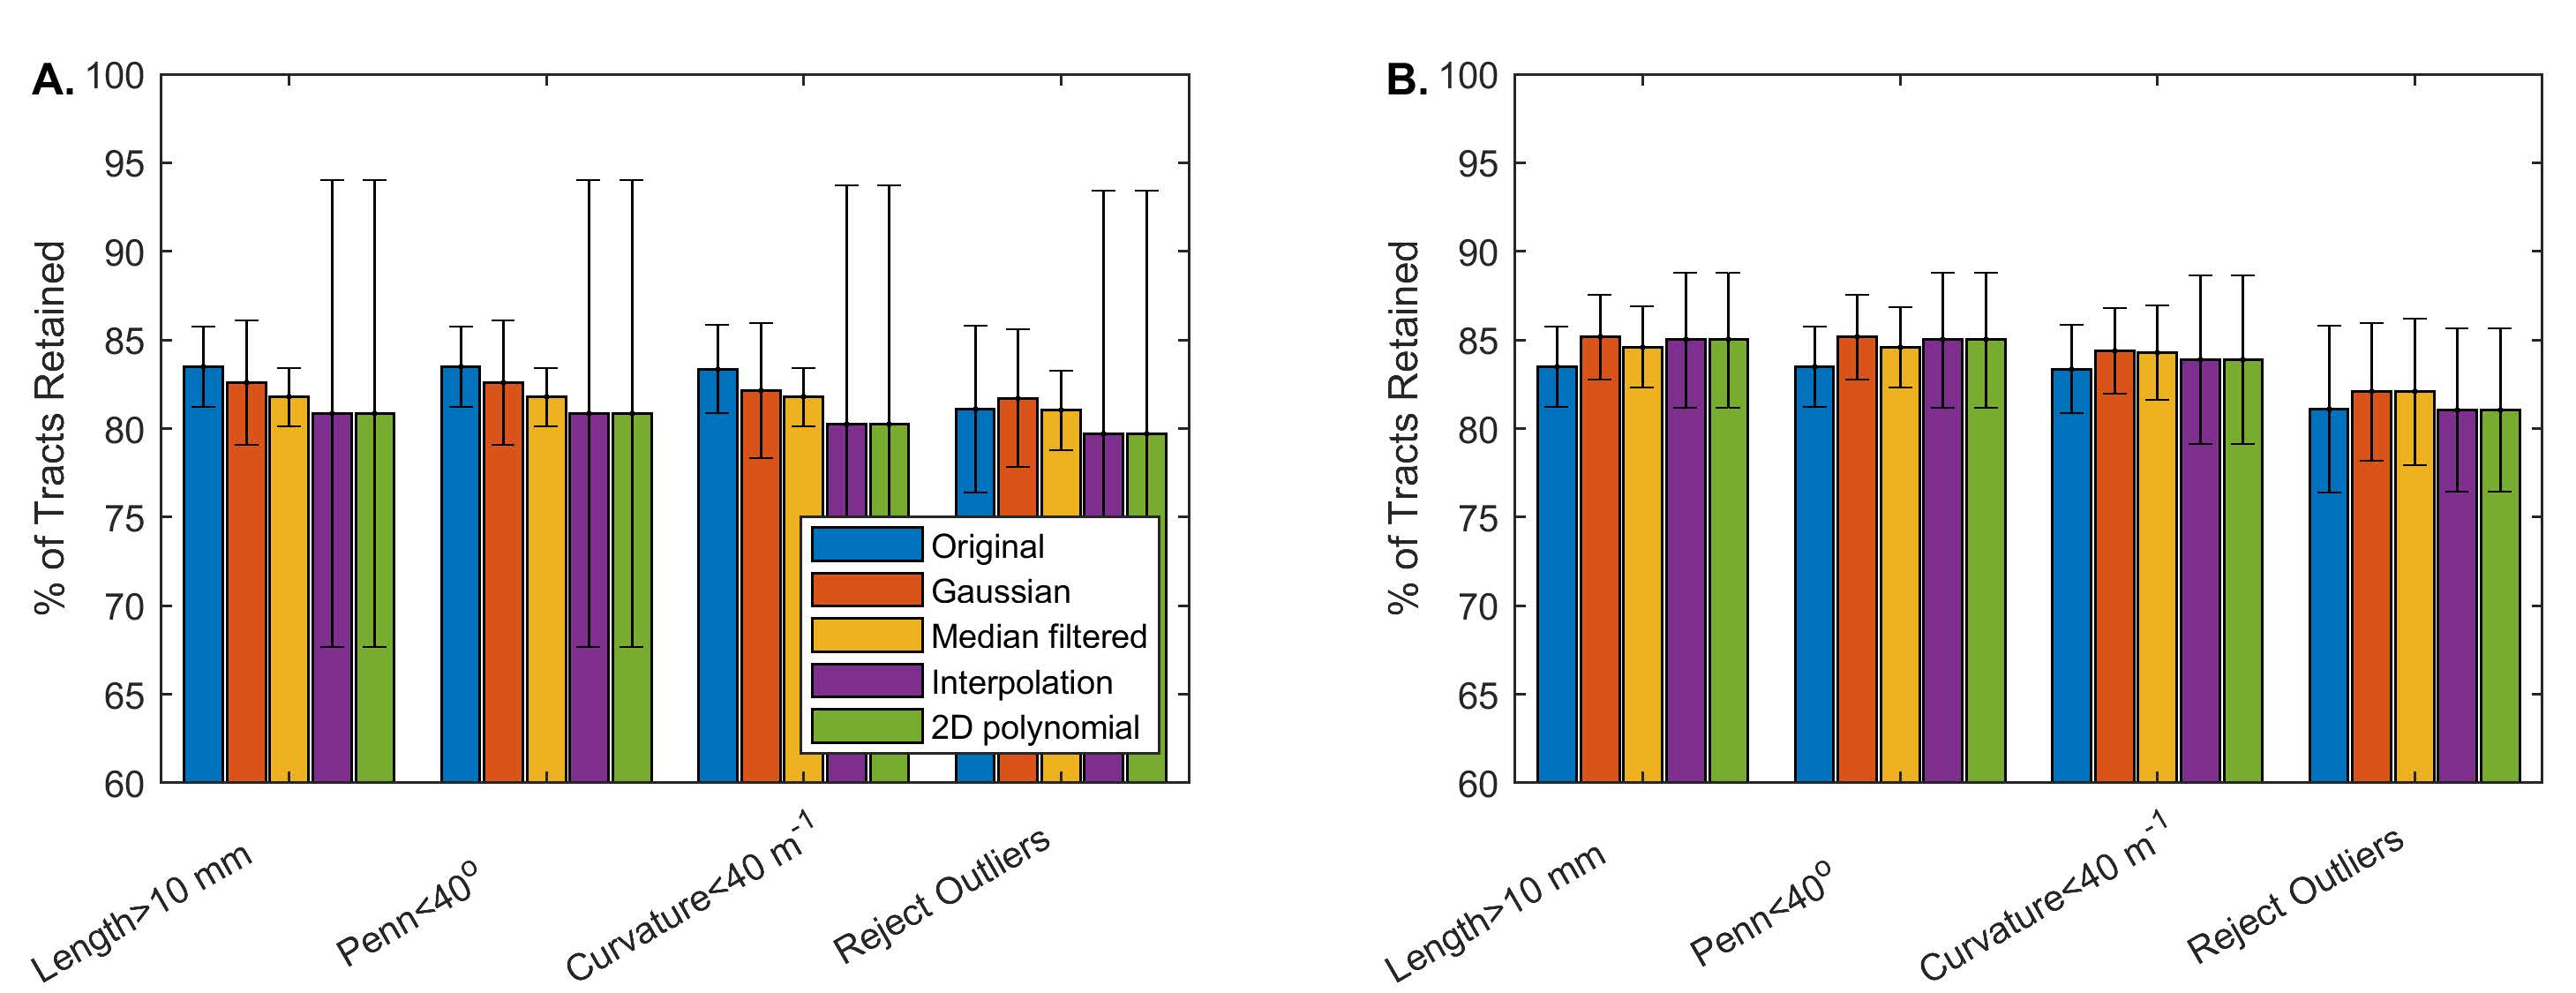
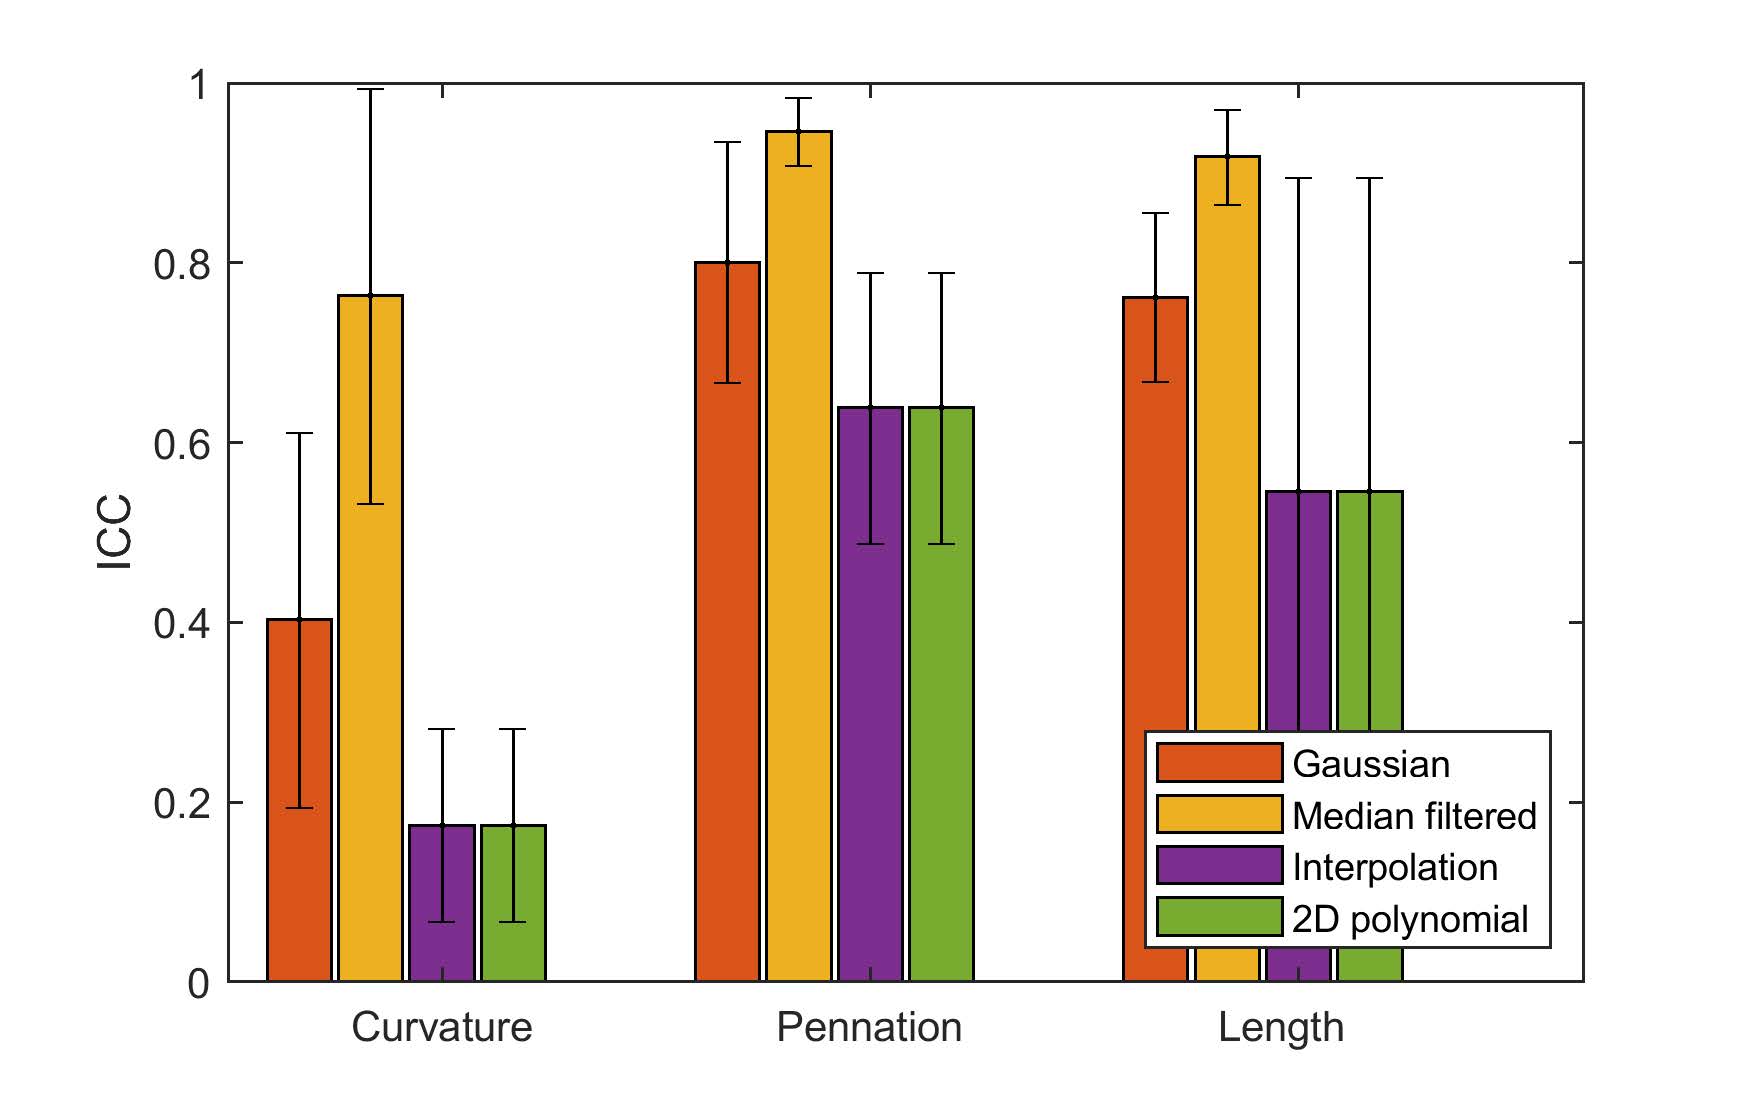
Figure 3. Mean ICC values. Correlations are shown for fiber tracts at the intersection of the original and reconstructed datasets, following Gaussian convolution, median filtering, scattered interpolation, and 2D polynomial fitting. Correlations for curvature, pennation angle, and length values are shown.