2824
Deep-learning based 3D segmentation of thigh muscle and classification of intramuscular fat on T1-weighted axial MRI1Radiology and Biomedical Imaging, University of California, San Francisco, San Francisco, CA, United States, 2Epidemiology and Biostatistics, University of California, San Francisco, San Francisco, CA, United States
Synopsis
Intramuscular fat is an important biomarker for knee osteoarthritis. Quantitative analysis on routine clinical imaging (T1-weighted MRI) is not feasible without pixel-level annotation, leading to the adoption of Goutallier classification, a semi-quantitative grading system that is time-consuming and has variable reproducibility. This study automates binarized Goutallier classification on patients (n=50) from the Osteoarthritis Initiative cohort with a two-staged process: deep-learning 3D segmentation of quadriceps and hamstrings (dice scores of 0.89[0.88,0.90] and 0.84[0.83,0.87], respectively) followed by histogram features for classification of intramuscular fat (0.93[0.92,0.95] AUROC). With model-reader kappa (0.64[0.61,0.68]) comparable to inter-reader kappa (0.61[0.59,0.64]), our approach shows promise for end-to-end automation.
Background
Strong associations between thigh adiposity, muscle quality. and knee osteoarthritis have been previously established1. Although a number of algorithmic approaches exist for quantifying intramuscular fat (intraMF) on magnetic resonance imaging (MRI), they rely on chemical shift-based water/fat separation sequences2-5. While standard sequences, such as T1-weighted MRI, do not allow true quantification of intraMF1, they can be used for semi-quantitative assessment by the Goutallier Classification (GC) system6-9; but prior studies also report that the GC system has moderate interobserver variability and can be time-consuming10. Deep learning is a promising technology for automated and consistent analysis of fatty infiltration, with notable examples from the supraspinatus muscle11. In this study, we propose a two-staged pipeline that leverages deep learning for 3D segmentation of thigh muscle, followed by computer assisted classification of intraMF for end-to-end automated analysis of thigh muscle, which has heretofore not been investigated.Methods
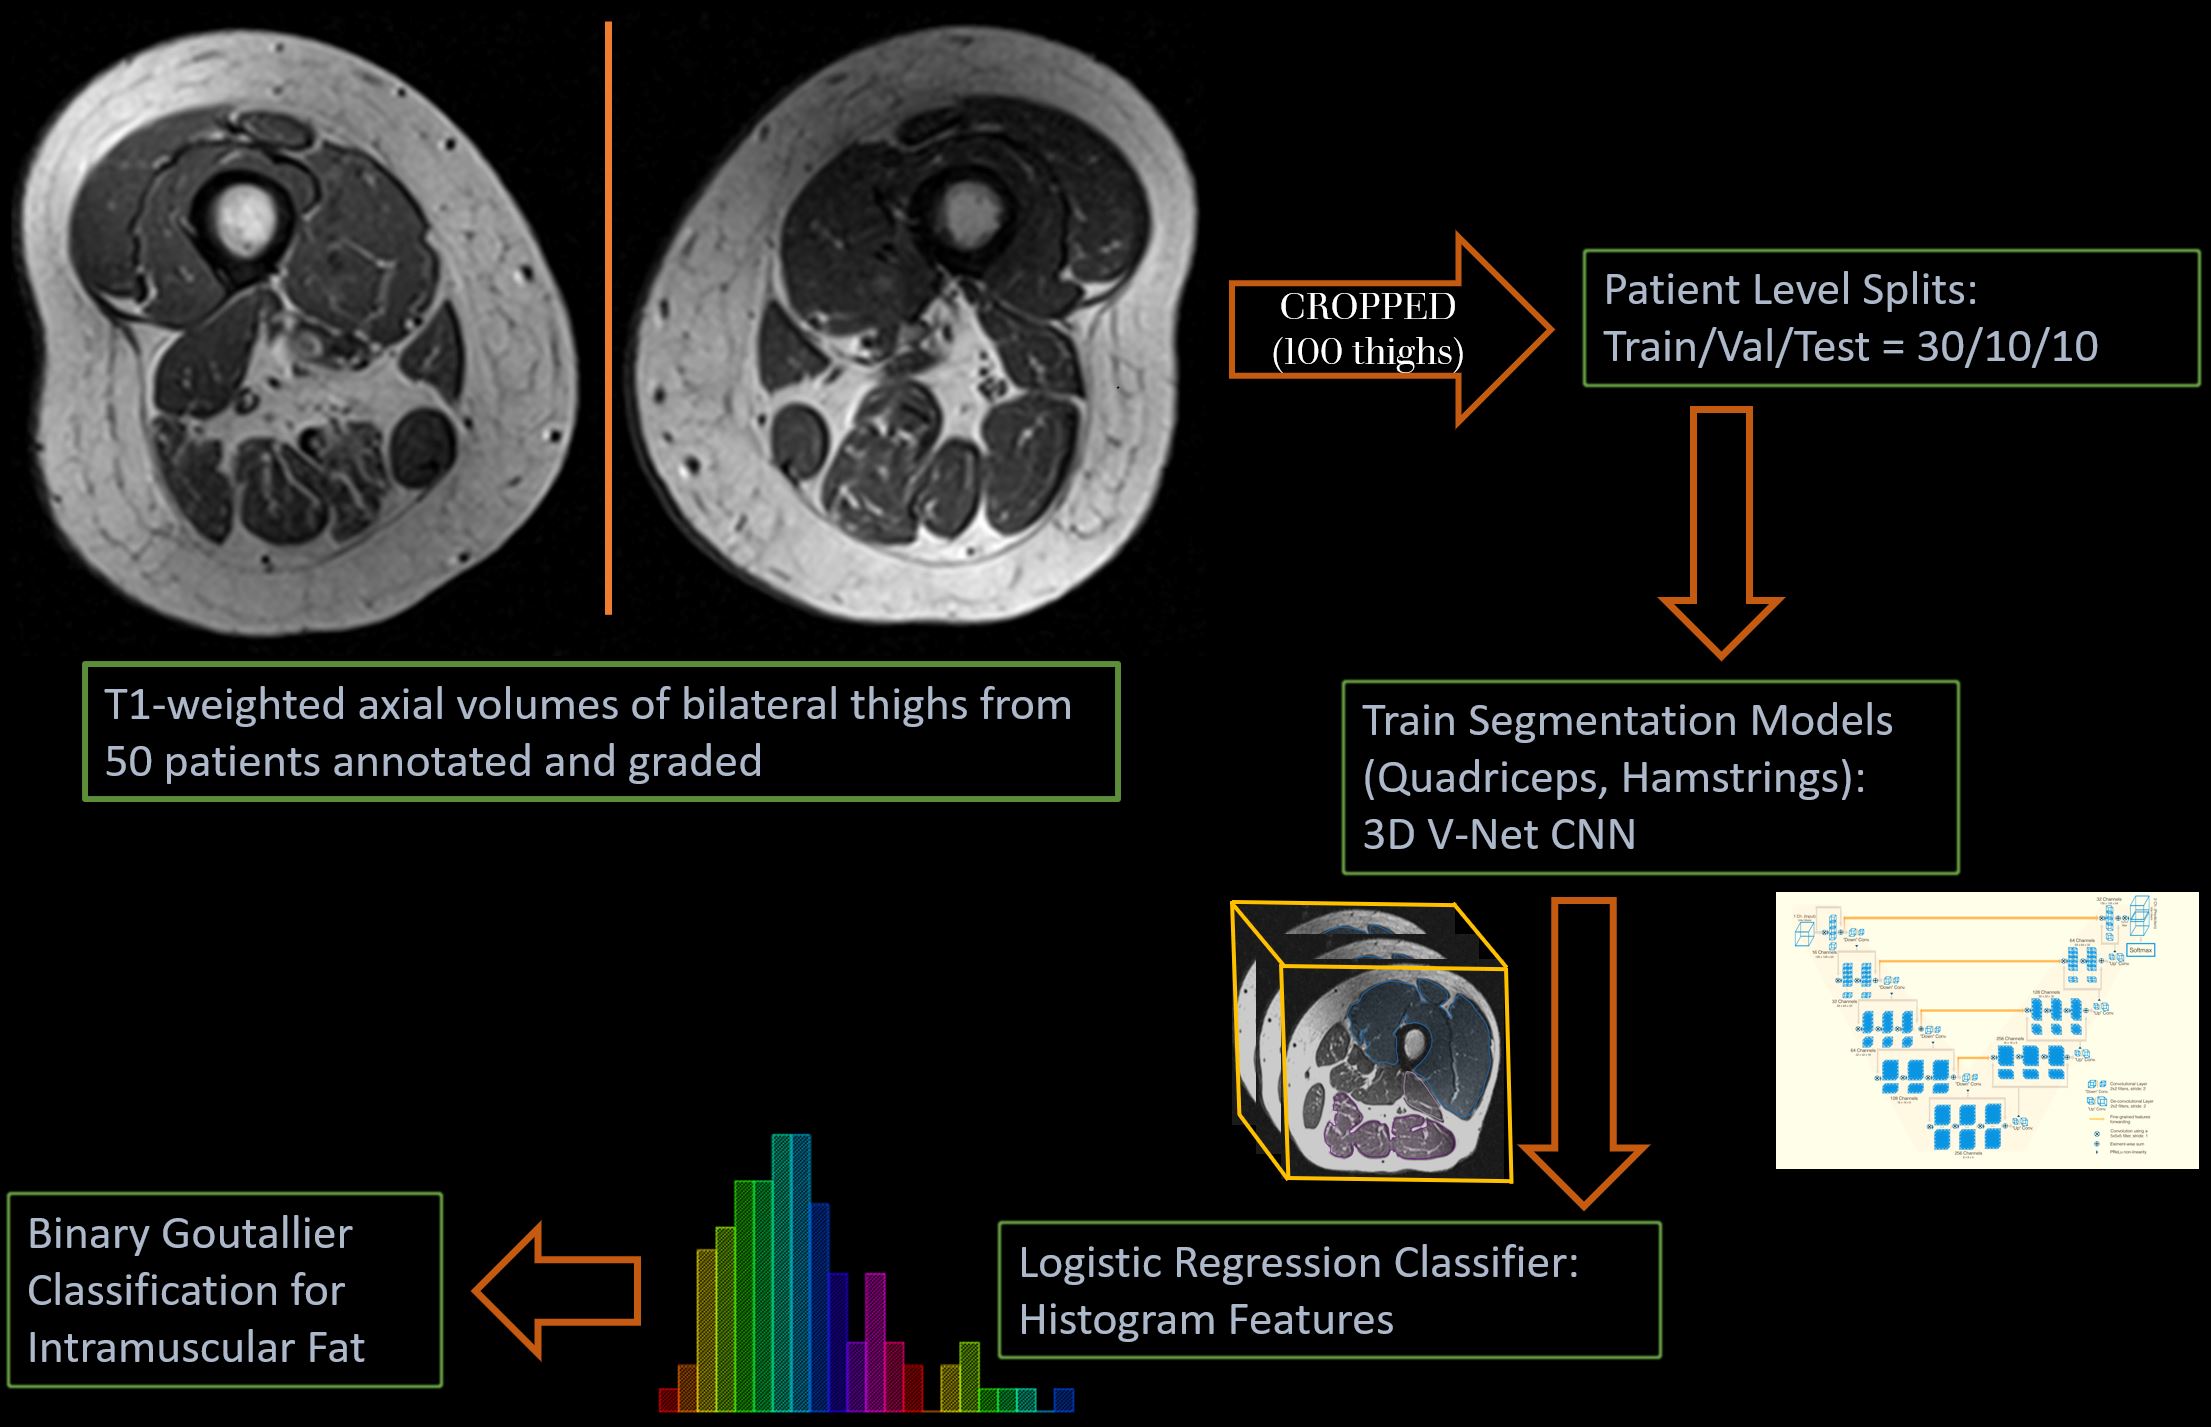
Figure 1 provides an overview of the overall methodology and the deep learning pipeline.Study Cohort
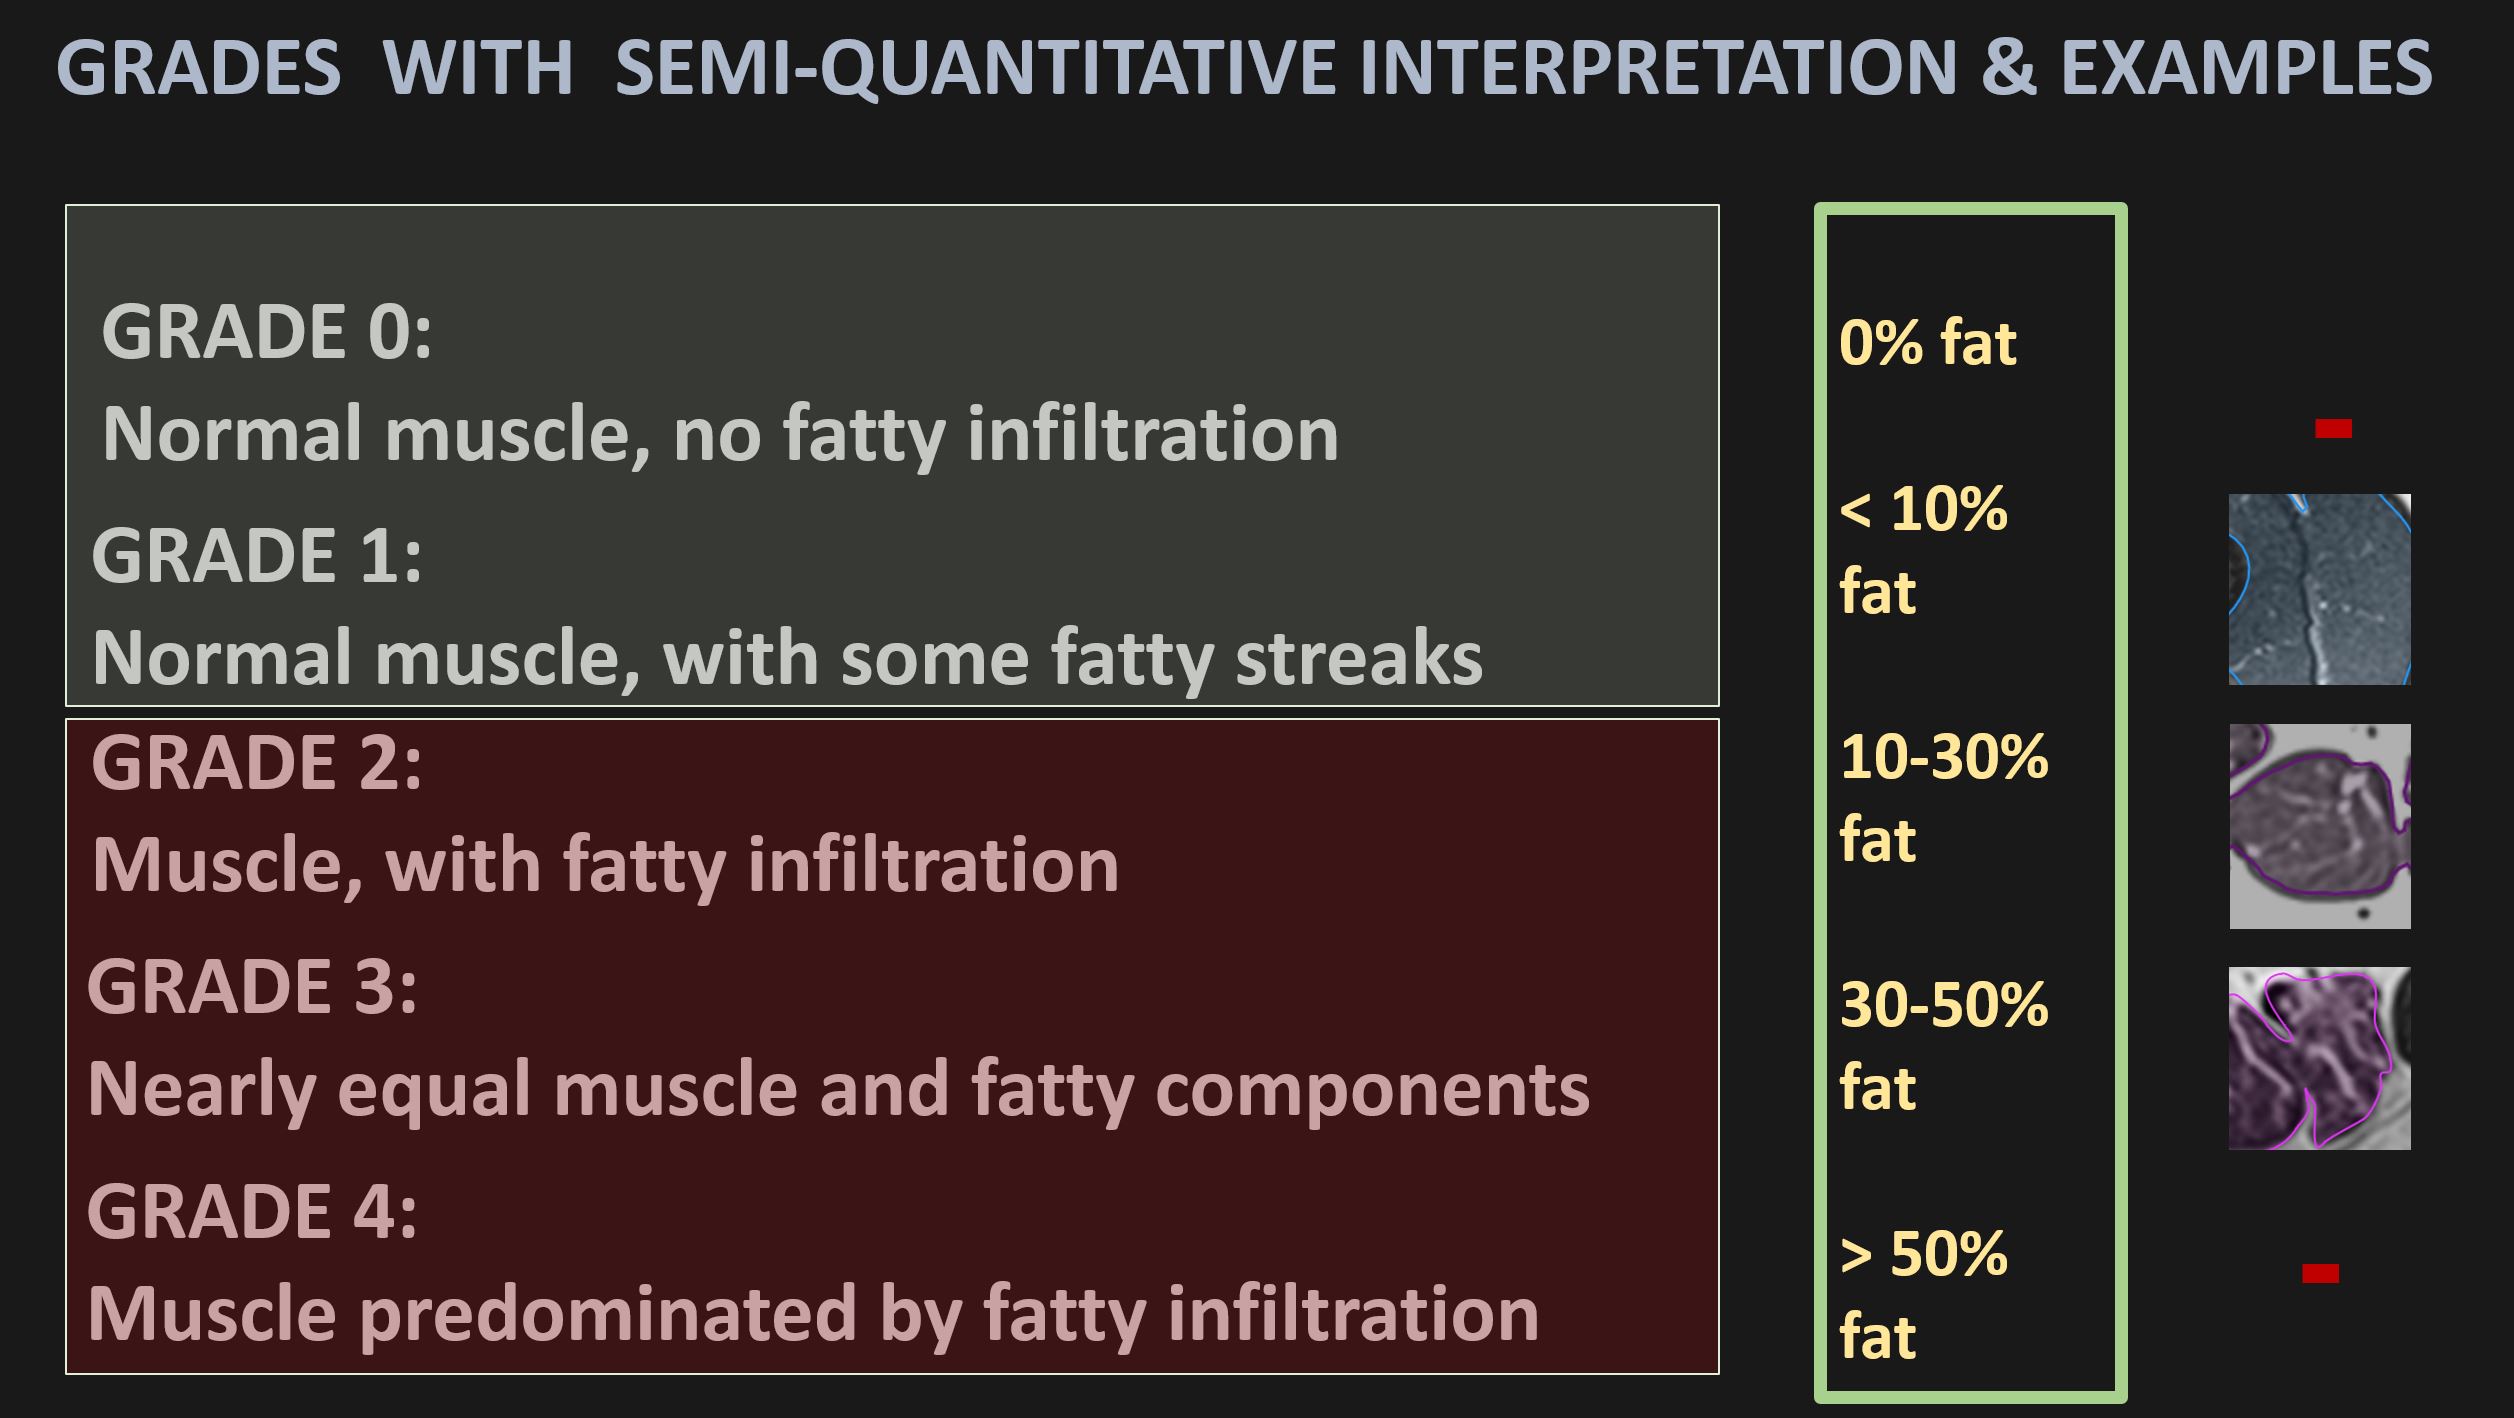
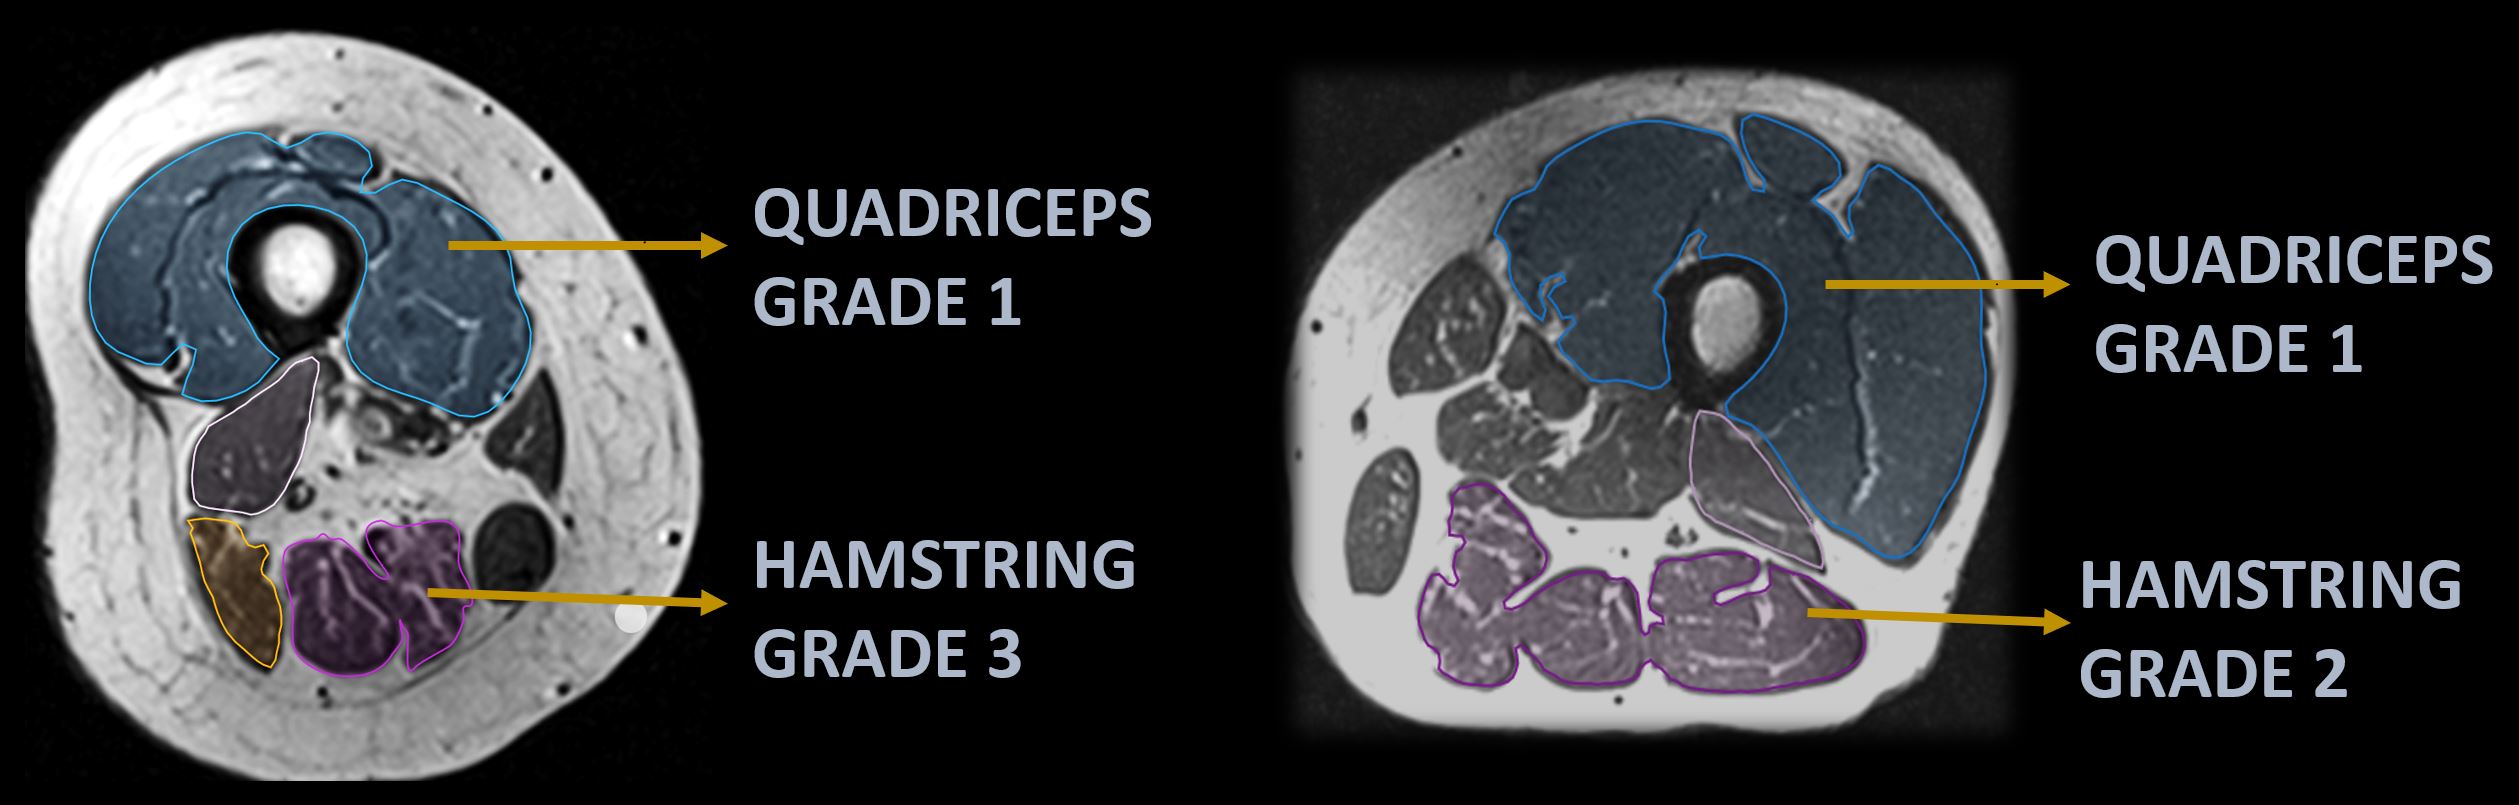
A subset of 50 MRI studies of bilateral thighs were selected at random from the Osteoarthritis Initiative (OAI) cohort12 with approximately uniform distribution of cases across MRI scanners, age, sex, and BMI. Axial T1-weighted images were labeled with freeform annotations of muscle groups – quadriceps and hamstrings – over 15 consecutive slices starting 10cm proximal to the distal epiphysis of the right femur and extending 7.5cm proximally using a research annotation platform (MD.ai). Each muscle was graded by a board-certified, musculoskeletal-trained radiologist (R1) and a radiology trainee (R2) using the GC system (Figure 2). Imaging examples of freeform annotations and GC grades are presented in Figure 3. The studies (n=50) were partitioned into random patient-level splits of train (n=30), validation (n=10), and test (n=10).
Thigh Muscle Segmentation
Two distinct 3D convolutional neural networks, based on the V-Net architecture, were developed one for each muscle group. The models were trained on a single NVIDIA Tesla V100 32 GB GPU in mixed precision for 100 epochs with batch size of 16, learning rate of 0.0001 using the ADAM optimizer in TensorFlow. The most performant model on the validation set was selected for subsequent analysis. Each side was preprocessed with pixel intensities normalized to [0, 1] and resized to a volume of 128x128x15 pixels, resulting in an augmented set of volumes for training (n=60 thighs: 30 studies x 2 sides), validation (n=20), and test (n=20).
Goutallier Classification
Histogram-based features (distribution of pixel intensities across 10 uniform bins between 0.0 and 1.0) were extracted from model-generated segmentations over the entire cohort and collapsed into train (n=120 features: 30 studies x 2 sides x 2 muscles), validation (n=40), and test (n=40) of histogram features. A logistic regression model was trained to predict binarized fat infiltration by collapsing GC grades into normal: GC ≤ 1 and fat infiltration: GC ≥ 2.
Statistical Analysis
Segmentation models were evaluated using the Sorensen-Dice coefficient on the test set for each muscle volume, across both sides (n=20 sides). Goutallier classification was evaluated using area under the receiver operating characteristic curve (AUROC). Pairwise agreement between R1, R2 and the model was characterized using Cohen’s kappa scores.
Results
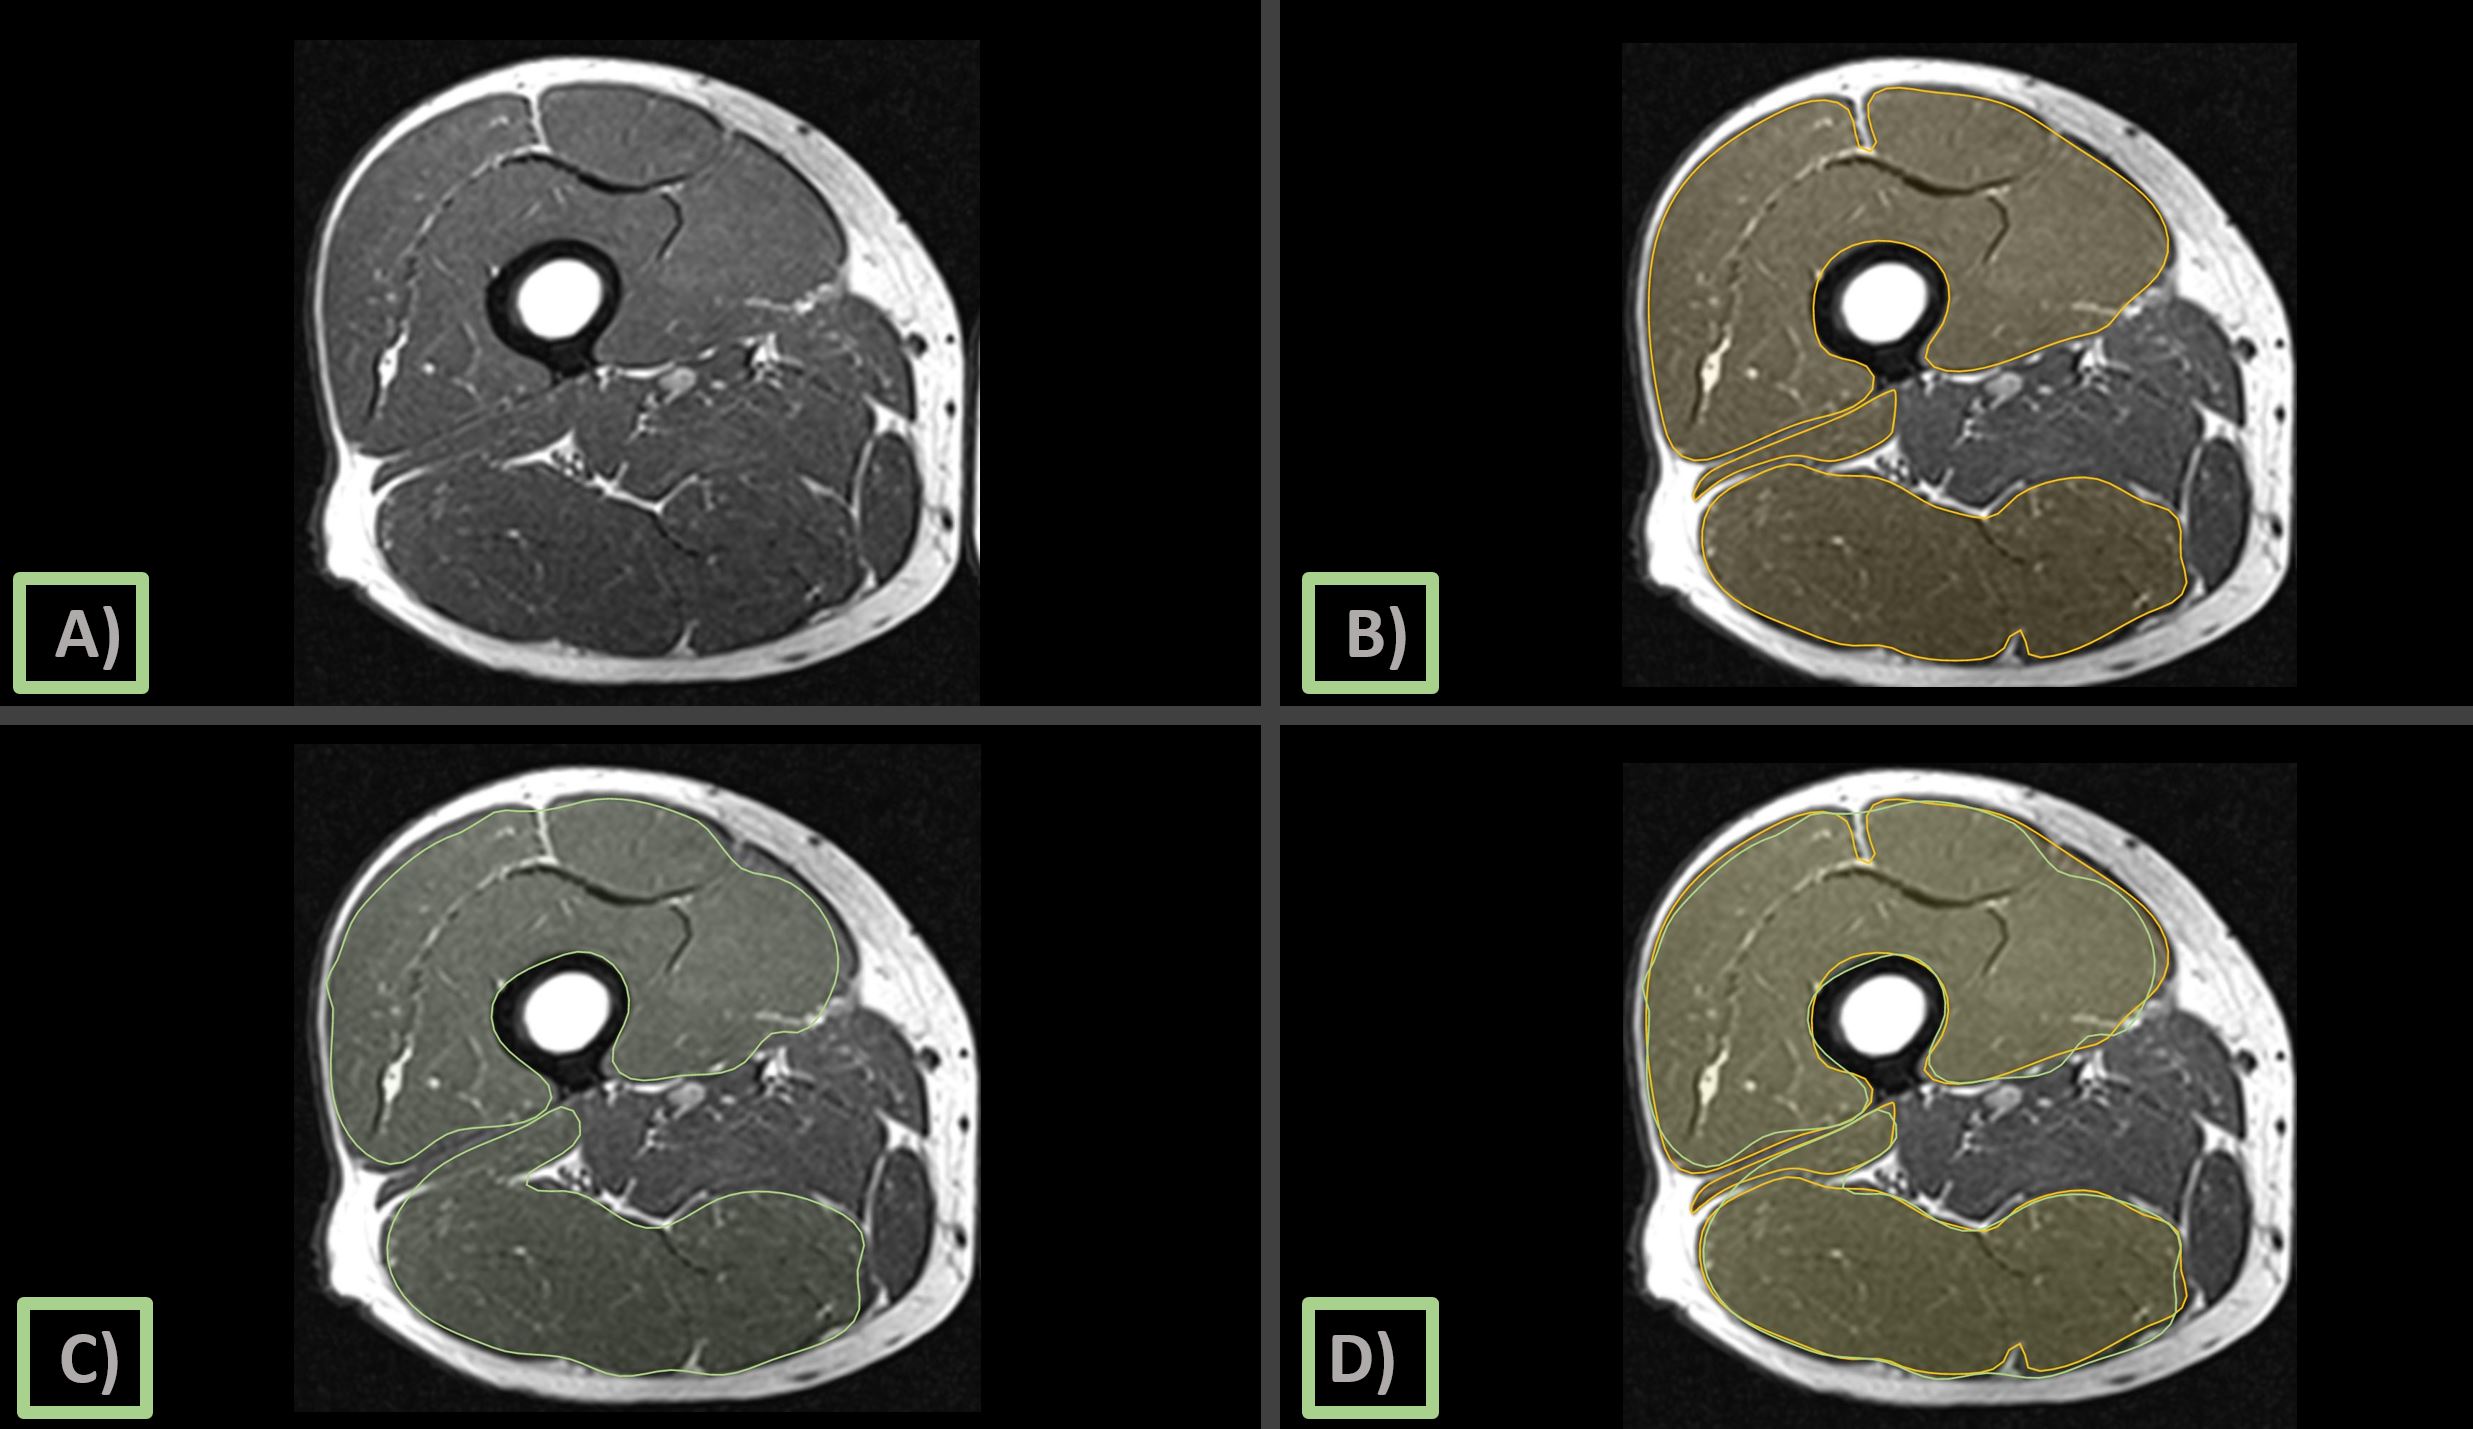
A total of 200 muscle volumes (50 patients x right and left thigh for 2 muscle groups) were graded, of which none were assigned GC grade 0 or 4, 111 volumes were assigned grade 1, 87 were assigned grade 2, and 2 were assigned grade 3. After binarization, 111 volumes were labeled normal and 89 as indicative of fat infiltration.Thigh muscle segmentation was favorable with dice scores of 0.89 [0.88, 0.90] and 0.84 [0.83, 0.87] for quadriceps and hamstrings, respectively. Figure 4 illustrates model generated segmentation for each muscle group. Goutallier classification using histogram features had an AUROC of 0.93 [0.92, 0.95]. Agreement between R1-R2, model-R1, and model-R2 were 0.61 [0.59, 0.64], 0.64 [0.61, 0.68], and 0.67 [0.64, 0.71], respectively.
Discussion
To our knowledge, this is one of the first end-to-end automated approaches to classifying intramuscular fat on T1-weighted MRI of the thigh. Our model achieves moderate-to-high model-reader agreements of 0.64 [0.61, 0.68] and 0.67 [0.64, 0.71], which is comparable to the inter-reader agreement of 0.61 [0.59, 0.64] on the same cases. The system is enabled by a 3D segmentation model that is performant for quadriceps (0.89 [0.88, 0.90]) and hamstrings (0.84 [0.83, 0.87]) followed by a logistic regression classifier trained on histogram features.Our study was constrained to a small sample size with the following limitations. While simplified GC systems have been reported before, very few studies assess binarized grades13. Limited samples also necessitated histogram-based features; a deep-learning based classification model was attempted but had the tendency to overfit due to a small training set. Similarly, two separate segmentation models were required – one for each muscle group – instead of a single, multi-class network. Lastly, our analysis is focused on two prominent muscle groups – segmentation of anisotropic muscle groups may be more challenging and is work in progress.
In conclusion, our study provides evidence that a deep-learning system can automate the evaluation of intramuscular fat from T1-weighted MRI of the thigh with potentially high accuracy, and comparable to that of radiologists.
Acknowledgements
This study was funded by the NIH (National Institute of Arthritis and Musculoskeletal and Skin Diseases grants R01-AR078917). We would like to thank the faculty and staff of the Coordinating Center of the OAI at the NIH and UCSF for their invaluable assistance with patient selection, statistical analysis, and technical support. The OAI is a public-private partnership comprised of five contracts (N01-AR-2-2258; N01-AR-2-2259; N01-AR-2-2260; N01-AR-2-2261; N01-AR-2-2262) funded by the National Institutes of Health, a branch of the Department of Health and Human Services and conducted by the OAI Study Investigators. Private funding partners include Pfizer, Inc.; Novartis Pharmaceuticals Corporation; Merck Research Laboratories; and GlaxoSmithKline. Private sector funding for the OAI is managed by the Foundation for the National Institutes of Health.References
- Kumar D, Karampinos DC, MacLeod TD, et al. Quadriceps intramuscular fat fraction rather than muscle size is associated with knee osteoarthritis. Osteoarthritis and Cartilage 2014;22(2):226 – 234.
- Inhuber S, Sollmann N, Schlaeger S, et al. Associations of thigh muscle fat infiltration with isometric strength measurements based on chemical shift encoding-based water-fat magnetic resonance imaging. European Radiology Experimental 2019;3:45.
- Schlaeger S, Sollmann N, Zoffl A, et al. Quantitative Muscle MRI in Patients with Neuromuscular Diseases – Association of Muscle Proton Density Fat Fraction with Semi-Quantitative Grading of Fatty Infiltration and Muscle Strength at the Thigh Region. Diagnostics 2021;11:1056.
- Kim HS, Yoon YC, Jin W, et al. Muscle fat quantification using magnetic resonance imaging: case-control study of Charcot-Marie-Tooth disease patients and volunteers. Journal of Cachexia, Sarcopenia, and Muscle 2019;10:574 – 585.
- Trevino III JH, Gorny KR, Gomez-Cintron A, et al. A quantitative alternative to the Goutallier classification system using Lava Flex and Ideal MRI techniques: volumetric intramuscular fatty infiltration of the supraspinatus muscle, a cadaveric study. Magnetic Resonance Materials in Physics, Biology, and Medicine 2019;32:607 – 615.
- Goutallier D, Postel JM, Bernageau J, et al. Fatty muscle degeneration in cuff ruptures. Pre- and postoperative evaluation by CT scan. Clin Orthop Relat Res. 1994;304:78 – 83.
- Bogunovic L, Lee SX, Haro M, et al. Application of the Goutallier/Fuchs Rotator Cuff Classification to the Evaluation of Hip Abductor Tendon Tears and the Clinical Correlation With Outcome After Repair. Arthroscopy 2015;31(11):2145 – 2151.
- Putz C, Block J, Gantz S, et al. Structural changes in the thigh muscles following trans-femoral amputation. Eur J Orthop Surg Traumatol 2017;27:829 – 835.
- Greve T, Burian E, Zoffl A, et al. Regional variation of thigh muscle fat infiltration in patients with neuromuscular diseases compared to healthy controls. Quant Imaging Med Surg 2021;11(6):2610 – 2621.
- Slabaugh MA, Friel NA, Karas V, et al. Interobserver and Intraobserver Reliability of the Goutallier Classification Using Magnetic Resonance Imaging. Am J Sports Med. 2012;40(8):1728 – 1734.
- Ro K, Kim JY, Park H, et al. Deep-learning framework and computer assisted fatty infiltration analysis for the supraspinatus muscle in MRI. Scientific Reports 2021;11:15065.
- Peterfy CG, Schneider E, Nevitt M. The osteoarthritis initiative: report on the design rationale for the magnetic resonance imaging protocol for the knee. Osteoarthritis and Cartilage 2008;16(12):1433 – 1441.
- Quinn M, Levins J, Mojarrad M, et al. Association of tensor fascia lata hypertrophy and fatty infiltration in the presence of abductor tendon tears: a radiographic study. Journal of Hip Preservation Surgery 2021;00:1 – 5.
Figures