2822
Impact of tract propagation stop criteria on skeletal muscle DTI fiber tract completeness and characteristics1Stephens Family Clinical Research Institute, Carle Health, Urbana, IL, United States, 2Carle Clinical Imaging Research Program, Carle Health, Urbana, IL, United States, 3Department of Radiology and Nuclear Medicine, Amsterdam Movement Sciences, Amsterdam University Medical Center, Amsterdam, Netherlands, 4Biomedical Engineering, Vanderbilt University, Nashville, TN, United States
Synopsis
Diffusion-tensor MRI tractography has been applied to characterize skeletal muscle architecture and diffusion characteristics. Ideally, tracking would occur completely for accurate length, angle, curvature, and diffusion property estimation of a bundle of fibers. In practice, it is desirable to end tracts early if poor quality data is encountered and tract termination settings can influence the balance between tract completeness and desirable exclusion of inaccurate tract regions. This work examines the effect of applying a range of fractional-anisotropy and intersegment-angle tract-termination thresholds on muscle architecture and diffusion estimates, and fiber polynomial fit residuals.
Introduction
Diffusion MRI tractography is used to characterize muscle architectural and diffusion properties relevant to muscle health and function. Ideally, fibers are tracked completely for whole-tract measurements. However, noise can cause tract trajectory errors; early termination in these cases prevents erroneous curvature or pennation values from entering the dataset. However, tract termination criteria influence the balance between tract completeness and inaccurate result exclusion. Typical criteria include the FA and intersegment angle, used to terminate tract propagation if their values fall out of range at one (bin1) or two consecutive (bin2) steps. The effects of minimum FA and maximum intersegment angle thresholds on tract length and pennation angle and tract completion/error have been examined1,2 , but combination of these settings with step size and bin1/bin2 criteria, and their impact on architecture estimates, has not been explored.This work examines how four minimum FA and maximum intersegment angle thresholds for two step sizes and bin1/bin2 settings impact tract-smoothing polynomial residuals and tract architecture, diffusion, completeness, and termination reason.
Methods
Seven healthy subjects consented to participate in this IRB-approved study. Axial diffusion (24 diffusion-encoding directions, b-values = 0, 450 mm2/s) and Dixon series of the leg were acquired at 3T with the knee extended and ankle fixed at 10° dorsiflexion. The diffusion images were registered to the Dixon images3, denoised4, and the diffusion-tensor series was calculated.3 Each subject’s tibialis anterior muscle and aponeurosis were segmented on the Dixon series in ITK-SNAP.5 The aponeurosis segmentation was converted to a mesh of propagation seed points.Fiber-tracking was performed in MATLAB using publicly-available MuscleDTI_Toolbox.3 Fourth-order Runge Kutta propagation with bin1 and bin2 settings and step sizes of 0.25 and 1.0 pixel-widths was used. Tracts were terminated at the muscle border or terminated early if FA fell outside the allowable range (minimum = 0.05, 0.10, 0.15, 0.20, maximum = 0.4) or if intersegment angle between steps exceeded the allowable angle (thresholds = 10, 30, 50, 70°) in one (bin1) or two consecutive (bin2) steps. Tracts were smoothed by fitting 3rd-order polynomials to x, y, and z coordinates. The residuals were analyzed for magnitude, normality, and autocorrelation.
Tracts with length <10 mm, mean curvature >40 m-1, or pennation angle >40° were excluded. Mean length, curvature, pennation angle, mean diffusivity (MD), FA, percentage complete tracts, and percentage stopped for intersegment angle and FA were calculated.
Results
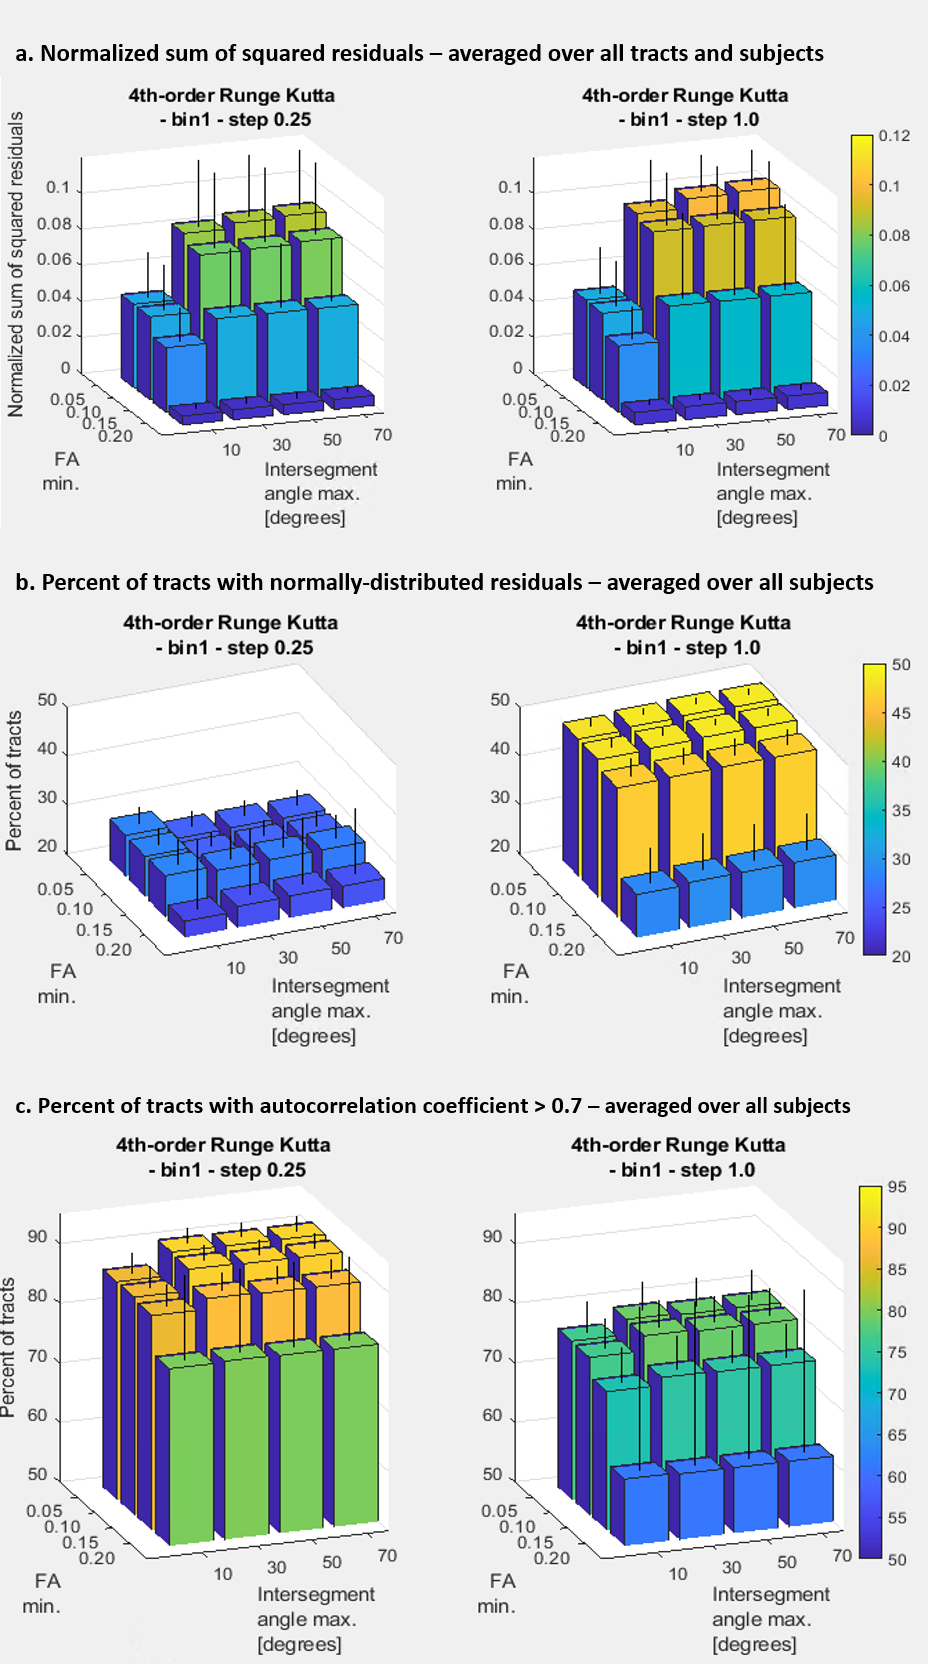
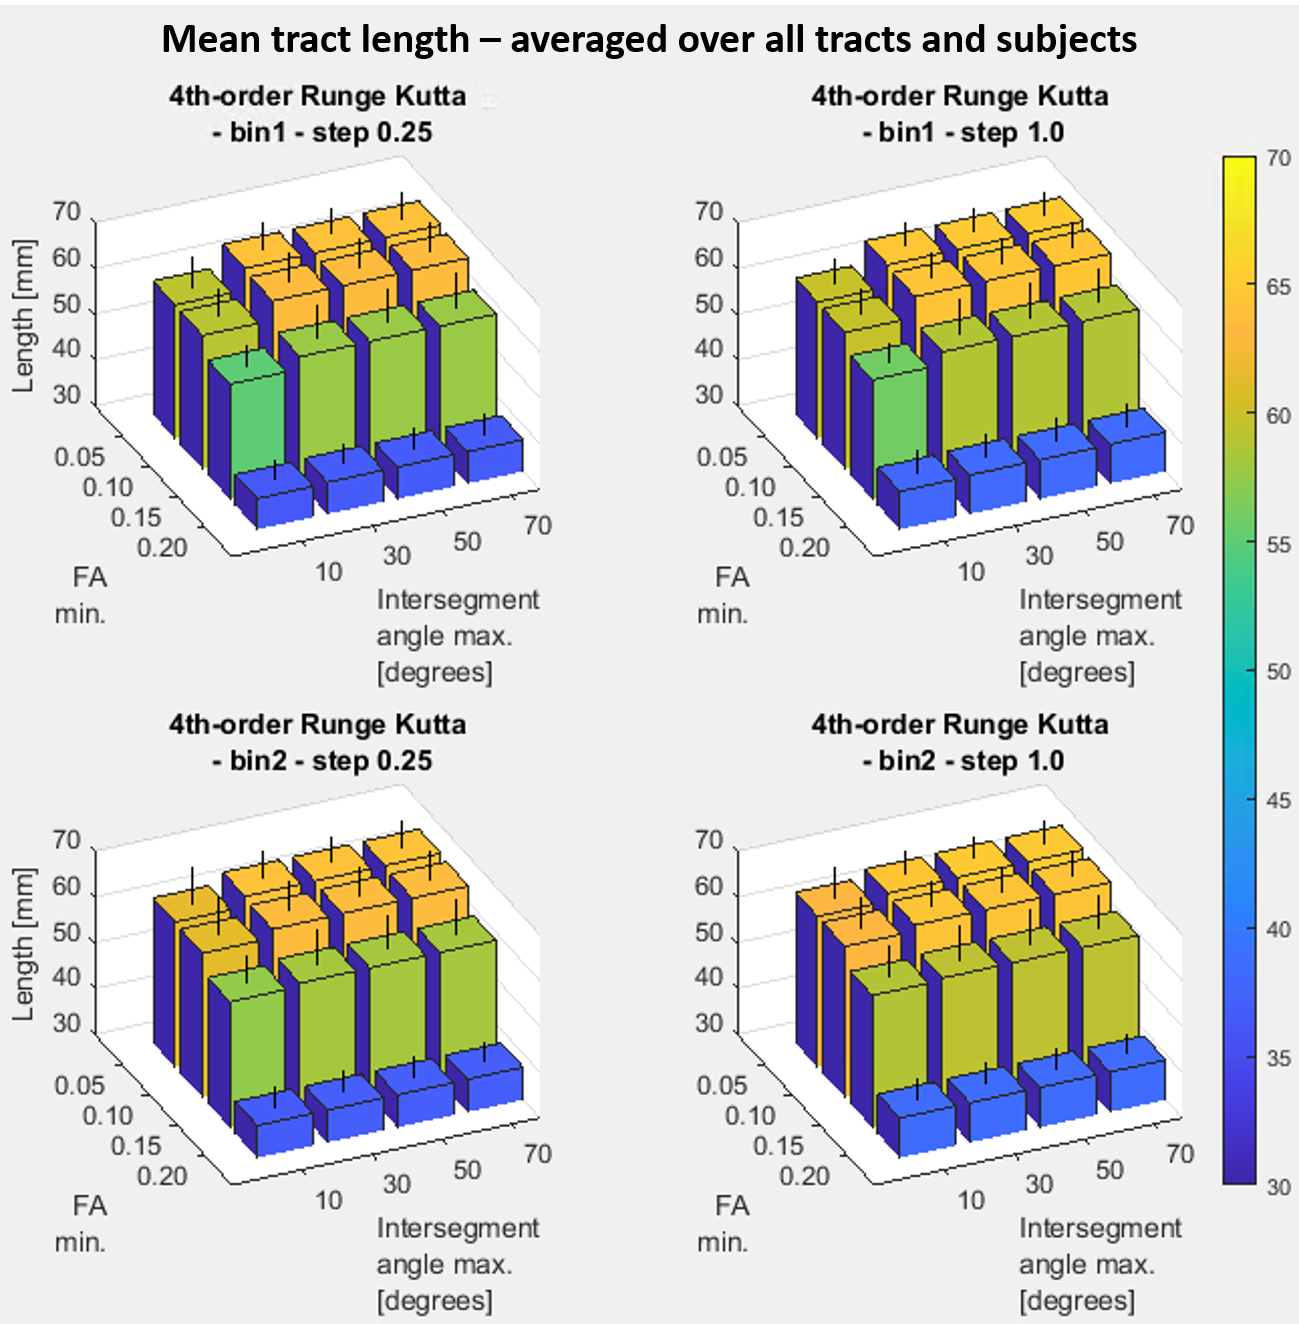
Higher minimum FA threshold improved polynomial fit, reflected by reduced residual magnitude and percent of tracts with autocorrelation coefficient >0.7 (Figure 1, a, c). At the largest step size the percent of tracts with normally distributed residuals decreased with higher minimum FA (Figure 1, b). Excluding intersegment angles >10° reduced residual magnitude and autocorrelation percent compared to consistent values seen with higher angle thresholds. Results were similar for bin1 and bin2 and step sizes, excepting normality of the residuals.Mean tract length was lower at the highest minimum FA threshold (range across all conditions, 37-39 mm) versus lower thresholds (55-65 mm). Tract length was 55-60 mm at the lowest maximum intersegment angle threshold and 63-65 mm for higher thresholds for bin1 (Figure 2). Curvature was higher for smaller step size (6.9-7.5 m-1) than larger step size (6.3-6.8 m-1). Within each bin1/bin2 and step size condition, curvature was 0.3-0.5 m-1 higher at the highest FA threshold versus lower thresholds. Pennation angle did not vary meaningfully (8-9°). FA was 0.22 across all tests except at the highest FA threshold (0.24). MD was 1.8E-3 mm2/s consistently.
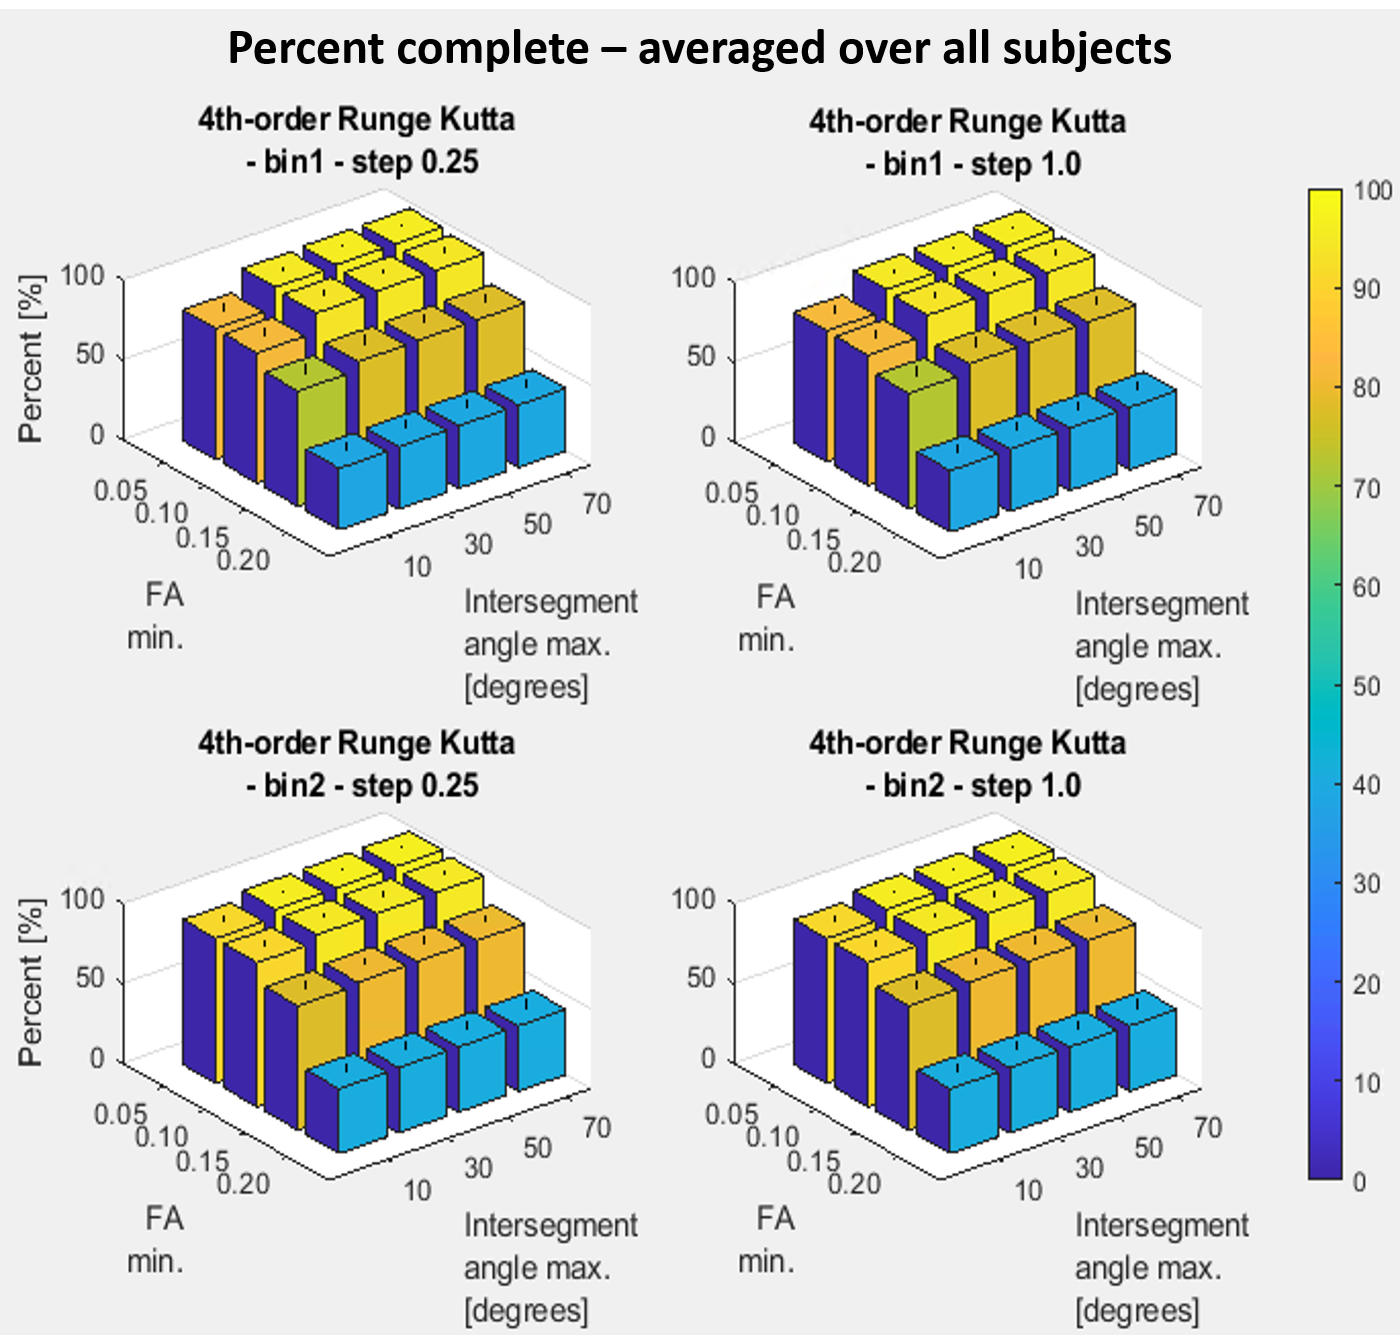
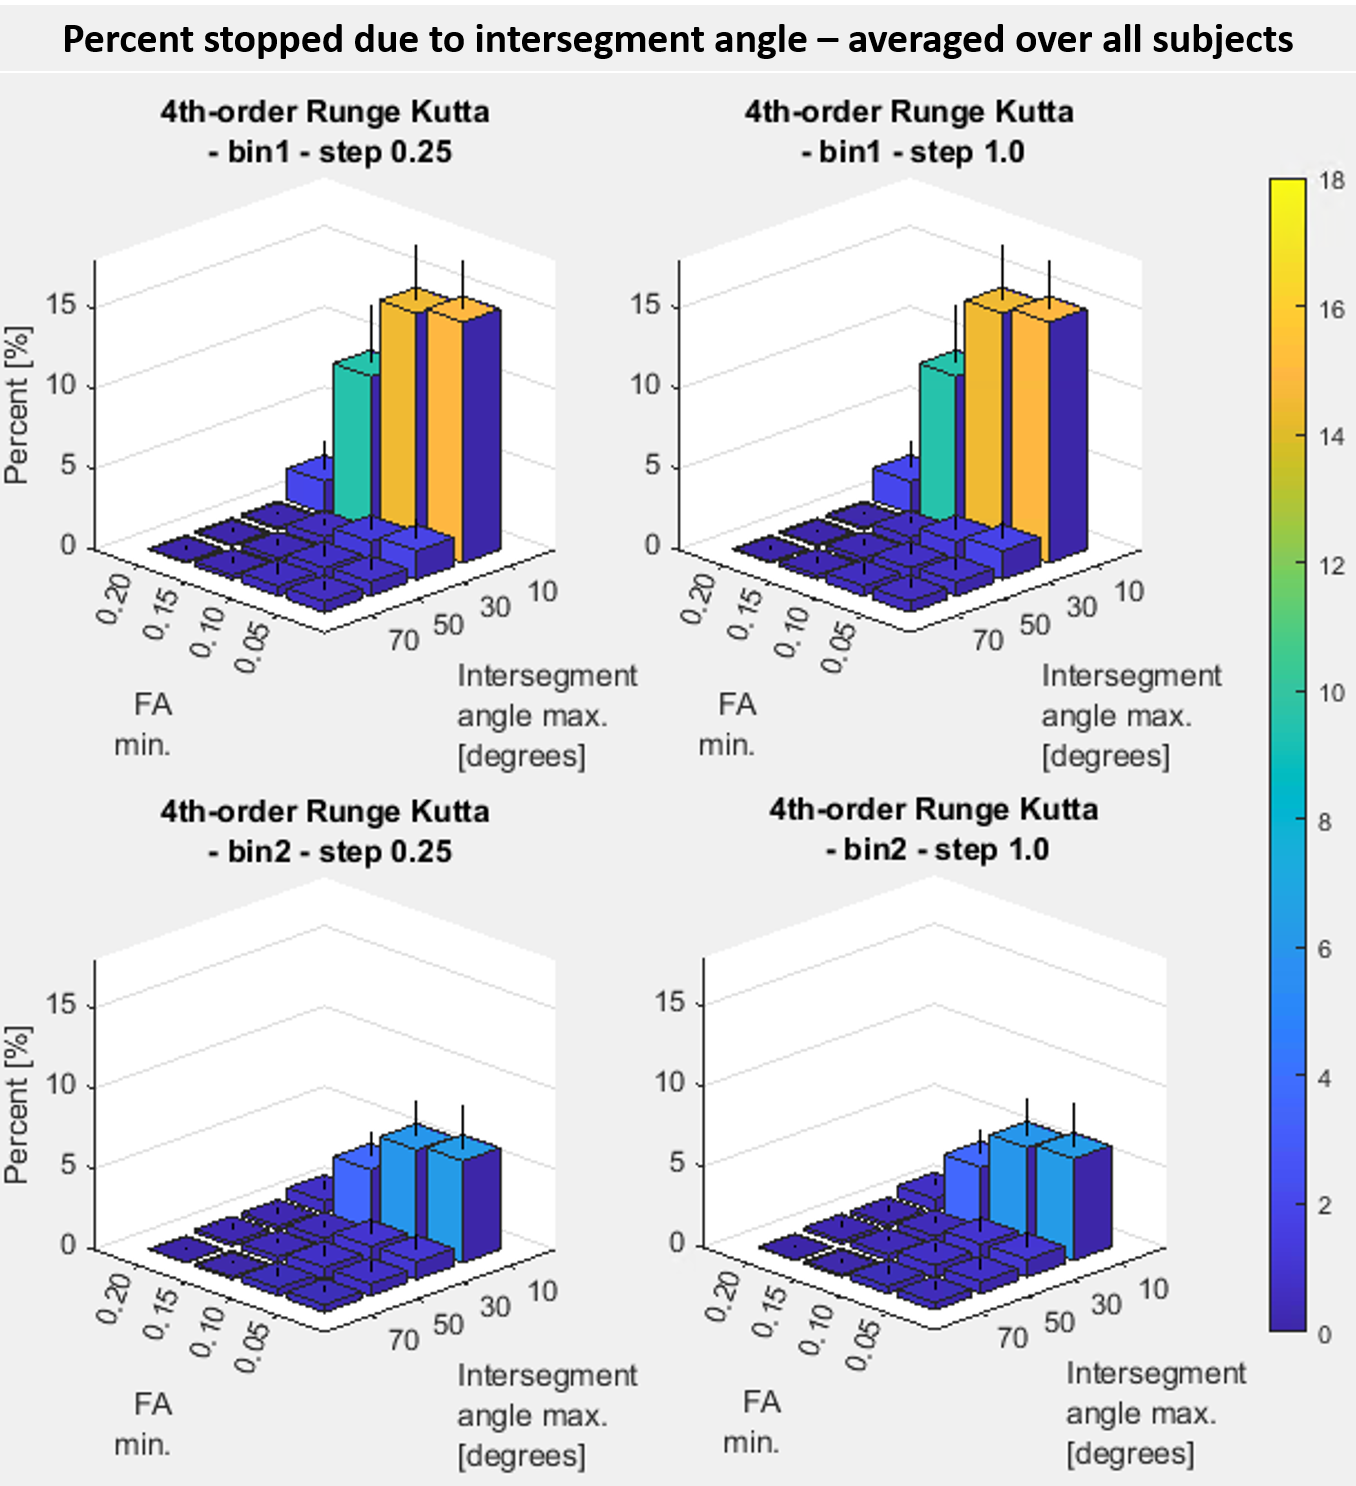
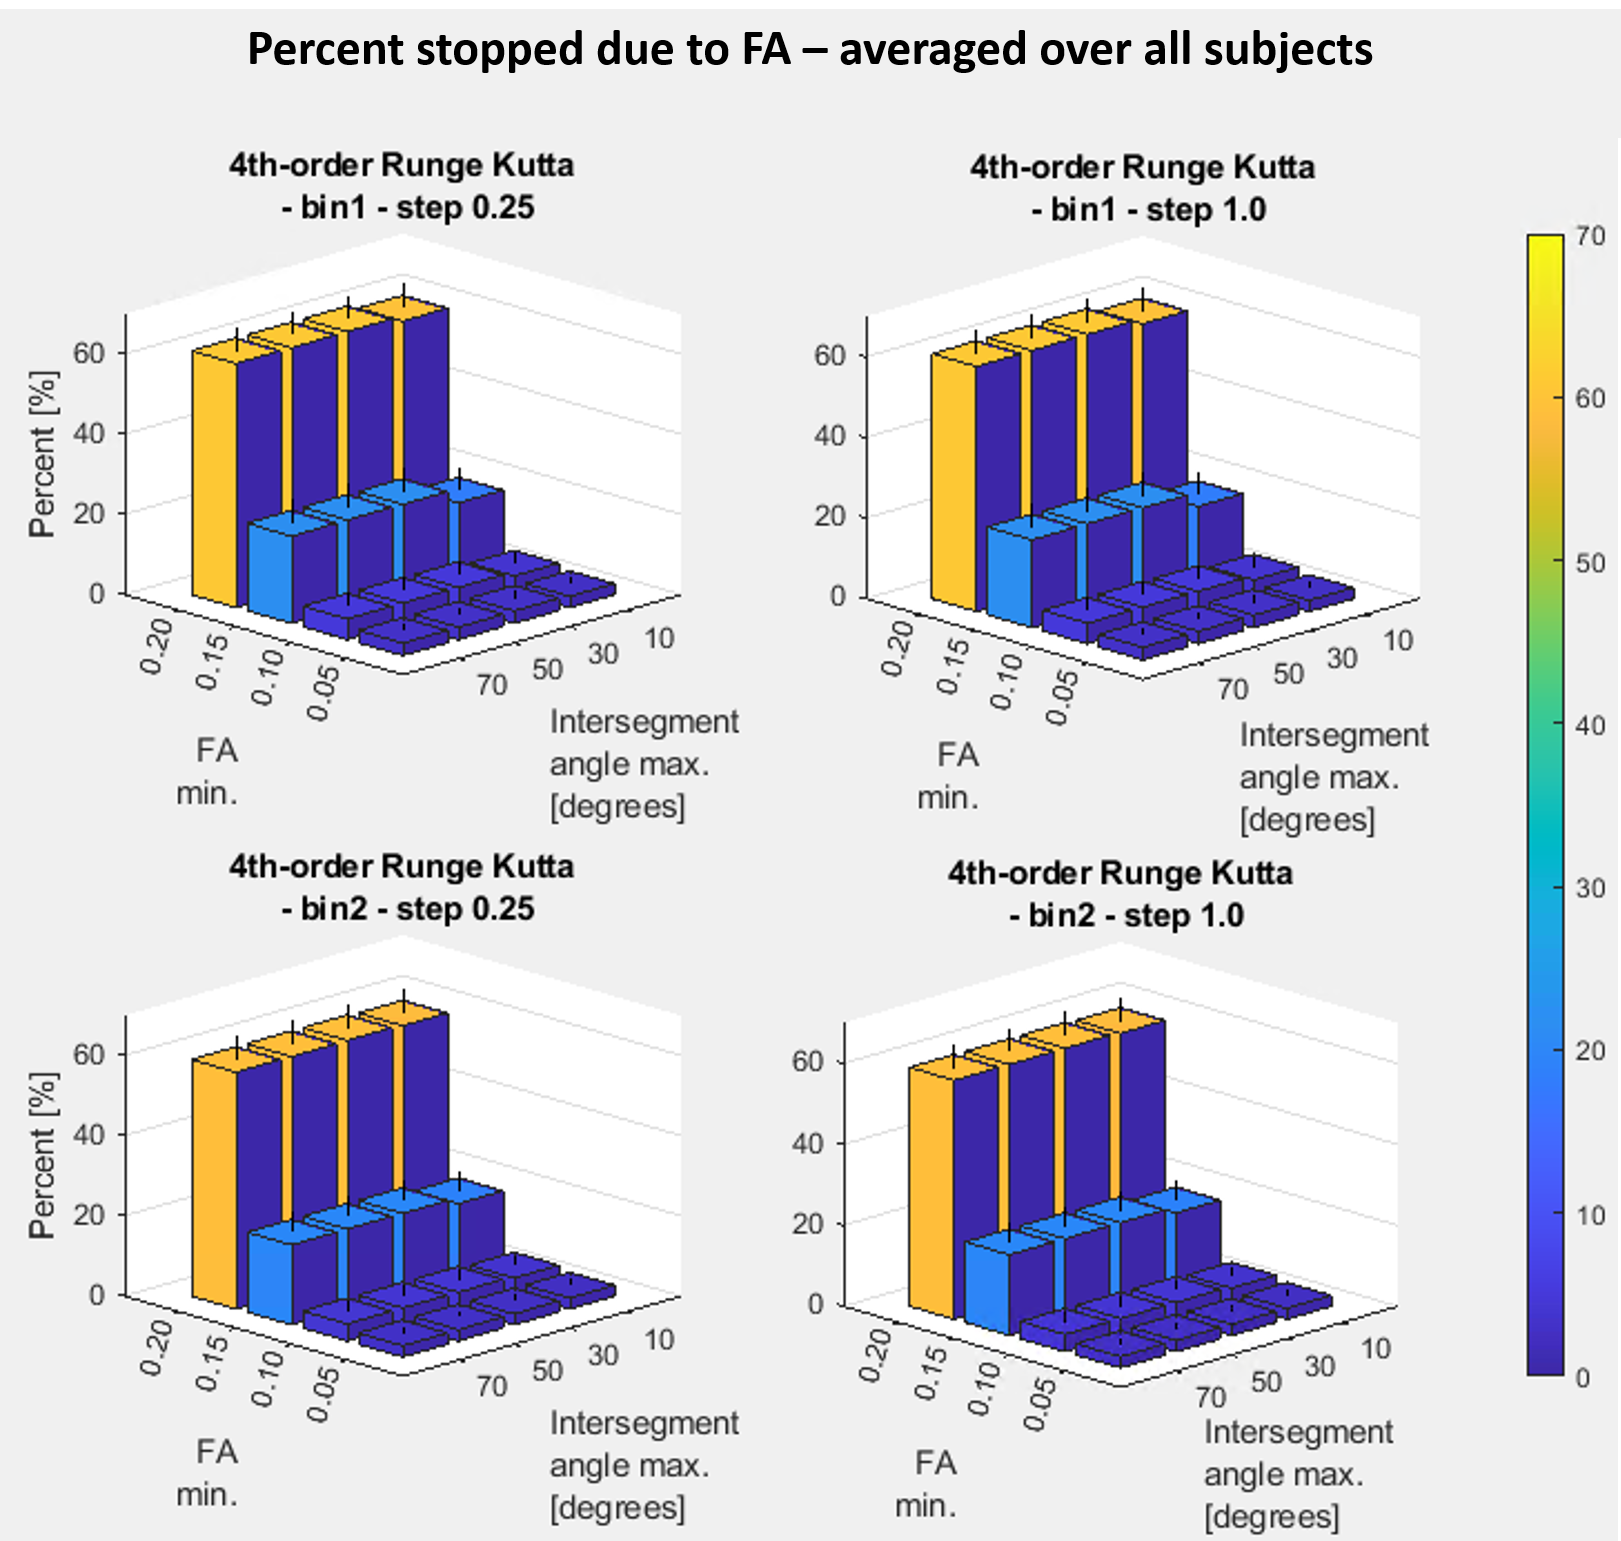
The percent of tracts completed was 82-96% (bin1) and 90-97% (bin2) at FA thresholds = 0.05-0.10, dropping to 72-78% and 39% (bin1) and 78-80% and 41% (bin2) at FA thresholds of 0.15 and 0.2, respectively, for both step sizes. Lower values occurred at the lowest maximum intersegment angle threshold (Figure 3). The percent of tracts stopped for FA increased with each higher FA threshold (3%, 4-5%, 18-22%, and 59-61%, respectively), while angle threshold had minimal effect. Percent of tracts stopped for angle was influenced by FA and angle threshold (Figure 4). At angle thresholds >10°, percent stopped due to intersegment angle was <2% for all conditions. At the strictest 10° threshold the percent stopped for intersegment angle was lowest (2% for bin1, 1% for bin2) at FA = 0.20, and highest (15% for bin1, 6% for bin2) at FA = 0.05.
Discussion
Pennation angle and MD were relatively insensitive to termination thresholds, and curvature, FA, and percent tracts stopped due to angle were consistent except at the strictest FA and/or intersegment angle thresholds. Tract polynomial fit residuals, length, percent complete, and percent stopped due to FA were most sensitive to FA and angle settings, with changes seen even at more permissive intersegment angle or FA thresholds. While residuals behavior indicated better fit to a 3rd-order polynomial model when stricter thresholds were applied, the large reduction in length and tract completion at these settings warrants additional analysis of the quality of the early-terminated tracts.Conclusion
Strict FA minimum threshold and intersegment angle threshold improve fit to a 3rd-order polynomial fiber shape model but can greatly decrease mean length and percent of tracts reaching completion. Additional quality measures may inform optimal threshold selection.Acknowledgements
This work was supported by NIH/NIAMS grant R01 AR073831References
1. Heemskerk AM, Sinha TK, Wilson KJ, Ding Z, Damon BM: Quantitative assessment of DTI-based muscle fiber tracking and optimal tracking parameters. Magn Reson Med 2009; 61:467–472.
2. Bolsterlee B, Veeger HEJ (DirkJan), van der Helm FCT, Gandevia SC, Herbert RD: Comparison of measurements of medial gastrocnemius architectural parameters from ultrasound and diffusion tensor images. J Biomech 2015; 48:1133–1140.
3. Damon BM, Ding Z, Hooijmans MT, et al.: A MATLAB toolbox for muscle diffusion-tensor MRI tractography. J Biomech 2021; 124:110540.
4. Buck AKW, Ding Z, Elder CP, Towse TF, Damon BM: Anisotropic Smoothing Improves DT-MRI-Based Muscle Fiber Tractography. PLOS ONE 2015; 10:e0126953.
5. Yushkevich PA, Piven J, Hazlett HC, et al.: User-guided 3D active contour segmentation of anatomical structures: Significantly improved efficiency and reliability. NeuroImage 2006; 31:1116–1128.
Figures