2821
Multi-nuclear MRI of tissue sodium provides novel measure of treatment response to physical therapy in women with lipedema1Department of Physical Medicine and Rehabilitation, Vanderbilt University Medical Center, Nashville, TN, United States, 2Department of Radiology and Radiological Sciences, Vanderbilt University Medical Center, Nashville, TN, United States, 3Vanderbilt University Institute of Imaging Science, Vanderbilt University Medical Center, Nashville, TN, United States, 4Department of Biomedical Engineering, Vanderbilt University Medical Center, Nashville, TN, United States, 5Department of Neurology, Washington University School of Medicine, St Louis, MO, United States, 6Department of Neurology, Vanderbilt University Medical Center, Nashville, TN, United States, 7Department of Pediatrics, Vanderbilt University Medical Center, Nashville, TN, United States, 8Department of Biostatistics, Vanderbilt University Medical Center, Nashville, TN, United States, 9Department of Psychiatry and Behavioral Sciences, Vanderbilt University Medical Center, Nashville, TN, United States
Synopsis
The overall goal of this work is to apply multi-nuclear sodium MRI to evaluate the therapeutic effect of physical therapy in women with lipedema. Lipedema is a fat disorder affecting approximately 11% of women and since it is largely refractory to diet and exercise, objective measures of condition severity and treatment response are required. We applied sodium MRI to evaluate whether abnormal tissue sodium accumulation in the legs, a previously established lipedema biomarker, reduced following physical therapy in persons with lipedema. Results show reduction of skin and subcutaneous sodium, which corresponds with reduced pain and increased function.
Introduction
The overall goal of this work is to apply sodium MRI, along with pain and functional assessments to evaluate effects of therapy in women with lipedema. Lipedema is an adipose disorder with different etiology and presentation from common obesity requiring distinct treatment approaches to address symptoms. Lipedema-related symptoms include bilateral swelling due to excess fluid in the extracellular matrix1 and abnormal accretion of subcutaneous adipose tissue (SAT)2 associated with physical morbidities impacting function3-6, and pain with light touch7. Recent multi-nuclear sodium 23Na-MRI assessments of subcutaneous sodium suggest that sodium MRI may provide an objective, internal marker of lipedema compared to body-mass-index (BMI)-matched females without lipedema8. Further development of biomarkers for treatment response is fundamental, as it precludes novel disease-modifying or curative therapies from being evaluated rigorously in clinical trials. Here, we performed sequential sodium MRI and symptomatology assessments in a proof-of-principle trial with the hypothesis that physical therapy reduces clinical symptoms of pain, improves function, and modifies tissue sodium deposition in the treated lower extremities of women with early-stage lipedema.Methods
All participants provided informed, written consent for this interventional multi-nuclear imaging study. Participants with Stage 1-2 lipedema and who met criteria for early Stage 0-1 lymphedema (n=5, age=38.4±13.4 years, body-mass-index=27.2±4.3 kg/m2) underwent nine physical therapy sessions in six-weeks consisting of manual therapy, tailored exercise, education and compression (Figure 1). Pre- and post-therapy, participants were scanned with 3 Tesla sodium and water MRI, underwent biophysical measurements, and completed the patient specific functional scale (PSFS) questionnaire. Pain was measured each visit using the 0-10 visual analog scale (VAS).Magnetic resonance imaging. The MRI protocol incorporated multi-nuclear sodium (23Na-MRI) and conventional proton T1-weighted imaging (Figure 2). Sodium MRI was performed in one leg and the ipsilateral arm at the widest girth of the participant’s calf and forearm. Sodium imaging was acquired with a 3D gradient-echo sequence (TR/TE=130/0.99 ms, field-of-view [FOV]=192x192 mm2, acquired matrix size=64x64, slice thickness=30 mm) and a quadrature knee coil tuned for sodium signal reception9. Proton MRI for high spatial resolution anatomical localization was acquired with the Dixon method (TR=200 ms, TE1=1.15 ms, TE2=2.30 ms, matrix size=192x192, in-plane spatial resolution=1x1mm2, slice=6; slice thickness=5 mm) in the identical in-plane FOV to the sodium image.
Standardized tissue sodium content (TSC) maps were calculated in the arm and leg. The mean signal intensity was measured in standard sodium solutions (ranging 10-40mmol/L) included in the FOV, and a linear model fit was identified for each image. Model parameters were used to calculate TSC (mmol/L) from magnitude signal intensity (arbitrary units) voxel-wise. TSC maps were interpolated to match the in-plane spatial resolution (1x1 mm2) of the Dixon image. TSC was measured in three regions-of-interest (ROIs): skin, SAT, and muscle. ROIs were manually drawn on the central slice of the Dixon water-weighted image and overlaid on the TSC map.
Analysis. Statistical analysis was performed in R version 3.6.3 and Matlab 2018 (Mathworks, Natick, MA). Descriptive statistics, including means, standard deviations, and ranges for continuous parameters were calculated, as well as frequencies for categorical parameters. Cohen’s d effect size with 95% confidence interval for paired samples (e.g. pre- vs. post-treatment) was used to evaluate treatment effects.
Results
Participants exhibited either Lipedema Stage 1 (n=3) or Stage 2 (n=2) with early signs of swelling, defined as Lymphedema Stage 0 (n=4) or Stage 1 (n=1). Leg pain (VAS 0-10 scale) improved (pre-treatment mean=4.6±1.8 vs. post-treatment mean=0.0±0.0, p=0.005) with a large treatment effect size (Cohen’s d= -2.5). Primary symptomatology measures of function using PSFS revealed a clinically significant mean change of 3.8 pre- vs. post-treatment (4.5±0.5 vs. 8.3±1.0, p≤0.001, Figure 3) and a large treatment effect (Cohen’s d=4.4). Objective disease-related imaging measures of leg skin sodium showed a trend for a reduction (pre-treatment=14.2±1.7 mmol/L vs. post-treatment=13.0±2.2 mmol/L, 9% reduction, p=0.059, Figure 4) and a large treatment effect size (Cohen’s d= -1.2). A similarly large effect size was observed for leg SAT sodium (pre=10.5±1.4 mmol/L vs. post= 9.7±1.5 mmol/L, 8% reduction, p=0.12, Cohen’s d= -0.9) with the negative effect sizes indicating reduction in tissue sodium.Discussion
Emerging sodium MRI studies suggest the skin and underlying SAT in women with all stages of lipedema contain higher sodium levels compared to females without lipedema with similar BMI8, 10, and such elevated sodium is associated with leg pain in women with lipedema10. This study is the first to evaluate changes in skin and SAT sodium in the lower extremities following a therapy for lipedema. Reduction in both tissue sodium and pain provide additional support for a mechanistic link between tissue sodium and pain in persons with lipedema. Furthermore, treatment findings reveal a positive impact on function in persons with early-staged lipedema.Conclusions
Objective MRI measurement of reduced tissue sodium in the skin and SAT regions following physical therapy in lipedema indicates the relevance of multi-nuclear sodium MRI as a potential new measure of response in interventional trials. Reduction in tissue sodium corroborated with improved patient symptoms including reduced pain and increased function in persons living with early-stage lipedema. This work motivates a future larger trial of early therapy in persons with lipedema.Acknowledgements
Funding was provided by the Lipedema Foundation (Award 12). Imaging experiments were performed in the Vanderbilt Human Imaging Core, using research resources supported by the National Institutes of Health (NIH) grant 1S10OD021771-01 and NIH/NHLBI 1R01HL155523-01, NIH/NHLBI 1R01HL157378-0. We are grateful to Christopher Thompson, Leslie McIntosh, Clair Jones and Marisa Bush for experimental support, and for Philips Healthcare support from Charles Nockowski and Ryan Robinson. We thank our patients for their time and support to advance our understanding in treatment. Recruitment through www.ResearchMatch.org and services at the Clinical Research Center are supported by the National Center for Advancing Translational Sciences (NCATS) Clinical Translational Science Award (CTSA) Program awards UL1TR002243-03 and UL1 TR000445.
References
1. Herbst KL, Kahn LA, Iker E, Ehrlich C, Wright T, McHutchison L, Schwartz J, Sleigh M, Donahue PM, Lisson KH, Faris T, Miller J, Lontok E, Schwartz MS, Dean SM, Bartholomew JR, Armour P, Correa-Perez M, Pennings N, Wallace EL and Larson E. Standard of care for lipedema in the United States. Phlebology. 2021:2683555211015887.
2. Kruglikov IL, Joffin N and Scherer PE. The MMP14-caveolin axis and its potential relevance for lipoedema. Nat Rev Endocrinol. 2020;16:669-674.
3. Dudek JE, Bialaszek W and Ostaszewski P. Quality of life in women with lipoedema: a contextual behavioral approach. Qual Life Res. 2016;25:401-408.
4. Buso G, Depairon M, Tomson D, Raffoul W, Vettor R and Mazzolai L. Lipedema: A Call to Action! Obesity (Silver Spring). 2019;27:1567-1576.
5. Fetzer A FS. Lipoedema UK Big Survey 2014 Research Report. Lipoedema UK. 2016.
6. Reich-Schupke S, Schmeller W, Brauer WJ, Cornely ME, Faerber G, Ludwig M, Lulay G, Miller A, Rapprich S, Richter DF, Schacht V, Schrader K, Stucker M and Ure C. S1 guidelines: Lipedema. J Dtsch Dermatol Ges. 2017;15:758-767.
7. Szolnoky G, Varga E, Varga M, Tuczai M, Dosa-Racz E and Kemeny L. Lymphedema treatment decreases pain intensity in lipedema. Lymphology. 2011;44:178-82.
8. Crescenzi R, Marton A, Donahue PMC, Mahany HB, Lants SK, Wang P, Beckman JA, Donahue MJ and Titze J. Tissue Sodium Content is Elevated in the Skin and Subcutaneous Adipose Tissue in Women with Lipedema. Obesity (Silver Spring). 2018;26:310-317.
9. Kopp C, Linz P, Wachsmuth L, Dahlmann A, Horbach T, Schofl C, Renz W, Santoro D, Niendorf T, Muller DN, Neininger M, Cavallaro A, Eckardt KU, Schmieder RE, Luft FC, Uder M and Titze J. (23)Na magnetic resonance imaging of tissue sodium. Hypertension. 2012;59:167-72.
10. Crescenzi R, Donahue PMC, Petersen KJ, Garza M, Patel N, Lee C, Beckman JA and Donahue MJ. Upper and Lower Extremity Measurement of Tissue Sodium and Fat Content in Patients with Lipedema. Obesity (Silver Spring). 2020;28:907-915.
Figures
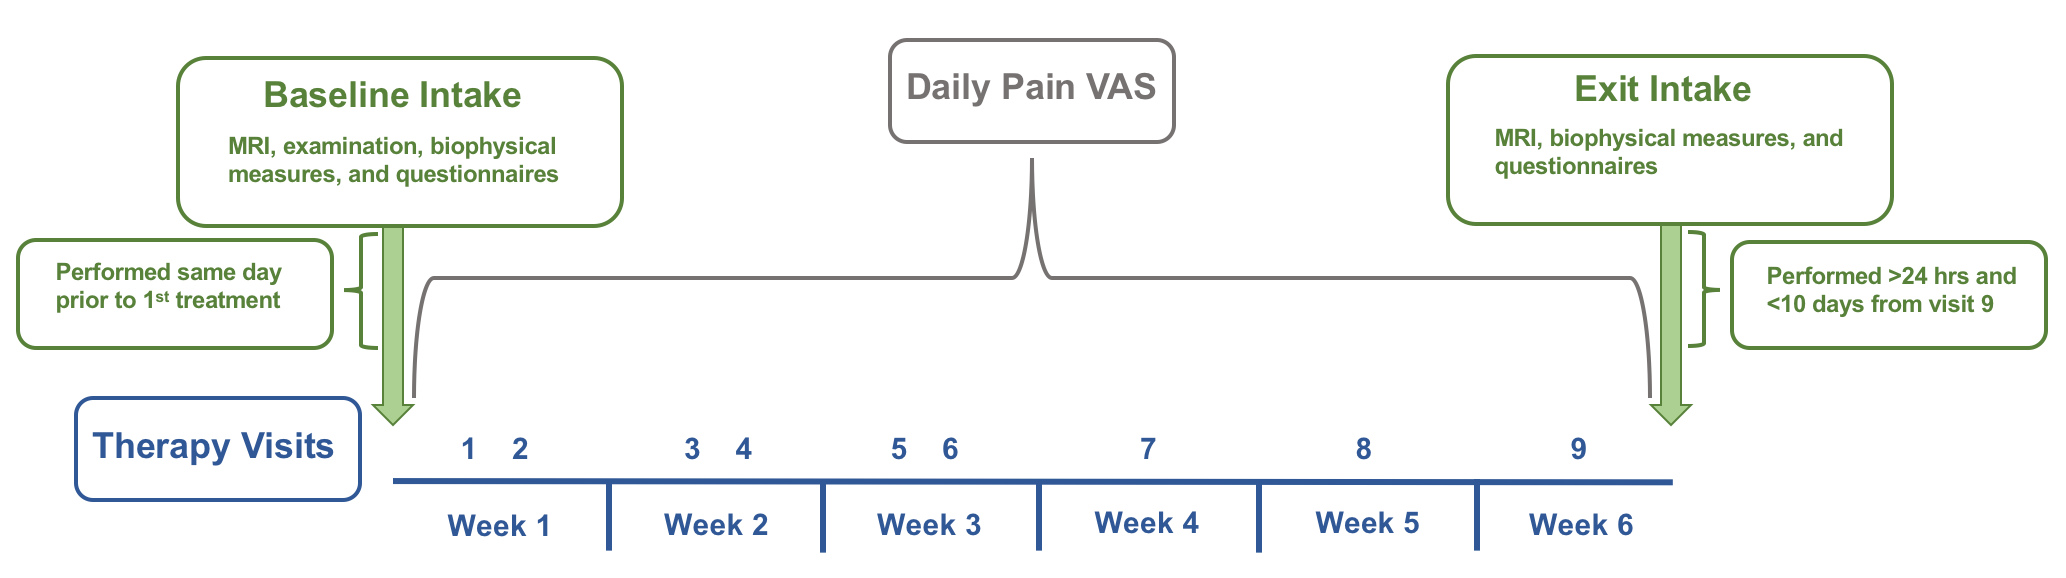
Figure 1: Intervention timeline consisting of nine therapy visits for six weeks, as well as study intake measures before, after, and during therapy. VAS= visual analog scale, MRI= magnetic resonance imaging.
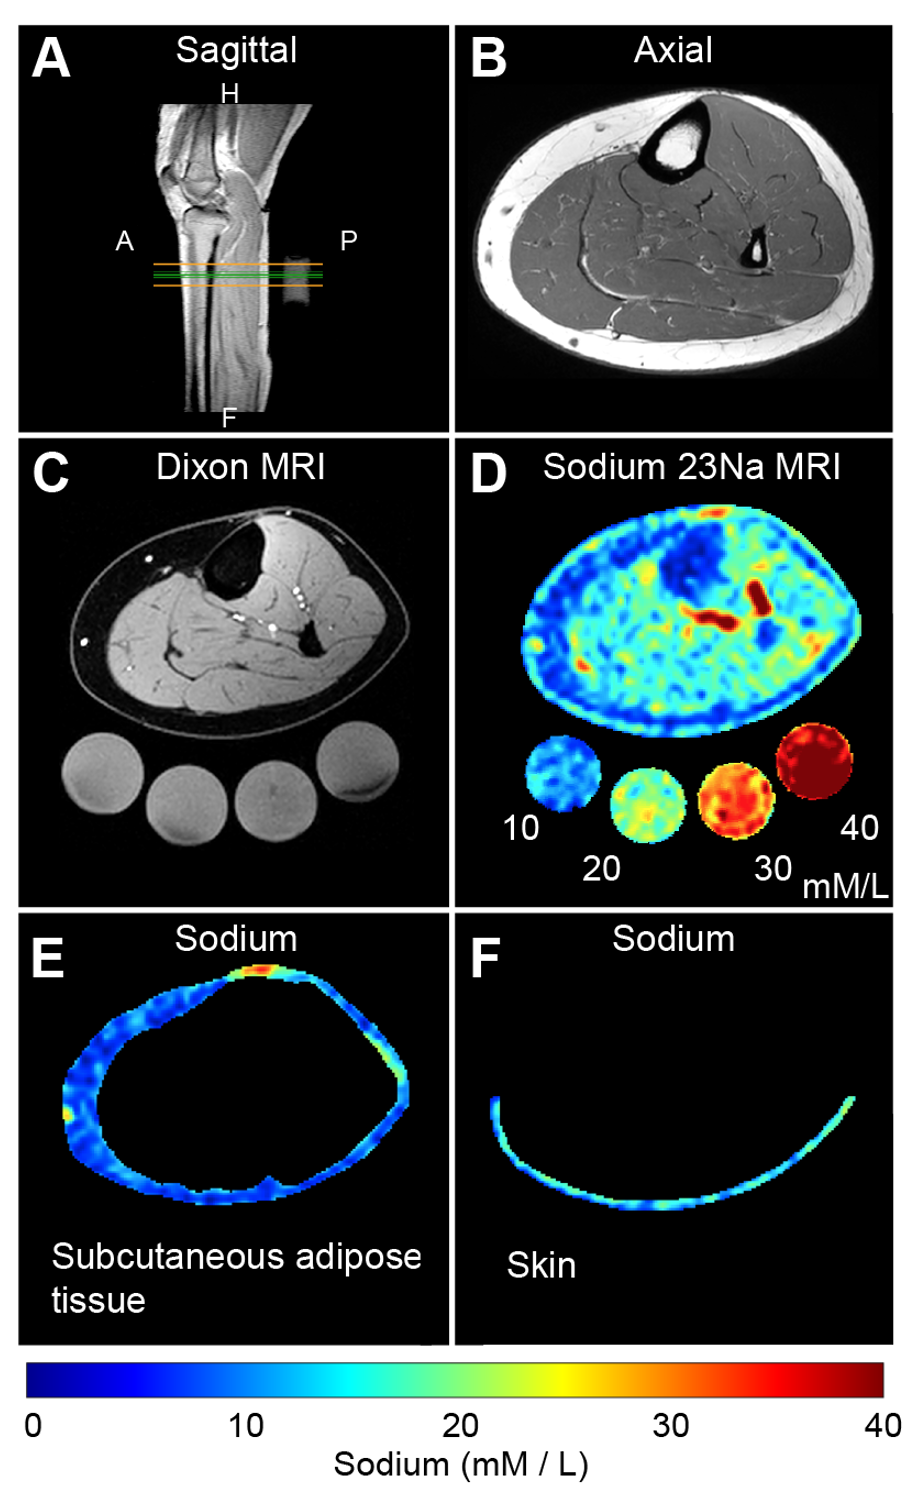
Figure 2. Multi-modal water and sodium MRI. (A) Sagittal T1-weighted localizer with the green line demarcating the water-weighted Dixon MRI and sodium-MRI transverse image location. (B) Corresponding high spatial resolution T1-weighted axial image of leg anatomy. (C) Dixon-MRI water-weighted image and (D) quantified tissue sodium content map with standards below (mM/L). Sodium MRI regions were selected from the (E) subcutaneous adipose tissue (the area between the inner border of the skin and outer border of the muscle) and (F) skin.
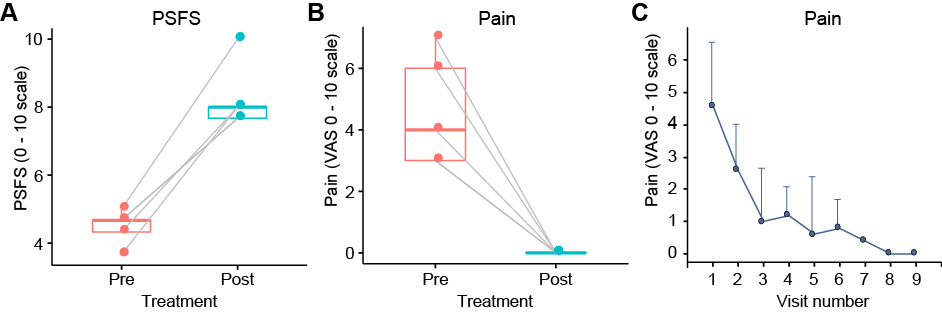
Figure 3. A,B) Boxplot with paired (pre- and post- treatment) data points for each participant for the patient specific functional scale (PSFS) and pain visual analog scale (VAS). Box plots represent the group median (central bar), the upper and lower quartiles (upper and lower bars), and minimum and maximum data points (whiskers with 1.5 interquartile range, IQR). C) The mean pain VAS at each therapy visit. Note that all participants report no pain (0/10) at visits 8 and 9. Error bars denote the standard deviation from the mean.
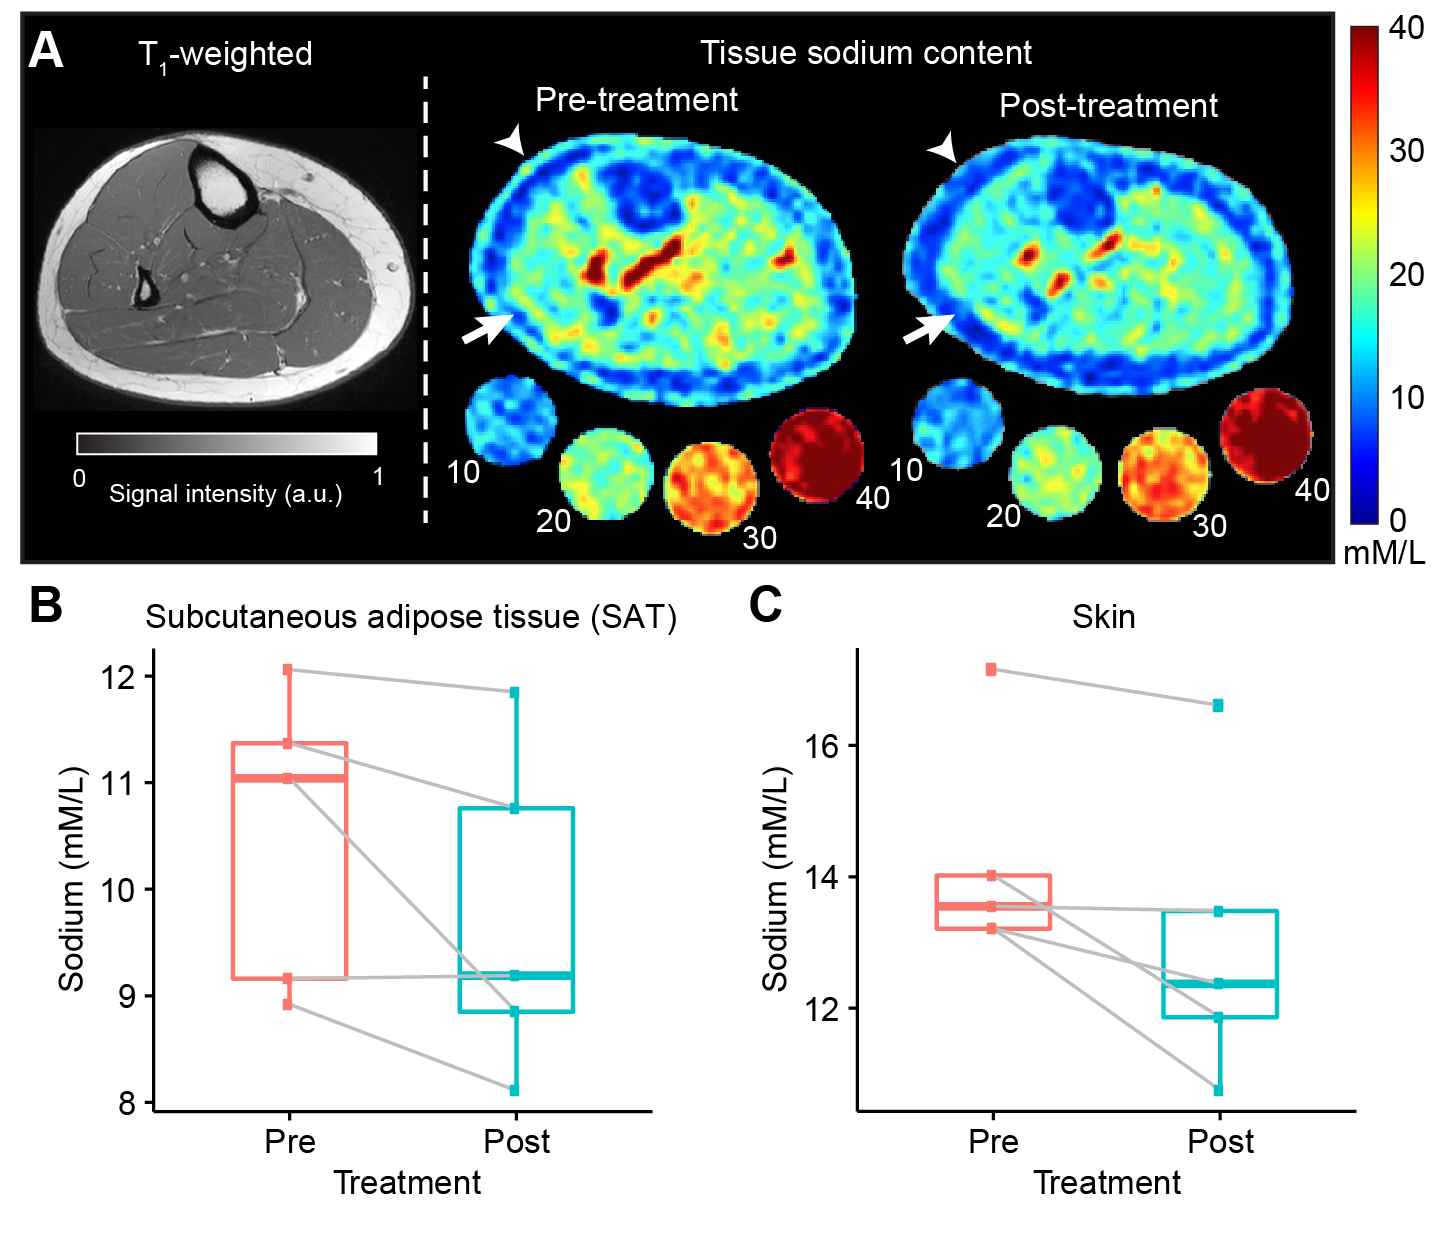
Figure 4. A) Representative patient example (LIP04) showing the T1-weighted image and quantified tissue sodium content (TSC) images pre- and post-treatment. Reductions in TSC can be observed in the skin (arrow heads) and SAT (arrows). B,C) Boxplot with paired (pre- and post-treatment) data points for SAT and skin sodium. Box plots represent the group median (central bar), the upper and lower quartiles (upper and lower bars), and minimum and maximum data points (whiskers with 1.5 interquartile range, IQR).