2820
Augmentation of Diffusion-Encoding Gradient Directions with Deep Learning is not suitable for dMRI clinical studies
Justino Rafael Rodríguez-Galván1, Carmen Martín-Martín1, Antonio Tristán-Vega1, Carlos Alberola-López1, and Santiago Aja-Fernández1
1Laboratorio de Procesado de Imagen, Universidad de Valladolid, Valladolid, Spain
1Laboratorio de Procesado de Imagen, Universidad de Valladolid, Valladolid, Spain
Synopsis
Validation in Deep Learning for enhancement of diffusion Magnetic Resonance Imaging results usually sticks to conventional image similarity metrics. Despite those results, further research on synthetic data may result in discordance with the real one. In this paper we have compared 61 real gradient directions against 61 quasi-identical synthetic gradient directions, obtained by subsampling the real ones, for the assessment of the differences between chronic and episodic migraine patients. Even with high image comparison metrics, differences in t-test are not compelling. For that reason, we do not recommend synthetic images for clinical use.
Introduction
Deep Learning (DL) architectures have been used for gradient directions augmentation in medical imaging to reduce the long acquisition times which are impossible for clinical practice. In diffusion Magnetic Resonance Imaging (dMRI). One example using this kind of techniques for image enhancement1. Validation of these procedures is usually made in terms of similarity metrics as Peak Signal-to-Noise Ratio (PSNR), Structural Similarity Index (SSIM) and Normalized Root Mean Squared Error (NRMSE). However, it has not been validated yet whether or not DL-based dMRI has the same capability to disentangle white matter alterations (WM) within pathological conditions as high-gradient resolution dMRI has.In this paper, we will try to demonstrate the side effects of DL enhancement by comparing quasi-identical synthetic images with gradient augmentation against the original ones in a clinical set-up. To do so, a supervised DL architecture is used2 by means of the synthesis of traditional Diffusion Tensor Imaging (DTI)3,4 parametric maps, namely, Fractional Anisotropy (FA), Axial Diffusivity (AD) and Mean Diffusivity (MD). Statistically significant differences were found between episodic migraine (EM) and chronic migraine (CM) in 5 with 61 native diffusion gradients. Therefore, 61 diffusion gradients will be synthetized from 21 real gradients to see whether these differences are still present after gradient augmentation.Materials
The sample of this study was originally composed of 56 patients with CM, 54 patients with EM and 50 healthy controls (HC) that participated in previous studies5,6. Three patients of EM were discarded due to misregistration errors, one extra EM and one CM as they were measured as outliers.High resolution Diffusion Weighted Images (DWI) were acquired using a Philips Achieva 3T MRI unit. Some acquisition parameters were 61 diffusion gradient orientations, one baseline volume, b-value=1000 s/mm2, 128x128 matrix size and spatial resolution of 2x2x2 mm3.Image preprocessing steps consisted of 1) denoising based on the Marchenko-Pastur Principal Component Analysis procedure7, 2) correction for inhomogeneity distortion and 3) correction B1 field inhomogeneity. The MRtrix software8 was employed to carry out these steps, using the dwidenoise, dwipreproc and dwibiascorrect tools7,9-11.Two groups of dMRI were obtained using the same DWI: 1) 61 real diffusion gradients and 2) 21 gradients derived by subsampling the originals. The DTI-based metrics: FA, MD and AD, were estimated at each voxel using the dtifit tool from the FSL software12, for both groups. All images were transformed into standard space.Methods
Synthesis of DTI images of 61 synthetic gradients was made by a supervised learning approach. Used DL architecture is a version of 2. For training, we fed the CNN with the FA, AD and MD parametric maps obtained from the 61 diffusion gradients. Among the 50 HC volumes, 10 were used for testing, 10 for validation (early stopping), and 30 for loss function optimisation.Since the standard image quality metrics for training were very high, we fed the same trained network with the same parametric maps for EM and CM patients. The assessment of the resultant set was made both for standard quality image metrics and for statistically significant differences known to be present beforehand after5. For the statistical analysis, the average value of the measures on the FA-skeleton inside each region of interest (ROI) from the JHU ICBM-DTI-81 WM Atlas13,14 was calculated using the 2% and 98% percentiles and compared with a t-test. Then, post-hoc two-by-two comparisons were carried out between EM and CM. Finally, the results were considered statistically significant in each ROI for p<0.05.Results
Results are presented as follows. In Figure 1, the three DTI-based measures obtained by 21 and 61 real diffusion gradients and 61 synthetic are depicted. As it can be seen, all of them look very similar. Table 1 shows the standard image metrics results for training in HC and for EM and CM patients. Finally, the results of the t-test are placed in table 2.Discussion
As we can see in the previous section, if we only take care of image metrics, every parametric map seems to be quasi-identical compared to the original one. Regarding the statistical analysis, more significant ROIs are obtained with measures from 61 real gradients than from 21. Additionally, all significant ROIs detected with 21 gradients are presented with 61. However, when synthetic images are used to look for statistically significant differences between CM and EM, the number of ROIs drastically decreases, being even lower than when using 21 diffusion gradients.Conclusion
Image comparison quality metrics are acceptable for applications demanding visual quality. However, in clinical studies, DL reconstruction should be taken with care as they need extra data processes and its way of functioning could interfere with them, because it creates spurious differences unpresent in real data. In this sense, validation must be consistent with the usefulness of data. Thereby, the question that arises is whether these DL schemas can be used in clinical applications. So far it seems that the consensus is positive. Nevertheless, validations have not been based on what really matters and it could be that, by creating data from HC, differences are eliminated when applied to patient subjects.Acknowledgements
References
- Tian, Q., Bilgic, B., Fan, Q., Liao, C., Ngamsombat, C., Hu, Y., ... & Huang, S. Y. (2020). DeepDTI: High-fidelity six-direction diffusion tensor imaging using deep learning. NeuroImage, 219, 117017.
- Chartsias, A., Joyce, T., Giuffrida, M. V., & Tsaftaris, S. A. (2017). Multimodal MR synthesis via modality-invariant latent representation. IEEE transactions on medical imaging, 37(3), 803-814.
- Basser, P. J., J, M., & D, L. (1994). MR diffusion tensor spectroscopy and imaging. Biophysical Journal, 66(1), 259–267. https://doi.org/10.1016/S0006-3495(94)80775-1
- Westin, C., SE, M., H, M., A, N., FA, J., & R, K. (2002). Processing and visualization for diffusion tensor MRI. Medical Image Analysis, 6(2), 93–108. https://doi.org/10.1016/S1361- 8415(02)00053-1
- Planchuelo-Gómez, Á., García-Azorín, D., Guerrero, Á. L., de Luis-García, R., & Aja-Fernández, S. (2020a). White matter changes in chronic and episodic migraine: a diffusion tensor imaging study. The Journal of Headache and Pain 2019 21:1, 21(1), 1–15. https://doi.org/10.1186/S10194-019-1071-3
- Planchuelo-Gómez, Á., García-Azorín, D., Guerrero, Á. L., Aja-Fernández, S., Rodríguez, M., & de Luis-García, R. (2020b). Structural connectivity alterations in chronic and episodic migraine: A diffusion magnetic resonance imaging connectomics study. Cephalalgia, 40(4), 367–383. https://doi.org/10.1177/0333102419885392
- Veraart, J., Novikov, D. S., Christiaens, D., Ades-aron, B., Sijbers, J., & Fieremans, E. (2016). Denoising of diffusion MRI using random matrix theory. NeuroImage, 142, 394–406. https://doi.org/10.1016/j.neuroimage.2016.08.016
- Tournier, J. D., Smith, R., Raffelt, D., Tabbara, R., Dhollander, T., Pietsch, M., Christiaens, D., Jeurissen, B., Yeh, C. H., & Connelly, A. (2019). MRtrix3: A fast, flexible and open software framework for medical image processing and visualisation. In NeuroImage (Vol. 202). Academic Press Inc. https://doi.org/10.1016/j.neuroimage.2019.116137
- Andersson, J. L. R., & Sotiropoulos, S. N. (2016). An integrated approach to correction for offresonance effects and subject movement in diffusion MR imaging. NeuroImage, 125, 1063–1078. https://doi.org/10.1016/j.neuroimage.2015.10.019
- Smith, S. M., Jenkinson, M., Woolrich, M. W., Beckmann, C. F., Behrens, T. E. J., Johansen-Berg, H., Bannister, P. R., De Luca, M., Drobnjak, I., Flitney, D. E., Niazy, R. K., Saunders, J., Vickers, J., Zhang, Y., De Stefano, N., Brady, J. M., & Matthews, P. M. (2004). Advances in functional and structural MR image analysis and implementation as FSL. NeuroImage, 23(SUPPL. 1), S208–S219. https://doi.org/10.1016/j.neuroimage.2004.07.051
- Zhang, Y., Brady, M., & Smith, S. (2001). Segmentation of brain MR images through a hidden Markov random field model and the expectation-maximization algorithm. IEEE 39 Transactions on Medical Imaging, 20(1), 45–57. https://doi.org/10.1109/42.906424
- Jenkinson, M., Beckmann, C. F., Behrens, T. E. J., Woolrich, M. W., & Smith, S. M. (2012). FSL. NeuroImage, 62(2), 782–790. https://doi.org/10.1016/j.neuroimage.2011.09.015
- Hua, K., Zhang, J., Wakana, S., Jiang, H., Li, X., Reich, D. S., Calabresi, P. A., Pekar, J. J., van Zijl, P. C. M., & Mori, S. (2008). Tract probability maps in stereotaxic spaces: Analyses of white matter anatomy and tract-specific quantification. NeuroImage, 39(1), 336–347. https://doi.org/10.1016/j.neuroimage.2007.07.053
- Mori, S., Van Zijl, P., & Tamminga, C. A. (2007). Human white matter atlas. American Journal of Psychiatry, 164(7), 1005. https://doi.org/10.1176/ajp.2007.164.7.1005
Figures
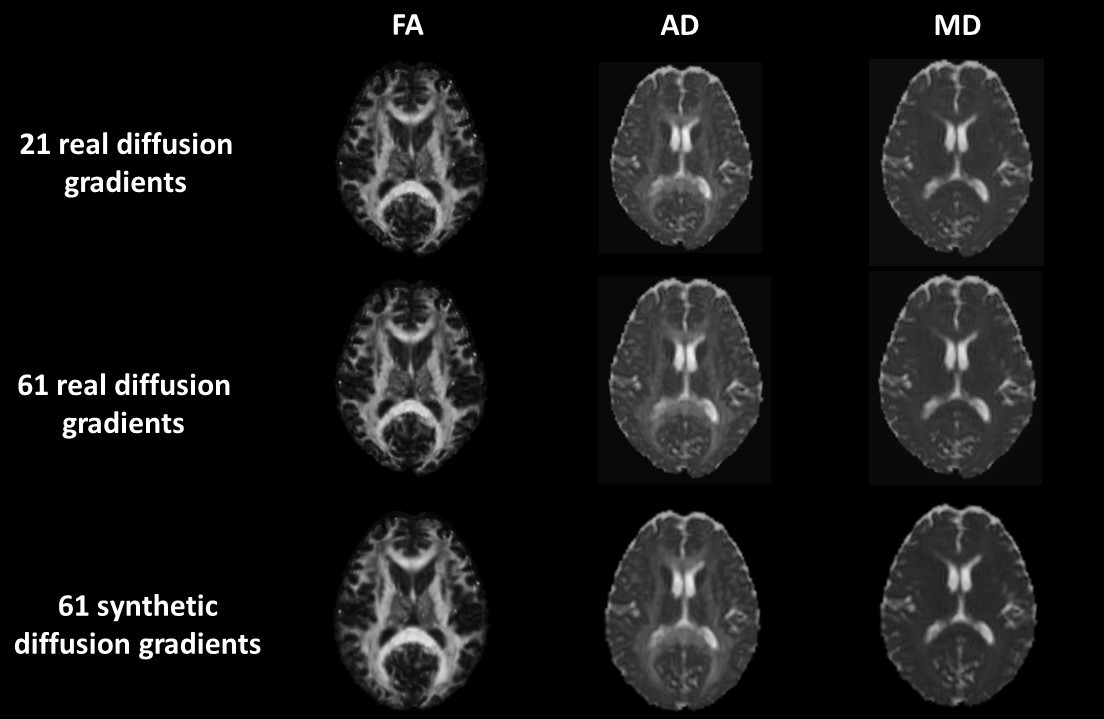
Figure 1: FA, AD and MD DTI-based measures (columns) and 21 and 61 real, 61 synthetic diffusion gradients (lines).
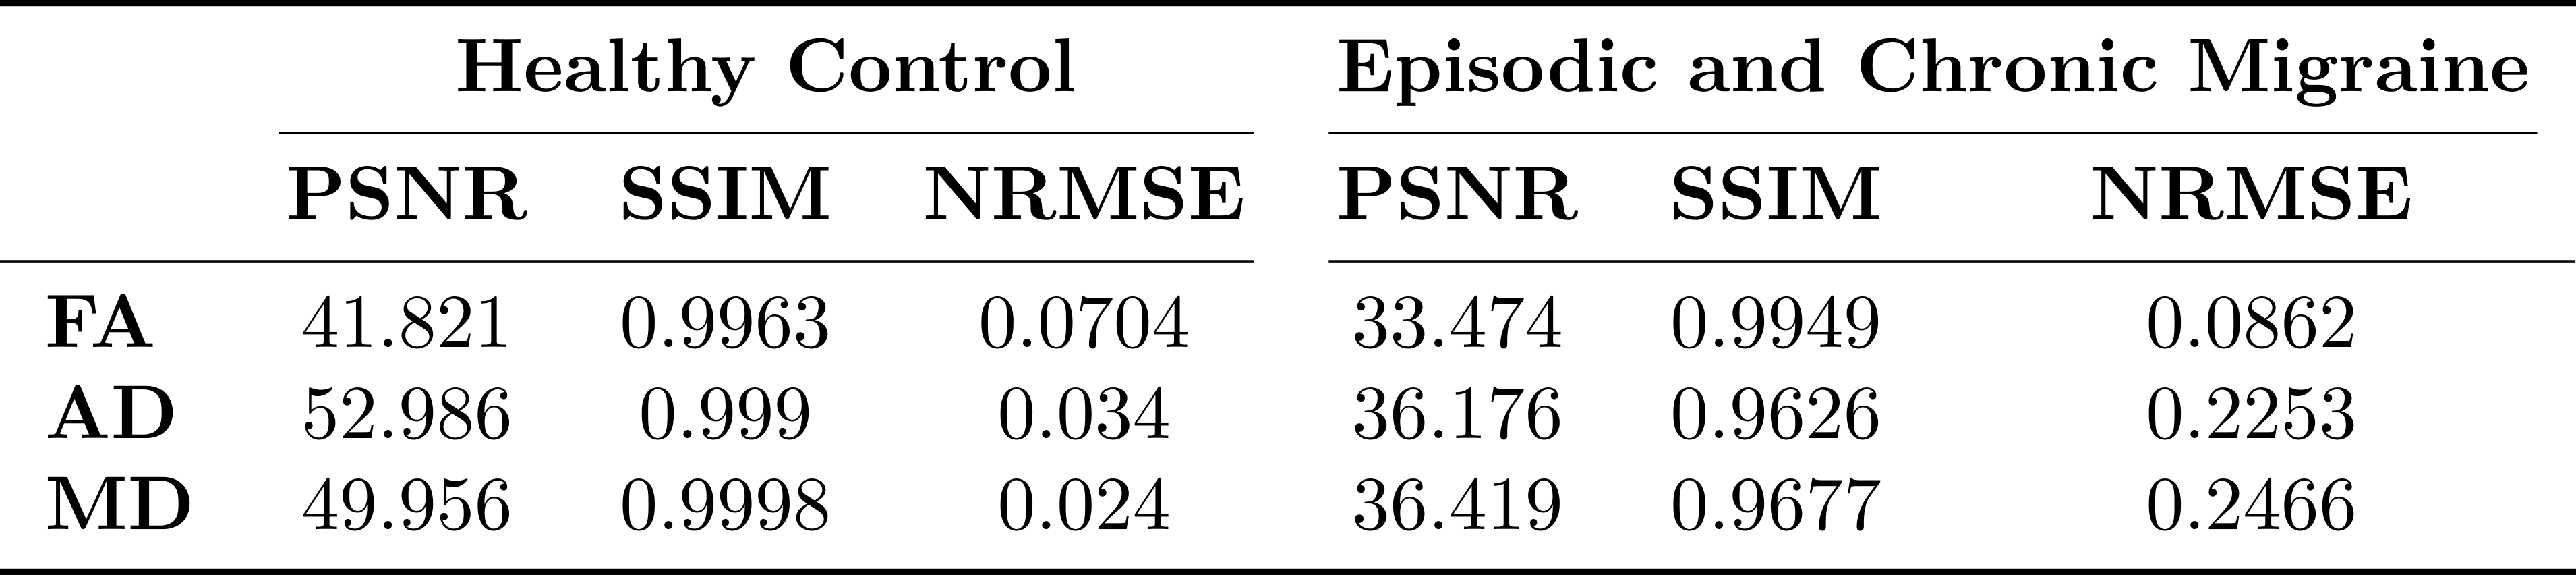
Table 1: Mean image similarity metrics for training with healthy controls (HC) and for test with episodic migraine (EM) and chronic migraine (CM) patients.
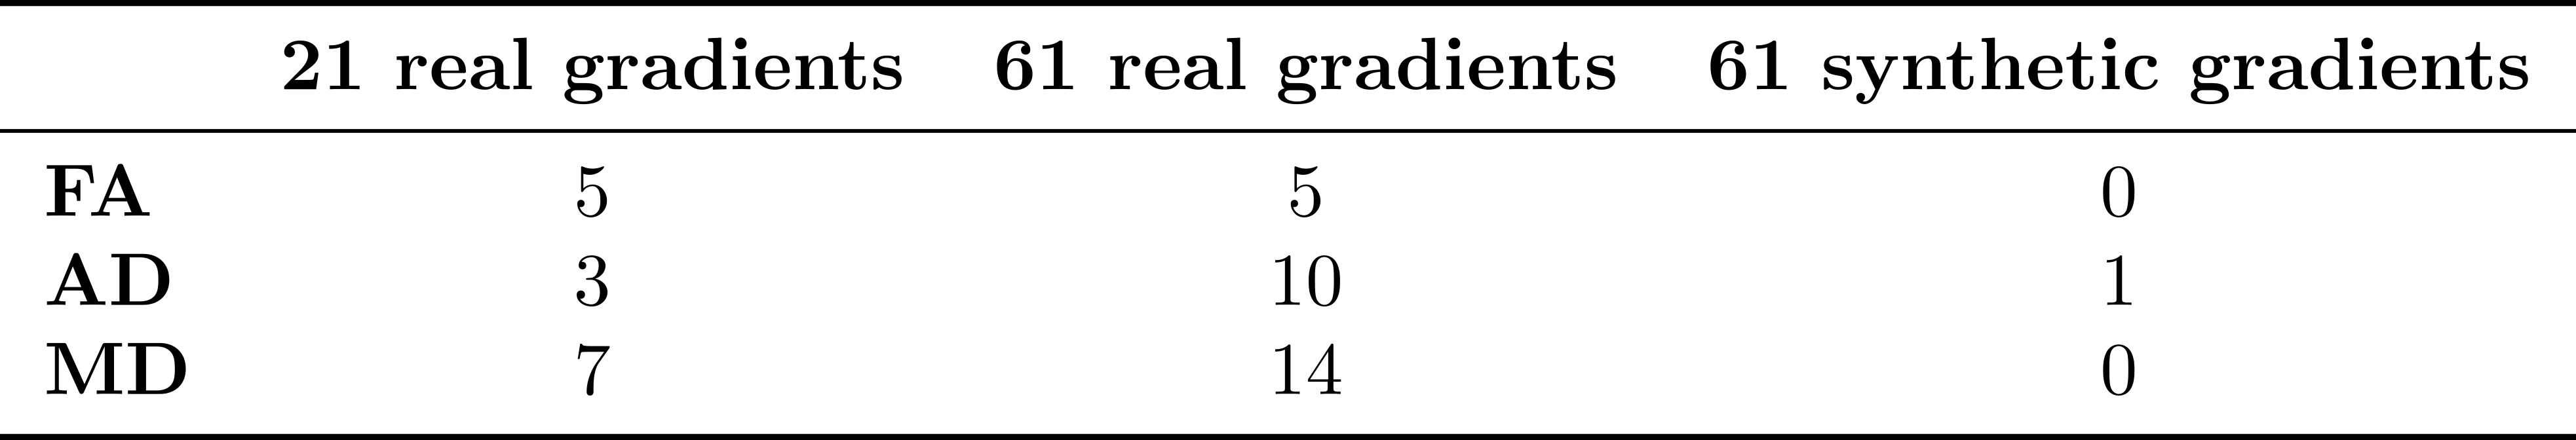
Table 2: Number of ROIs with statistically significant differences between episodic migraine (EM) and chronic migraine (CM).
DOI: https://doi.org/10.58530/2022/2820