2811
Reduced field of view CEST for high performance prostate imaging at 3T human scanner
Xubin Chai1,2, Chuyu Liu1, Chu Wang1, Rong Xue2, and Xiaolei Song1
1Center for Biomedical Imaging Research, Department of Biomedical Engineering, Tsinghua University, Beijing, China, 2State Key Laboratory of Brain and Cognitive Science, Institute of Biophysics, Chinese Academy of Sciences, Beijing, China
1Center for Biomedical Imaging Research, Department of Biomedical Engineering, Tsinghua University, Beijing, China, 2State Key Laboratory of Brain and Cognitive Science, Institute of Biophysics, Chinese Academy of Sciences, Beijing, China
Synopsis
For imaging small-sized organs like the prostate, reduced-field-of-view (rFOV) technique is useful for shortening scan time, increasing resolution and reducing artifacts caused by field inhomogeneity and motion. Herein on a 3T clinical scanner, rFOV CEST was obtained using an off-resonance saturation preparation (seconds long), followed by readouts at the crossing section of a 90 deg excitation slab and a 180 deg refocus slab that had an angle in between. For saturation powers of 0.7 uT and 2 uT, CEST contrast maps and quantitative curves suggested the rFOV-CEST outperformed the Traditional-FOV acquisitions, which has potential for prostate CEST imaging at 3T.
Introduction:
Reduced-field-of-view (rFOV) technique had shown its superiority in imaging small-sized organs, for shortening scan time, increasing resolution and reducing artifacts caused by field inhomogeneity and motion[1]. Given the demands for high spatial and spectral resolution prostate CEST imaging, we examined the performance of a rFOV readout technique in comparison with a traditional CEST method on a 3T clinical scanner, in aspects of scan time, resolution and quantitative contrast maps and curvesMaterials and Methods:
For proof of concept, two healthy volunteers underwent prostate MR examination (males, 29 years and 40 years), both with written informed consent signed before participation. MR scans were performed on a 3T scanner (Ingenia CX 3.0T; Philips Medical Systems, Best, The Netherlands), using a 16-channel torso coil and a 12-channel posterior coil as the receivers. A transverse plane crossing the prostate center was chosen for both traditional full FOV readout and the rFOV readout. As listed in Table1, two sets of rFOV were acquired, with in-plane resolution of 2.5 mm X 2.5 mm (rFOV_2.5) and 1.5 mm X 1.5 mm (rFOV_1.5) respectively. rFOV-CEST was achieved using an adjusted sequence based on the APT patch with Turbo-Spin-Echo (TSE) readouts, in combination with Philips zoom technique. Briefly, after a 2-seconds long off-resonance saturation preparation, rFOV only read signal selectively at the crossing section of a 90 deg excitation slab and a 180 deg refocus slab that had an angle in between (Figure 1). Two series of CEST Z-spectral data were acquired, one with saturation power of 0.7 uT and 33 offsets distributed from -10 ppm to 10ppm, another with 2 uT saturation and 19 offsets from -4.5 ppm to 4.5 ppm with 0.5 ppm step size. The rest parameters of all datasets are shown in Table1. All data were processed using custom-written MATLAB scripts, with MTRasym at 3.5 ppm for CEST quantification. In addition, for 0.7uT saturation the Lorentzian Difference were employed both for the contrast maps and the curves.Results and Discussion:
Figure 2 showed the contrast maps and the quantitative curves of the whole prostate region, using a 2uT saturation power employed by the standard APTw protocol. As seen, the normalized saturation-weighted image at -3.5 ppm and at 3.5 ppm have almost identical contrast distribution, for the 2.5 mm in-plane resolution acquired using either traditional FOV (tra_FOV) or reduced FOV technique (rFOV_2.5). Noted that for the pseudo-colored images only zoomed prostate region is displayed for comparison. It proved that rFOV could reduce the scan time by half while kept the same contrast as the traditional method. Furthermore, a smaller FOV with a 1.5mm×1.5mm in-plane resolution could be achieved using ~3min, which displayed better structure details on all maps. Furthermore, compared with traditional methods, rFOV methods displayed almost identical Zspectra and very closed MTRasym curves, that averaged for the entire prostate Figure 3 showed five kinds of contrast maps, as well as the averaged Zspectra and the Lorentzian Difference (LD) spectra f the entire prostate region, using a 0.7uT saturation power with better spectral resolution. Both sets of rFOV acquisition exhibited more homogeneous Z(3.5 ppm) and Z(-3.5 ppm) images, than the full FOV one which has an artifacts as pointed by the arrow. Moreover, owing to the high-resolution on the rFOV_1.5 acquisition, the quantitative MTRasym and the amide map by LD, displayed higher contrast and better anatomy on central zone (CZ) of prostate than the tra_FOV. The averaged LD spectra of the entire prostate show very similar shapes, with the rFOV spectra exhibiting higher amide peak that benefit from the single-shot readouts. In addition, more detailed ROI analysis of different zones of prostate could be allowed, with the spectrum of CZ displaying clear amide peak.Conclusion:
For saturation powers of 0.7 uT and 2 uT, CEST contrast maps and quantitative curves suggested the rFOV-CEST outperformed the Traditional-FOV acquisitions, which has potential for prostate CEST imaging at 3T.Acknowledgements
The authors acknowledged funding from National Natural Science Foundation of China (82071914). and the startup package from Tsinghua University to Dr. Song.References
1. Liu Q, Jin N, Fan Z, Natsuaki Y, Tawackoli W, Pelled G, et al. Reliable chemical exchange saturation transfer imaging of human lumbar intervertebral discs using reduced-field-of-view turbo spin echo at 3.0 T. NMR Biomed 2013; 26(12):1672-1679Figures
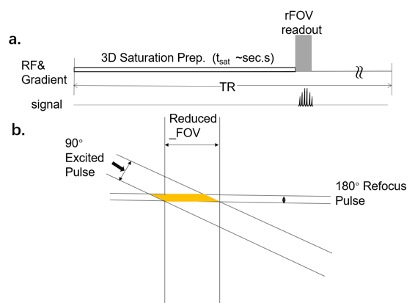
Fig.1 a. The
CW readout method of CEST imaging. b. The Zoom method we used in this
research.
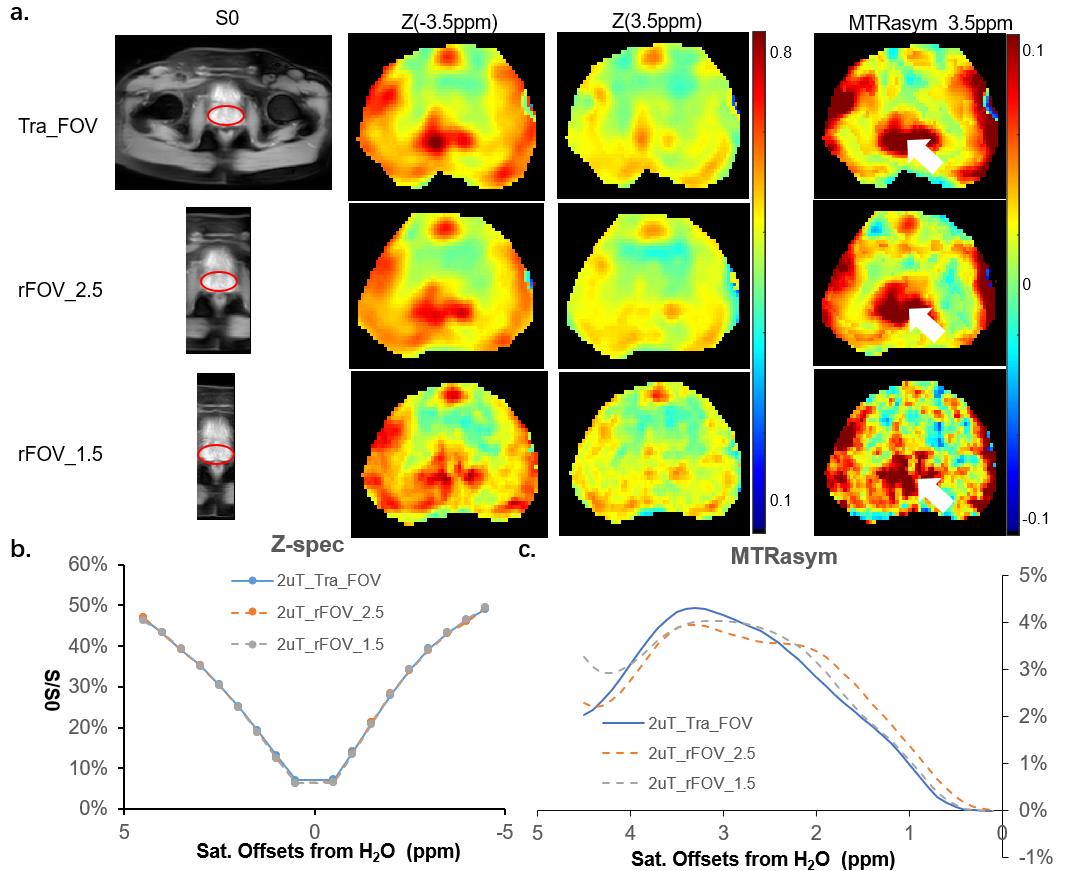
Fig.2 CEST images and spectra for saturation B1 strength of 2 uT a. CEST images for three different acquisition sequences, Tra_CEST (Row 1), rFOV_2.5 (Row 2) and rFOV_1.5 (Row 3). From left to right,S0 with the actual acquired size, the Z-spectral image at 3.5ppm (Z(3.5ppm)) , Z(-3.5ppm) and MTRasym (3.5ppm). Noted that for the pseudo-colored images only zoomed prostate region is displayed for comparison. b&c The averaged Z-spectra and MTRasym curved of the entire prostate, acquired by the three acquisitions. of the three sequences
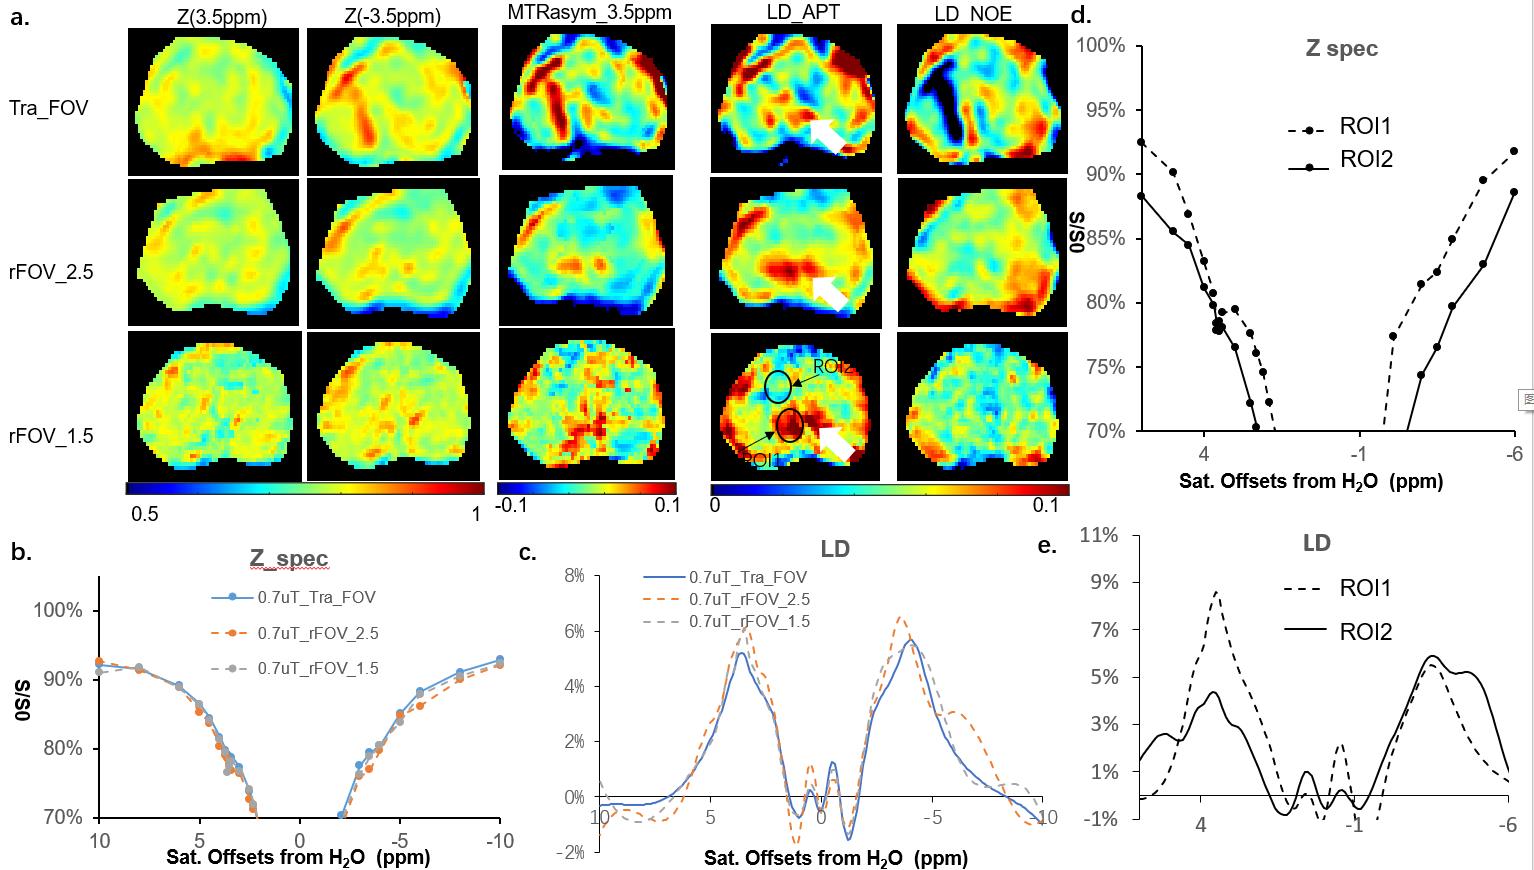
Fig.3 CEST images and spectra for B1,s of 0.7 uT a. CEST images for three different acquisition sequences, Tra_CEST (Row 1), rFOV_2.5 (Row 2) and rFOV_1.5 (Row 3). From left to right,S0 with the actual acquired size, the Z-spectral image at 3.5ppm (Z(3.5ppm)) , Z(-3.5ppm), MTRasym (3.5ppm),LD_APT and LD_NOE. Noted that for pseudo-colored images only zoomed prostate region. b&c The averaged Z-spectra and LD curves of entire prostate, acquired by the three acquisitions. d&e The averaged Z-spectra and LD spectra for two ROIs (displayed on LD_Amide of rFOV_1.5), acquired by rFOV_1.5.
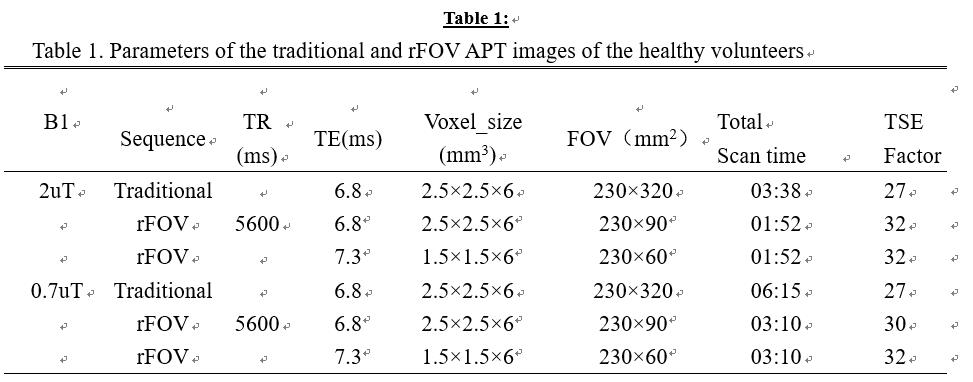
Fig.4 Parameters of the traditional and rFOV APT
images of the healthy volunteers.
DOI: https://doi.org/10.58530/2022/2811