2806
Healthy vs pathological tau can be differentiated by CEST NMR1Radiology, University of Texas Southwestern Medical Center, Dallas, TX, United States, 2Advanced Imaging Reseach Center, University of Texas Southwestern Medical Center, Dallas, TX, United States, 3Neurology, University of California, Irvine Medical Center, Irvine, CA, United States
Synopsis
Alzheimer’s Disease (AD) is defined biologically by the presence of neuritic plaques composed of amyloid-in β (Aβ)peptides and dystrophic neurites, neurofibrillary tangles (NFTs) of hyperphosphorylated tau protein, and neuronal loss. In this study, CEST experiments were performed on purified full-length tau monomer and aggregated tau fibrils. We found differences in CEST z-spectra between purified full-length tau monomers and aggregated tau fibrils. This finding substantiates the potential use of CEST for ultimately monitoring disease progression in AD patients
Introduction
Alzheimer’s Disease (AD) is the leading cause of dementia, afflicting 45 million worldwide(1) is defined biologically by the presence of neuritic plaques composed of amyloid-b (Ab) peptides and dystrophic neurites, neurofibrillary tangles (NFTs) of hyperphosphorylated tau protein, and neuronal loss as formalized under the AT(N) research framework.(2) In particular, NFTs have drawn considerable interest as potential therapeutic targets due to their strong association with neurodegeneration.Chemical Exchange Saturation Transfer (CEST) has emerged as a promising MRI technique that can detect low concentration chemical species with exchangeable protons, which are non-visible by standard MRI methods. Studies have demonstrated the sensitivity of CEST to protein state, including conformation and folding structure, in vitro (3) as well as in vivo (4). In this study, CEST experiments were performed on purified full-length tau monomer and aggregated tau fibrils to examine whether each form of tau has a specific CEST signature. Differences in these signatures could potentially be used to inform future in vivo studies in animal models and ultimately in AD patients.
Methods
Phantom preparationPurified monomeric human full-length tau protein (2N4R) was created from cDNA coding for the protein that had been transformed into E. coli BL21. Tau fibrils were then generated from specimens of monomeric tau by incubating with heparin at 370C for 3 days. Two sets of phantoms were used: 1) A 5 mg sample of lyophilized recombinant full-length tau monomer was dissolved in a 150 mL solution of 10 mM 4-(2-hydroxyethyl)-1-piperazineethanesulfonic acid (HEPES) buffer and 100 mM NaCl at a pH of 7.4. 2) The fibrillated tau was dissolved in 217 uL of the HEPES buffer solution to yield a concentration of 250 uM.
In vitro MR experiments
All CEST experiments were performed using a 9.4 T vertical bore Varian NMR spectrometer. Two sets of RF pulse intensities (B1) were utilized: 1.3 and 2 μT, and applied over a 2 second saturation pulse duration. These were performed at two temperatures: 37, and 420C. Z-spectra were acquired in the +/-10ppm range, using 0.25 ppm step (total of 82 points). The same set of acquisition parameters were utilized for the tau monomer and fibrillated tau.
Data analysis
The standard Magnetization Transfer Asymmetry (MTRasym) analysis was utilize to characterize the Z-spectra.
Results
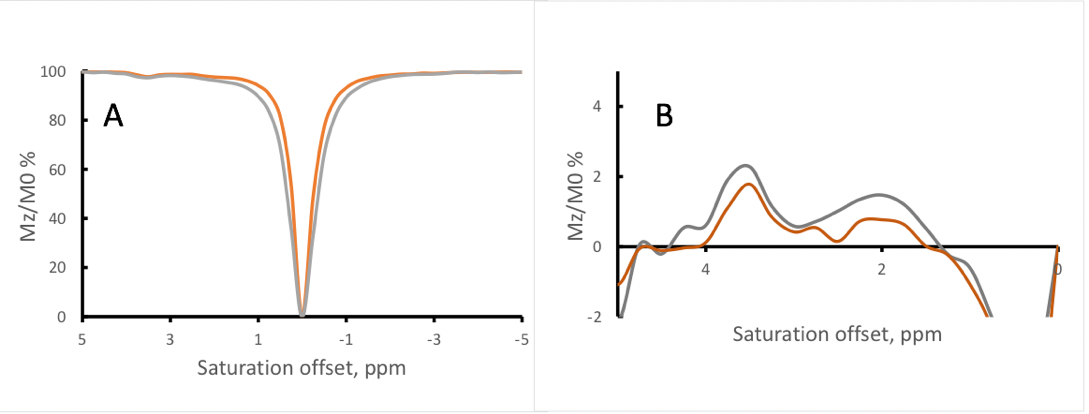
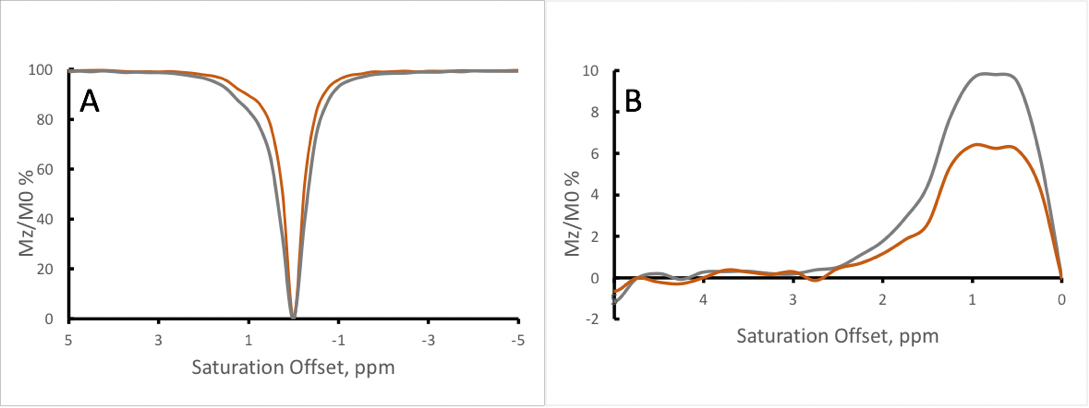
Figure 1 shows the Z-spectra of the tau monomer obtained at 370C. Peaks were observed at 2, and 3.5 ppm downstream of the water resonance frequency. A negative MTRasym is observed closer to water resonance, which might be due to presence of an additional peak at -0.5-1ppm or experimental imperfection (B0). With increasing B1, the signal intensity of the Z-spectrum peaks is increased. However, there is also broadening of the lineshape of the Z-spectrum, as can be expected with the increased B1.Figure 2 shows the Z-spectra of the tau fibrils obtained at 370C. One large peak is observed at an offset of approximately 1 ppm, and its intensity increases with increasing RF power level.
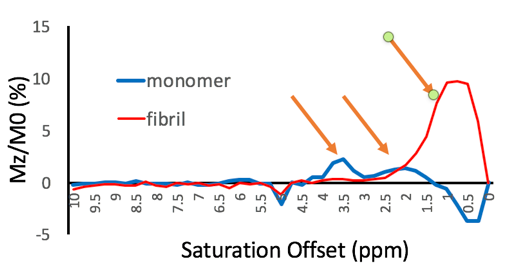
Figure 3 shows the analysis comparing tau monomer to tau fibrils. It is evident that the fibrillated tau lacked peaks at 2 and 3.5 ppm that were present on the tau monomer.
Discussion
A possible explanation for our observations is that through forming structurally relevant hydrogen bonds in the fibrillated tau specimen, the effective exchange rate of internal amino acid residues sequestered from the water pool may become reduced and no longer detectable by CEST. Additionally, individual molecules of tau monomers have relatively rapid internal motions and molecular tumbling, potentially resulting in a sharper Z-spectrum (as long as the system remains in the slow exchange limit) that allows the delineation of specific peaks. However, as proteins aggregate, the internal motions and tumbling tend to slow, resulting in broadening of the line-shape of the Z-spectrum and overall coalescence of the spectral features.Currently, we are conducting a fitting of the experimental data using multi-pool Bloch-McConnel equations. This quantitative assessment should provide exchange rates and could help elucidate the origins of the observed differences between tau and fibrils.
Conclusion
We found differences in CEST z-spectra between purified full-length tau monomers and aggregated tau filaments. While additional experiments are needed, including the influence of different tau preparation methods, this finding substantiates the potential use of CEST for ultimately monitoring disease progression in AD patients as reflected by increased NFT deposition. Additional studies are in progress to validate these findings.Acknowledgements
The work is supported in part by the Texas Alzheimer's Research & Care Consortium Junior Investigator Grant.References
1. C. R. Jack et al., Transition rates between amyloid and neurodegeneration biomarker states and to dementia: a population-based, longitudinal cohort study. Lancet Neurol 15, 56-64 (2016).
2. C. R. Jack et al., NIA-AA Research Framework: Toward a biological definition of Alzheimer's disease. Alzheimer's & Dementia: The Journal of the Alzheimer's Association 14, 535-562 (2018).
3. D. L. Longo et al., Chemical exchange saturation transfer (CEST): an efficient tool for detecting molecular information on proteins' behaviour. Analyst 139, 2687-2690 (2014).
4. Y. Zhu et al., Non-invasive imaging of disrupted protein homeostasis induced by proteasome inhibitor treatment using chemical exchange saturation transfer MRI. Scientific Reports 8, 15068 (2018).
Figures