2805
Dynamic Glucose Enhanced (DGE) CEST imaging at 3T: from phantom to patient with brain metastases1Department of Radiology & Nuclear Medicine, Erasmus MC, Rotterdam, Netherlands, 2Department of Medical Oncology, Erasmus MC, Rotterdam, Netherlands, 3Department of Neurology, Erasmus MC, Rotterdam, Netherlands, 4Centre for Neuroimaging Science, King's College London, London, United Kingdom
Synopsis
To develop detection of glucose contrast enhancement (GCE) with CEST for assessing brain metastases in clinical setting, here we performed a phantom study, scanned 10 healthy volunteers and one patient with brain metastases at 3T. We acquired dynamic GCE at 1.2 and 2 ppm for dynamic B0 correction and applied principle component analysis (PCA) to perform noise reduction, after which we compared the resulting GCE at both offsets. The developed pipeline resulted in GCE of ~5% in tumor and -5 to 0.05% in healthy tissues after glucose infusion.
Introduction
Dynamic glucose enhanced (DGE) CEST is being considered for the advanced characterization of brain lesions1 in which glucose is of interest. Since glucose has off-resonance peaks between 1-4 ppm2, the exact off-resonance frequency used for DGE varies. Additionally, the effect size of glucose enhancement, in particular in healthy tissues at 3T is small. To address these issues, we investigated a set-up and analysis pipeline for DGE CEST on a hybrid 3T PET/MR system in which we tested the use of two different offsets (1.2 and 2 ppm) and extended the analysis pipeline to include dynamic B0 correction and principle component analysis (PCA) to improve DGE detection.Method
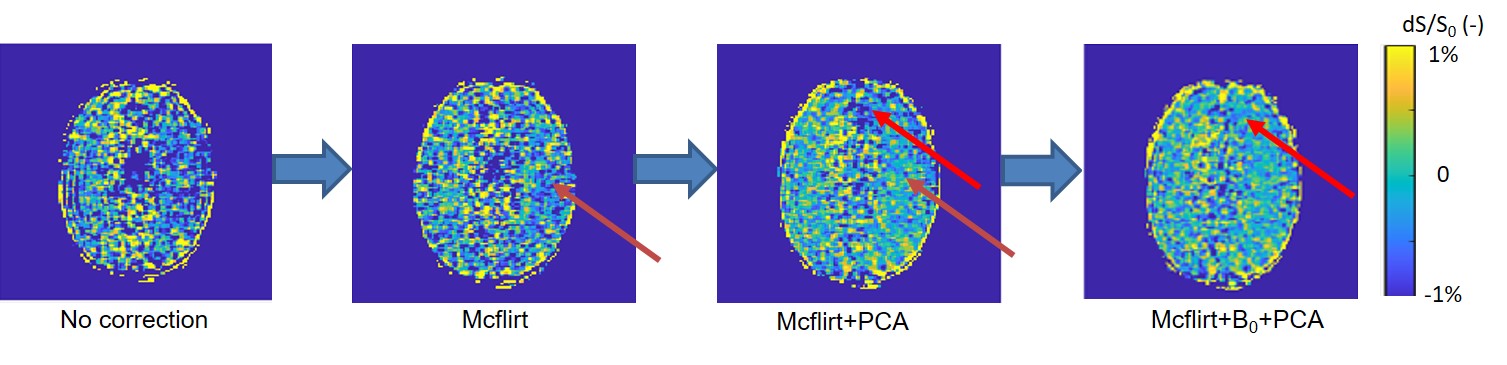
This study was conducted under approval of the institutional ethics committee of Erasmus MC. A 3T PET/MR scanner with a 24 channel head coil (General Electric, Chicago, USA) was used. A phantom was constructed with glucose concentrations of 0, 2.5, 10, 40 mM with cross-linked bovine serum albumin (BC) based on Xu et al3. Static CEST scans were performed using snapshot acquisition4 with B1=1.5 µT, 14 slices, 1.7×1.7×3 mm3, 80 pulses (20 ms saturation,50% duty cycle). The last of 4 images acquired at 300 ppm was selected as S0 image. Saturated S image were acquired at 35 off-sets (-100~100 ppm), yielding 4min30s in each static scan. 10 healthy volunteers (M/F=3/7, aged 19-31 y) and one patient (female, 55y) with brain metastases were recruited. Two static scans were performed, between which DGE scanning was acquired at 128 time points (88 points for patient scan) at single 1.2 ppm (N=4)/2 ppm (N=1) or interleaved at 1.2 and 2 ppm (N=6). Glucose infusion (50mL 50% D-glucose [25g] in 3.3 minutes) was performed after 3 minutes delay, during and after which venous blood samples were collected.In DGE time course, S images were linearly aligned into the second S image by mcflirt5. Dynamic B0 correction was applied after the normalization of time course, by determining the B0 shift via linear interpolation between the B0 maps from two static scans6. After that, the first 3 components of principle component analysis (PCA) were obtained to reduce the noise of time course. Regions of interest (ROI) were created for tubes of phantom, and white matter (WM), CSF, sagittal sinus (SS) and tumor for human studies. For the phantom study, glucose contrast enhancement (GCE) was calculated by subtracting the S/S0 (1.2 ppm) of the tubes with "2.5/10/40 mM glucose + BC" from the one of the tube with only BC. In human studies, GCEt=(Sbase-S(t))/S0 (at 1.2/2 ppm), where Sbase was the mean of first S images before the infusion. Subsequently, GCE of each time point was averaged in ROIs for further comparison.
Results
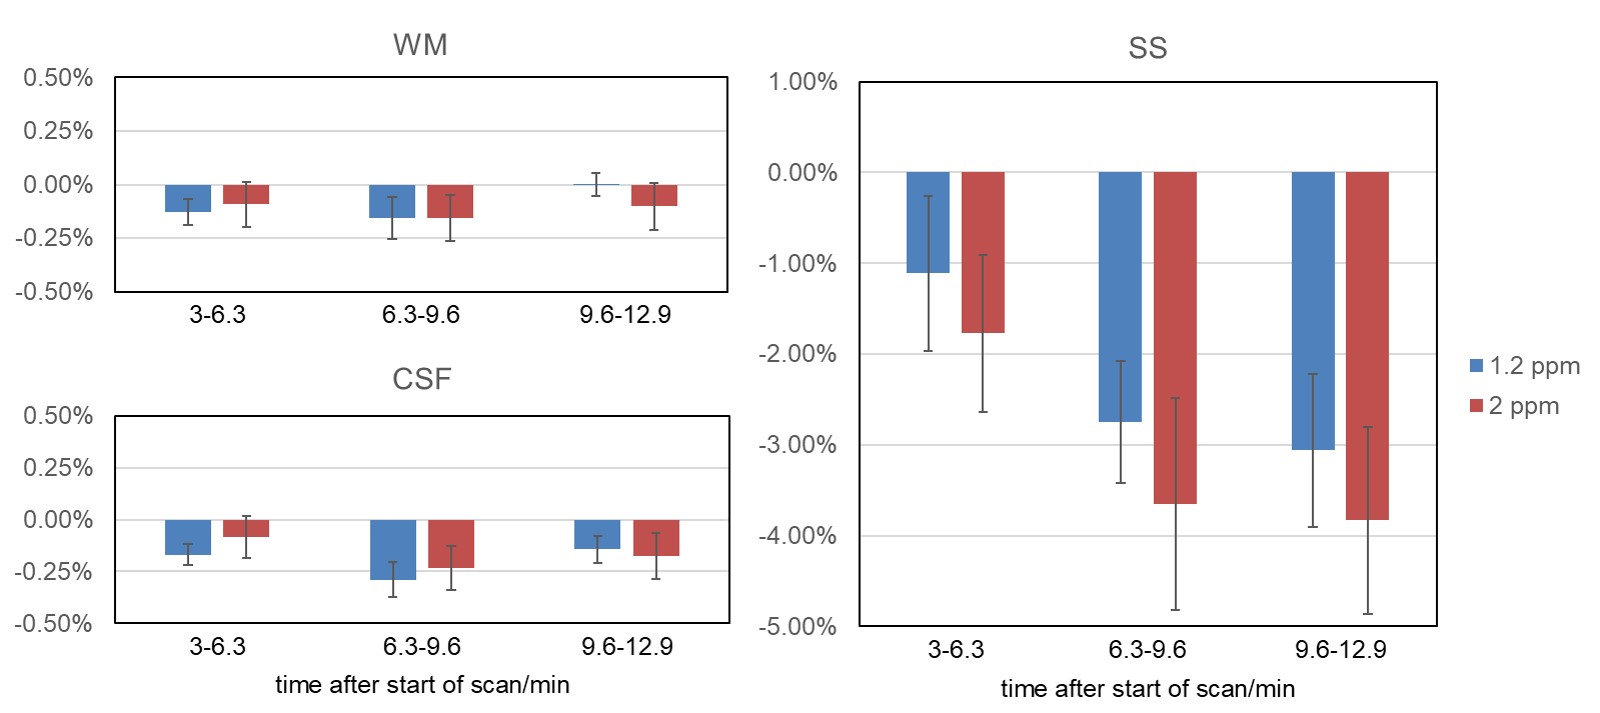
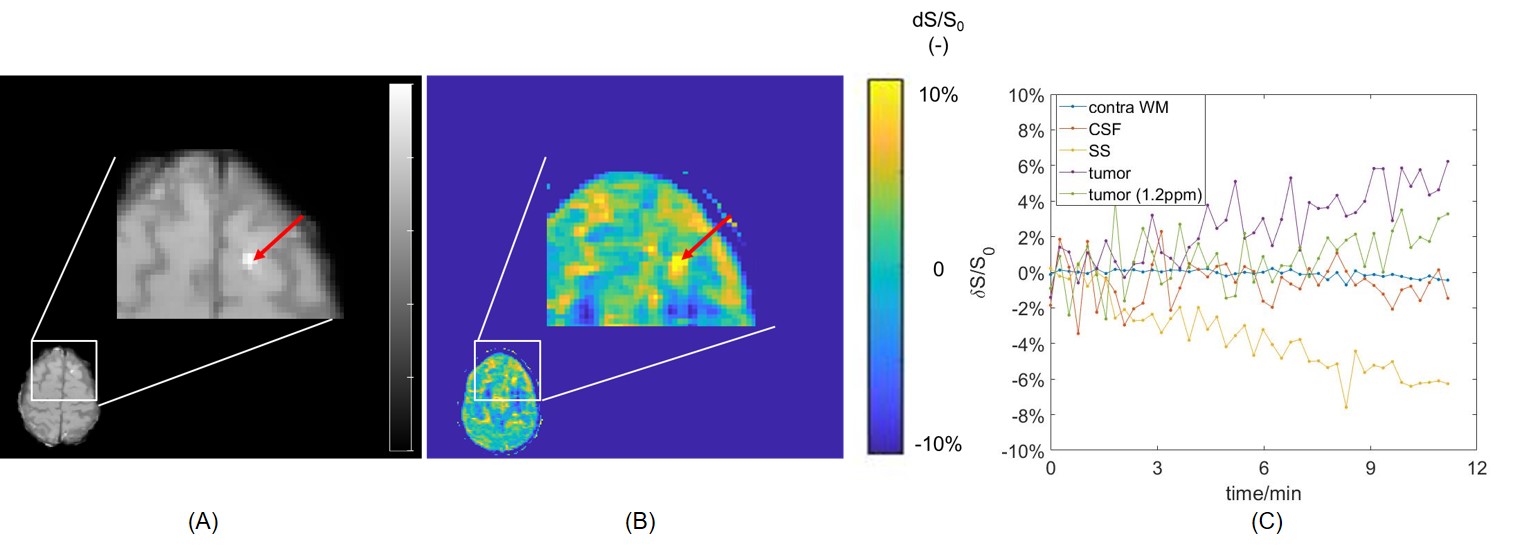
GCE increased with higher glucose concentration in the phantom (Figure 1), with effect sizes of 2%, 7% and 20 % for 2.5, 10 and 40 mM, respectively. In the healthy volunteers, the increase in glucose level in blood was 2-9 mM. Visual inspection of Figure 2 illustrates that the combination of mcflirt and PCA reduced noise due to head motion (orange arrows), and dynamic B0 correction recovered GCE in the frontal lobe (red arrows) in line with previous work.7 Although group average values in GCE showed limited significant difference when calculating for 1.2 ppm or 2 ppm, there is a trend for higher absolute values for GCE calculated at 2 ppm in healthy tissue (Figure 3) and in tumor (Figure 4). In the brain metastasis located in the left frontal lobe, the detected GCE (2ppm) in tumor region was in correspond to hyper-intensity in T1 post contrast image and was higher than in healthy tissues (2ppm), reaching a difference of approximately ~5% on average during the last 3.3 minutes of dynamic scan. (Figure 4)Discussion
Despite good sensitivity for GCE in phantom, the negative GCE in the SS in healthy volunteers indicates that other effects such as stronger MT, direct saturation (DS) in human brain complicate the comparison between phantom and in vivo data. GCE at 1.2 ppm was assumed to include more glucose effect, however more influenced by DS and B0 inhomogeneity. 3,9 Our result of finding a trend towards increased GCE at 2 ppm in vivo, in particular at later times, may be reflective of this.It was an early experience to apply PCA in DGE CEST in brain imaging at 3T, following applying PCA on amide proton transfer weighted CEST to detect glioma3. In the end we used the first 3 principle components (PC) assuming that the first 3 PCs within the S/S0 time course capture the majority of signal changes induced by the glucose infusion. Further investigation of each PC can help in extending the current pipeline.
For the increased signal in the tumor ROI compared to the contralateral WM, it is likely that this was a sign of glucose leakage through a damaged blood-brain barrier (BBB) into the extravascular, extracellular space7. Despite the small tumor ROI, this works illustrated the potential to detect brain metastases with DGE at 3T. In the future, we will scan more patients to further develop DGE CEST including comparison to FDG-PET in detecting brain metastases in patients.
Acknowledgements
This research was supported by the Erasmus MC (AvdV, Daniel den Hoed award 2018) and the British Brain Tumour Charity (GN-000540). We would like to thank all study participants for taking part.
References
1. Xu X, Yadav NN, Knutsson L, et al. Dynamic Glucose-Enhanced (DGE) MRI: Translation to Human Scanning and First Results in Glioma Patients. Tomography. 2015;1(2):105-114.
2. Walker-Samuel S, Ramasawmy R, Torrealdea F, et al. In vivo imaging of glucose uptake and metabolism in tumors. Nat Med. 2013 Aug;19(8):1067-72.
3. Xu X, Sehgal AA, Yadav NN, et al. d-glucose weighted chemical exchange saturation transfer (glucoCEST)-based dynamic glucose enhanced (DGE) MRI at 3T: early experience in healthy volunteers and brain tumor patients. Magn Reson Med. 2020;84(1):247-262.
4. Deshmane A, Zaiss M, Lindig T, et al. 3D gradient echo snapshot CEST MRI with low power saturation for human studies at 3T. Magn Reson Med. 2019;81(4):2412-2423.
5. Jenkinson, M., Bannister, P., Brady, J. M., et al. Improved Optimisation for the Robust and Accurate Linear Registration and Motion Correction of Brain Images. NeuroImage, 17(2), 825-841, 2002.
6. Windschuh J, Zaiss M, Ehses P, et al. Assessment of frequency drift on CEST MRI and dynamic correction: application to gagCEST at 7 T. Magn Reson Med. 2019;81(1):573-582.
7. Herz K, Lindig T, Deshmane A, et al. T1ρ-based dynamic glucose-enhanced (DGEρ) MRI at 3 T: method development and early clinical experience in the human brain. Magn Reson Med. 2019;82(5):1832-1847.
8. Chan, K.W.Y., McMahon, M.T., Kato, Y., et al. Natural D-glucose as a biodegradable MRI contrast agent for detecting cancer. Magn Reson Med, 2012;68: 1764-1773.
9. Seidemo, A, Lehmann, PM, Rydhög, A, et al. Towards robust glucose chemical exchange saturation transfer imaging in humans at 3 T: Arterial input function measurements and the effects of infusion time. NMR in Biomedicine. 2021;e4624. doi:10.1002/nbm.4624
Figures
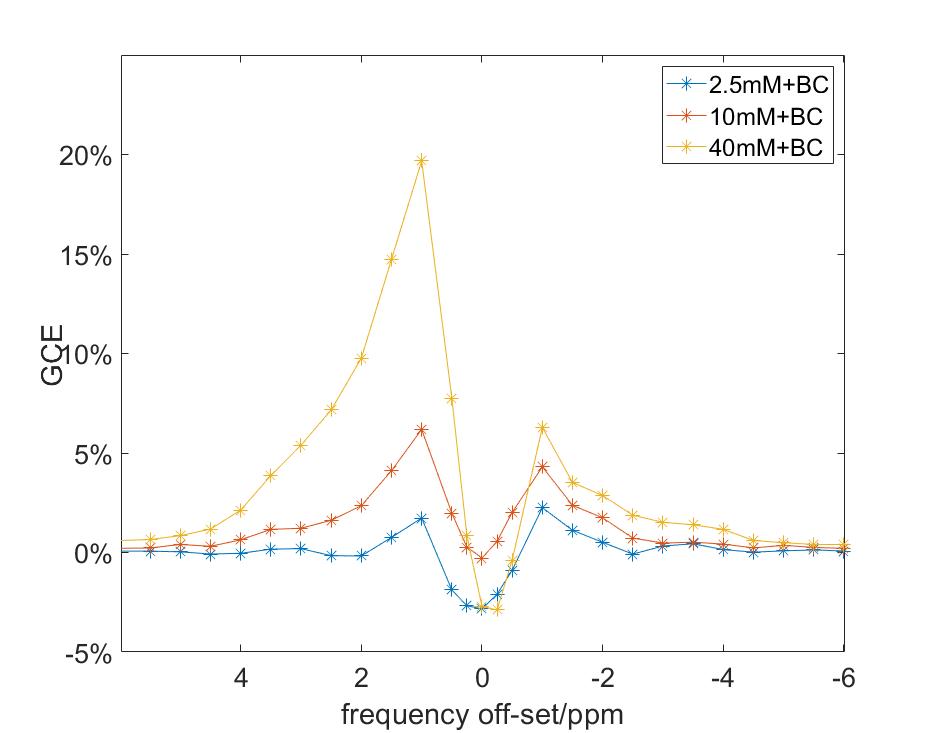
Figure 1 The sensitivity of GCE detection for different concentrations of glucose. Here “10BC” resembled glucose enhancement in human blood vessels, and “2.5BC” in human brain tissue estimated in Xu et al3.