2804
Comparison study between APT-weighted and relaxation-compensated CEST-MRI in human glioma at 3T1Division of Medical Physics in Radiology, German Cancer Research Center (DKFZ), Heidelberg, Germany, 2Faculty of Physics and Astronomy, University of Heidelberg, Heidelberg, Germany, 3Division of Radiology, German Cancer Research Center (DKFZ), Heidelberg, Germany, 4Faculty of Medicine, University of Heidelberg, Heidelberg, Germany, 5Division of Neuroradiology, University Hospital Bonn, Bonn, Germany
Synopsis
Although the underlying mechanisms of APT-weighted (APTw) CEST-MRI are not completely understood, it has been shown to provide valuable information for brain tumor imaging at 3T. To gather more information about the mechanisms, the APTw signal was correlated to relaxation-compensated CEST contrasts in 21 postoperative human glioma patients. A correlation, although being only moderate, was found for the relaxation-compensated APT contrast in the contrast enhancing (CE) tumor region, but not for other tissues, nor rNOE or MT contrast. Differentiation of the CE tumor and normal appearing white matter was strongly dependent on the selective relaxation-compensated CEST evaluation method.
Introduction
APT-weighted (APTw) chemical exchange saturation transfer (CEST) MRI has already been shown to provide valuable information for brain tumor diagnosis at 3T1,2. Although it is the most studied CEST contrast, it is still not completely understood due to its many influences, especially contributions from relayed nuclear Overhauser effect (rNOE), semisolid magnetization transfer (MT), and the spillover effect. In contrast, the relaxation-compensated inverse metric combined with a selective signal extraction method provides the possibility to separate the signals and evade the spillover effect3. This study aimed at correlating the APTw signal and selective relaxation-compensated CEST-MRI in 21 postoperative glioblastoma patients to provide a better understanding of the underlying mechanisms and work out similarities and discrepancies of the contrasts.Methods
In this study 21 patients with newly diagnosed (16) or relapsing (5) malignant glioblastoma were examined after tumor resection or biopsy and prior to radio-chemotherapy. For each patient a normal appearing white matter (NAWM), a contrast enhancement (CE), and a whole tumor (WT) (edema and CE) region of interest (ROI) were selected by a radiologist.All examinations were performed on a 3T whole-body scanner (Siemens Prisma). The APTw imaging is based on the asymmetry approach $$$MTR_{asym}=Z_{ref}-Z$$$ at ±3.5ppm and was performed with the established acquisition protocol of Zhou J. et al.9 with four rectangular RF pulses and a B1 of 2μT.
The acquisition protocol for relaxation-compensated CEST4 comprised 2 CEST scans (1.7x1.7x3mm3, 128x104x12) with a B1 of 0.6μT and 0.9μT, respectively. Additionally, one WASABI5 scan for mapping of B0 and B1 inhomogeneities was acquired. The post-processing of the relaxation-compensated CEST data includes (i) an image registration, (ii) a correction for B0 inhomogeneities, (iii) denoising6, and (iv) a correction for B1 inhomogeneities (reconstructed B1=0.7µT)7 ((i) and (ii) for APTw).
Two different approaches for relaxation-compensated CEST-MRI were investigated. First, after performing a multi-pool Lorentzian-fit analysis to isolate the APT, rNOE, and MT signals the relaxation-compensated MTRRex6 signal was calculated according to:$$MTR_{Rex}(\Delta\omega)=\frac{1}{Z(\Delta\omega)}-\frac{1}{Z_{ref}(\Delta\omega)}$$ The second approach was the longitudinal relaxation rate R adapted from Huang et al.8, based on the assumption that the MTC background can be described as a linear function between -13ppm and -3.5ppm. Here, the RAPT (+3.5ppm) and RrNOE (-3.5ppm) can be calculated with only three data points:$$R_{APT;rNOE}=\frac{1}{Z(\pm3.5ppm)}+\frac{1}{Z(-13ppm)}-\frac{2}{Z(-7.5ppm)}$$
Results
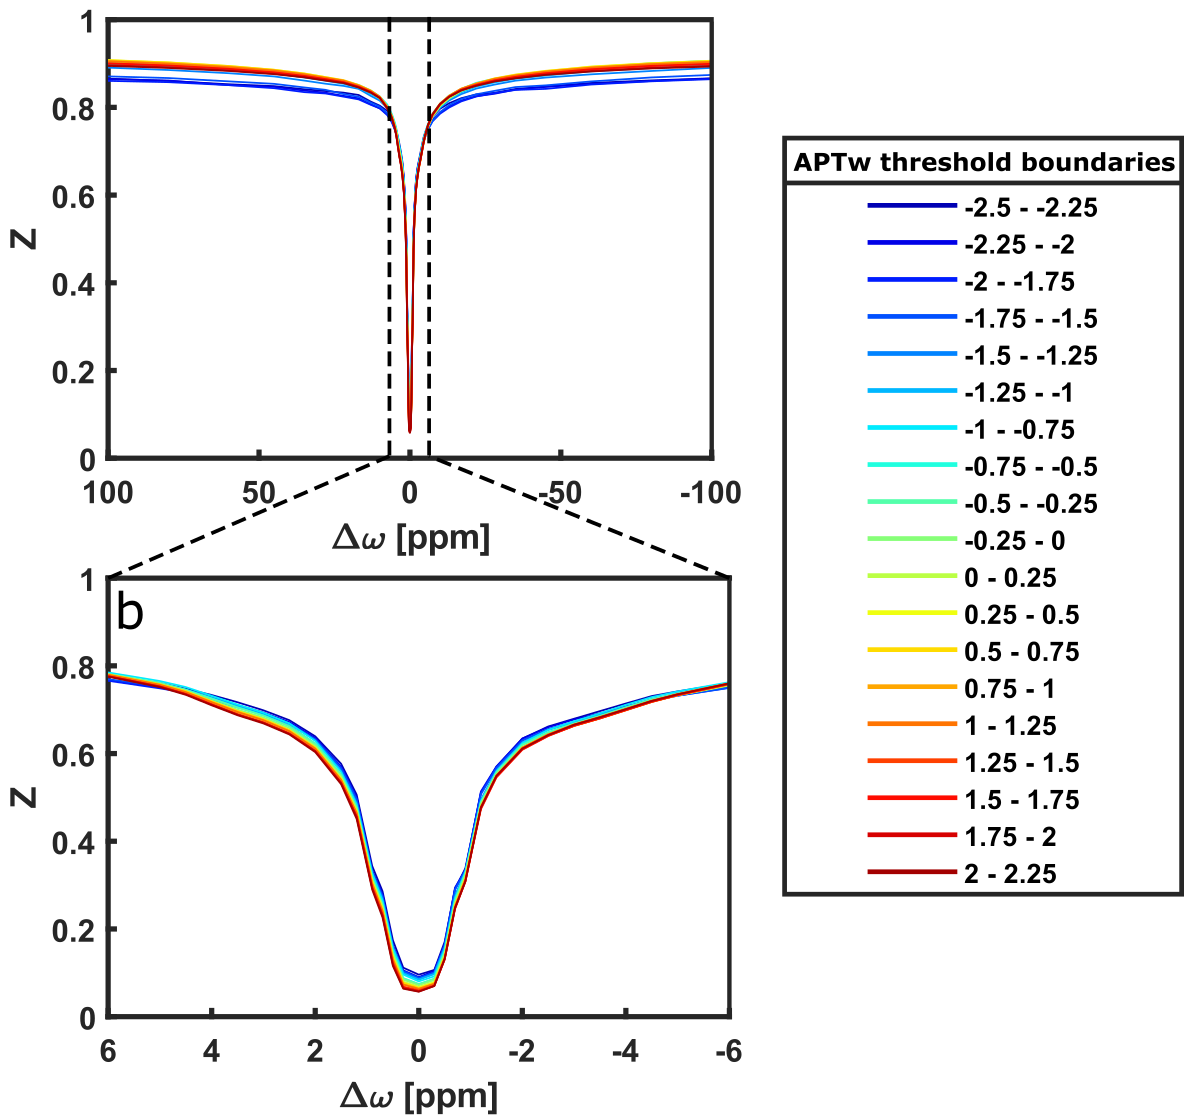
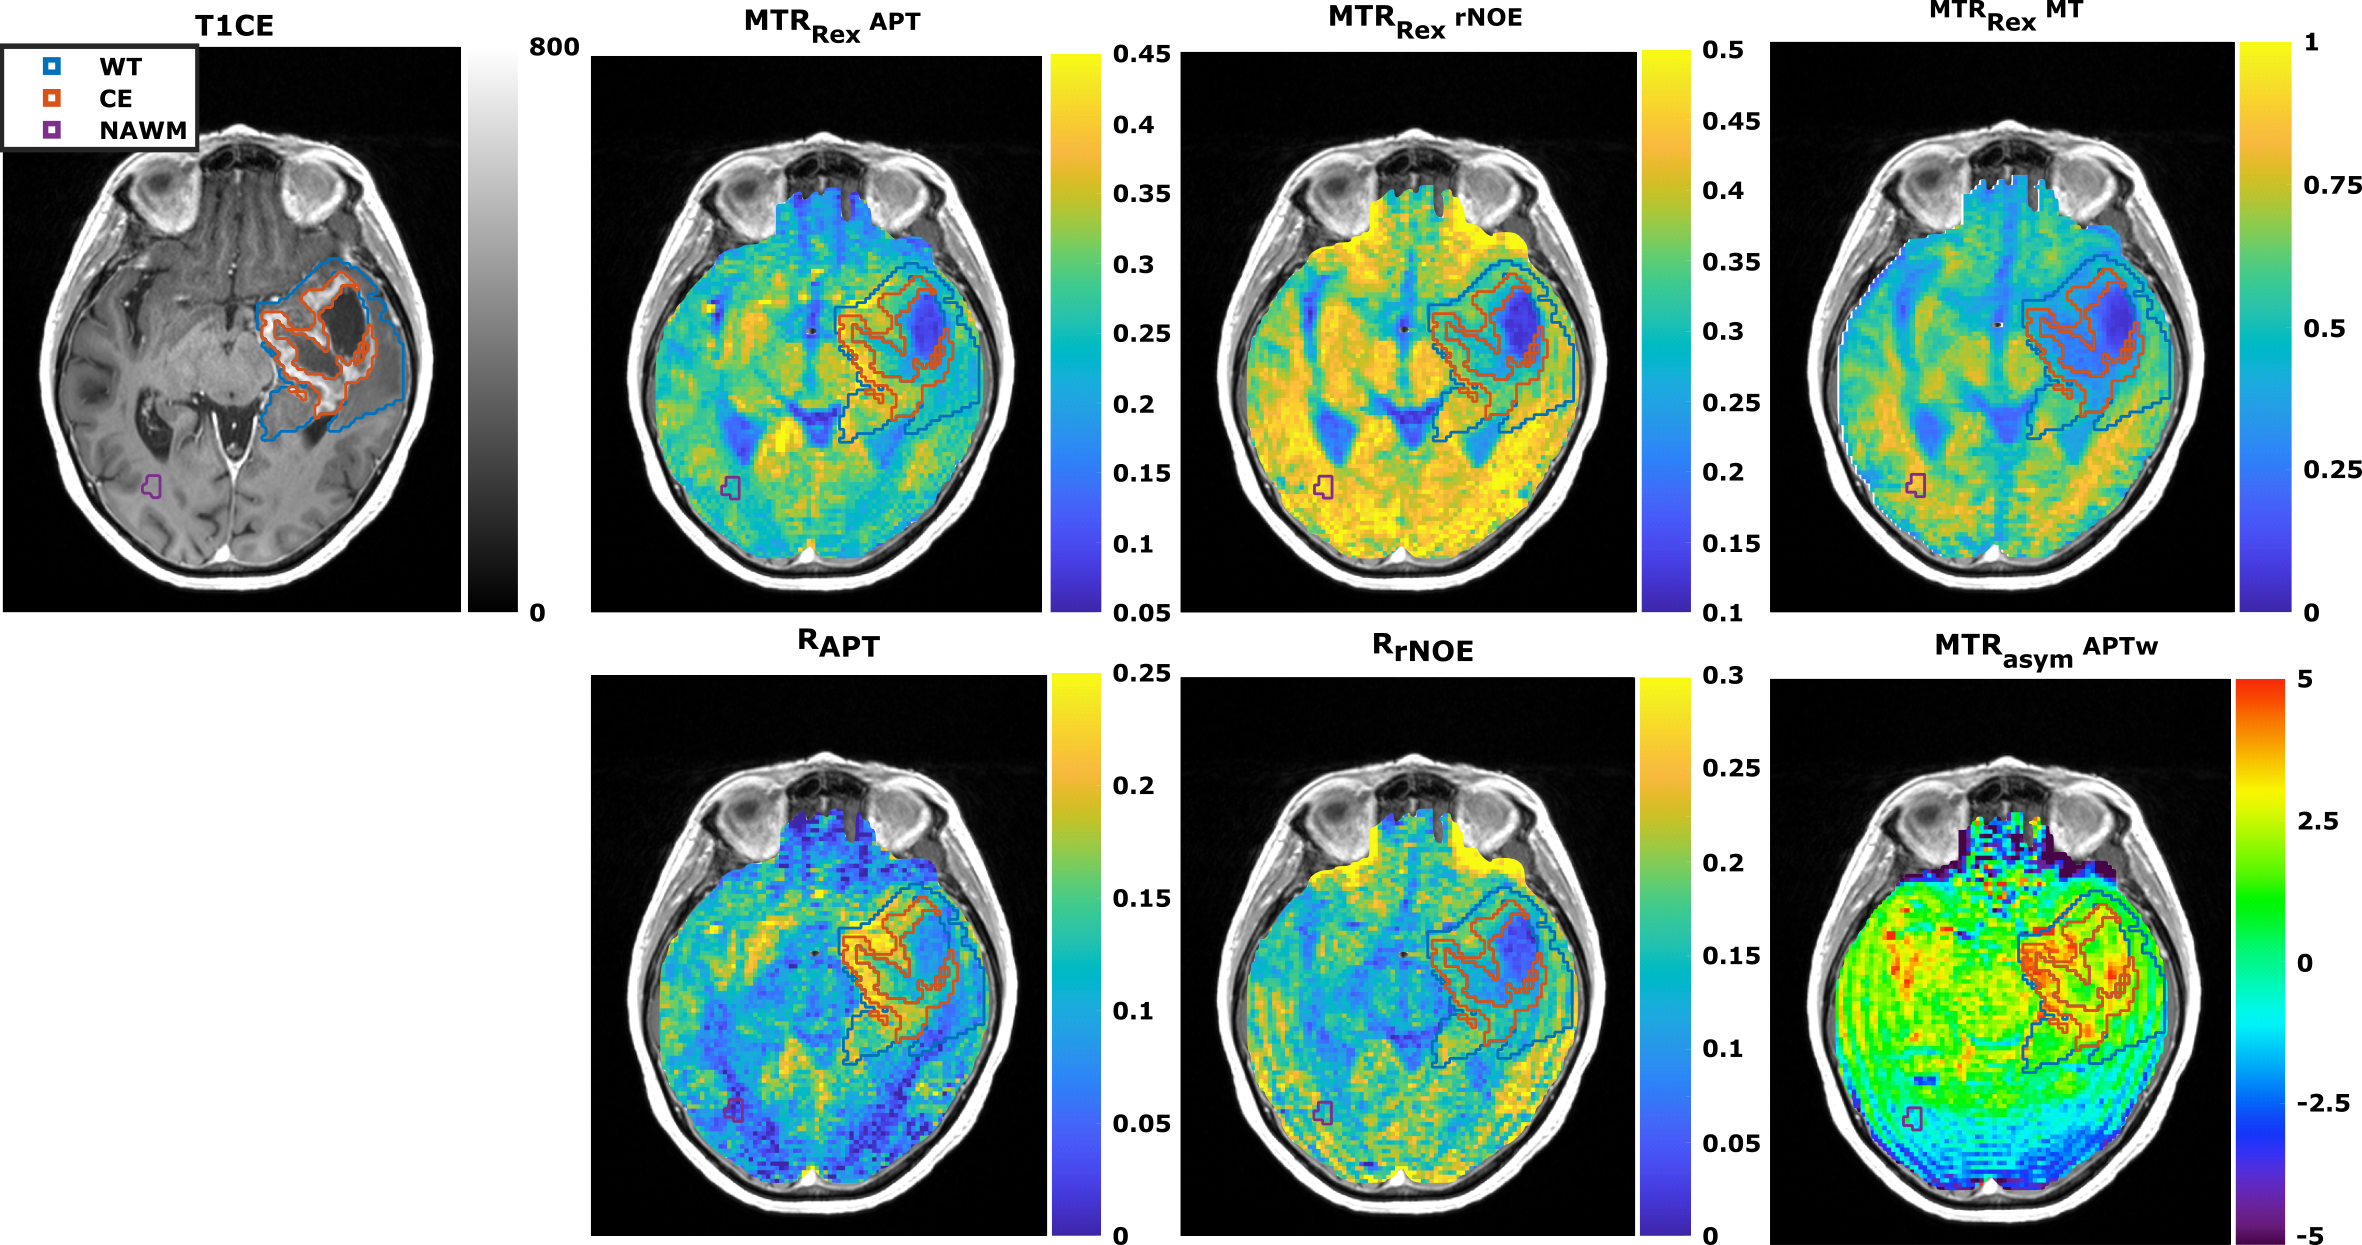
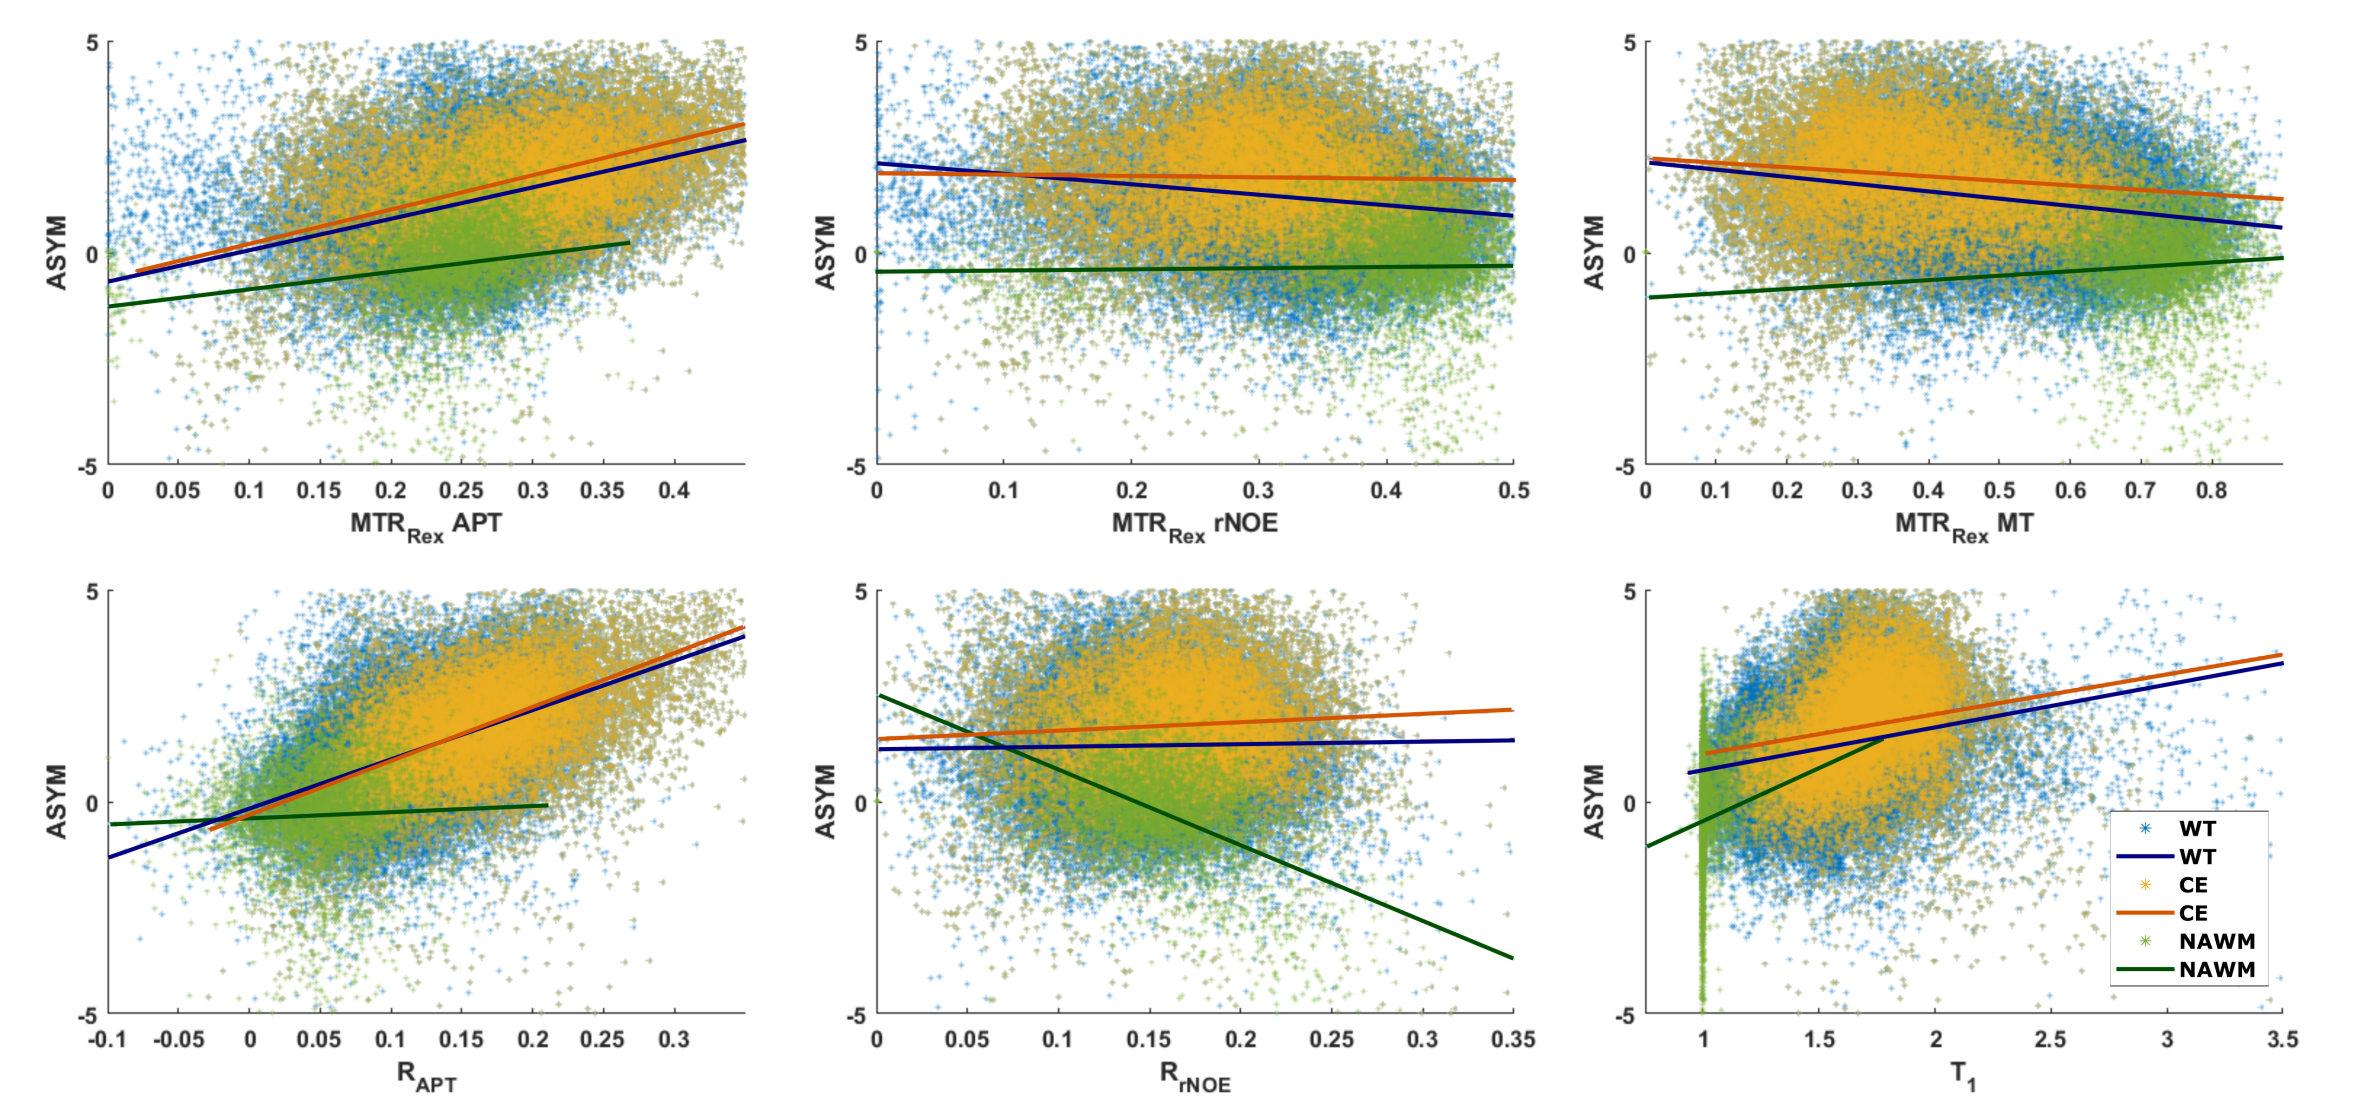
Comparison of low-power Z-spectra (0.7μT) at different APTw signal strengths within the CE revealed a correlation in the spectral region of chemically exchanging protons between 1 and 4 ppm (Figure 1b). In contrast, there was only a minor dependency in the rNOE region around -3.5 ppm (Figure 1b), none for the MT, and a T1 dependency for APTw signals lower than -1.5% (Figure 1a).In Figure 2 a representative patient with a hyperintense MTRRex APT and RAPT in the CE and parts of the edema was observed, which matches well with the APTw contrast. In contrast, the MTRRex rNOE and MT were hypointense in the tumor region. The coherent trends of the APTw signal and relaxation-compensated APT were verified in an correlation analysis of the entire patient cohort (Figure 3). In the CE, the MTRRex APT (R=0.47; p<0.001) showed a moderate correlation with the APTw signal. The RAPT showed the same trend for CE (R=0.55; p<0.001) and WT (R=0.51; p<0.001). Otherwise, there were no significant correlations between the contrasts in any other tissue, nor rNOE, MT or T1.
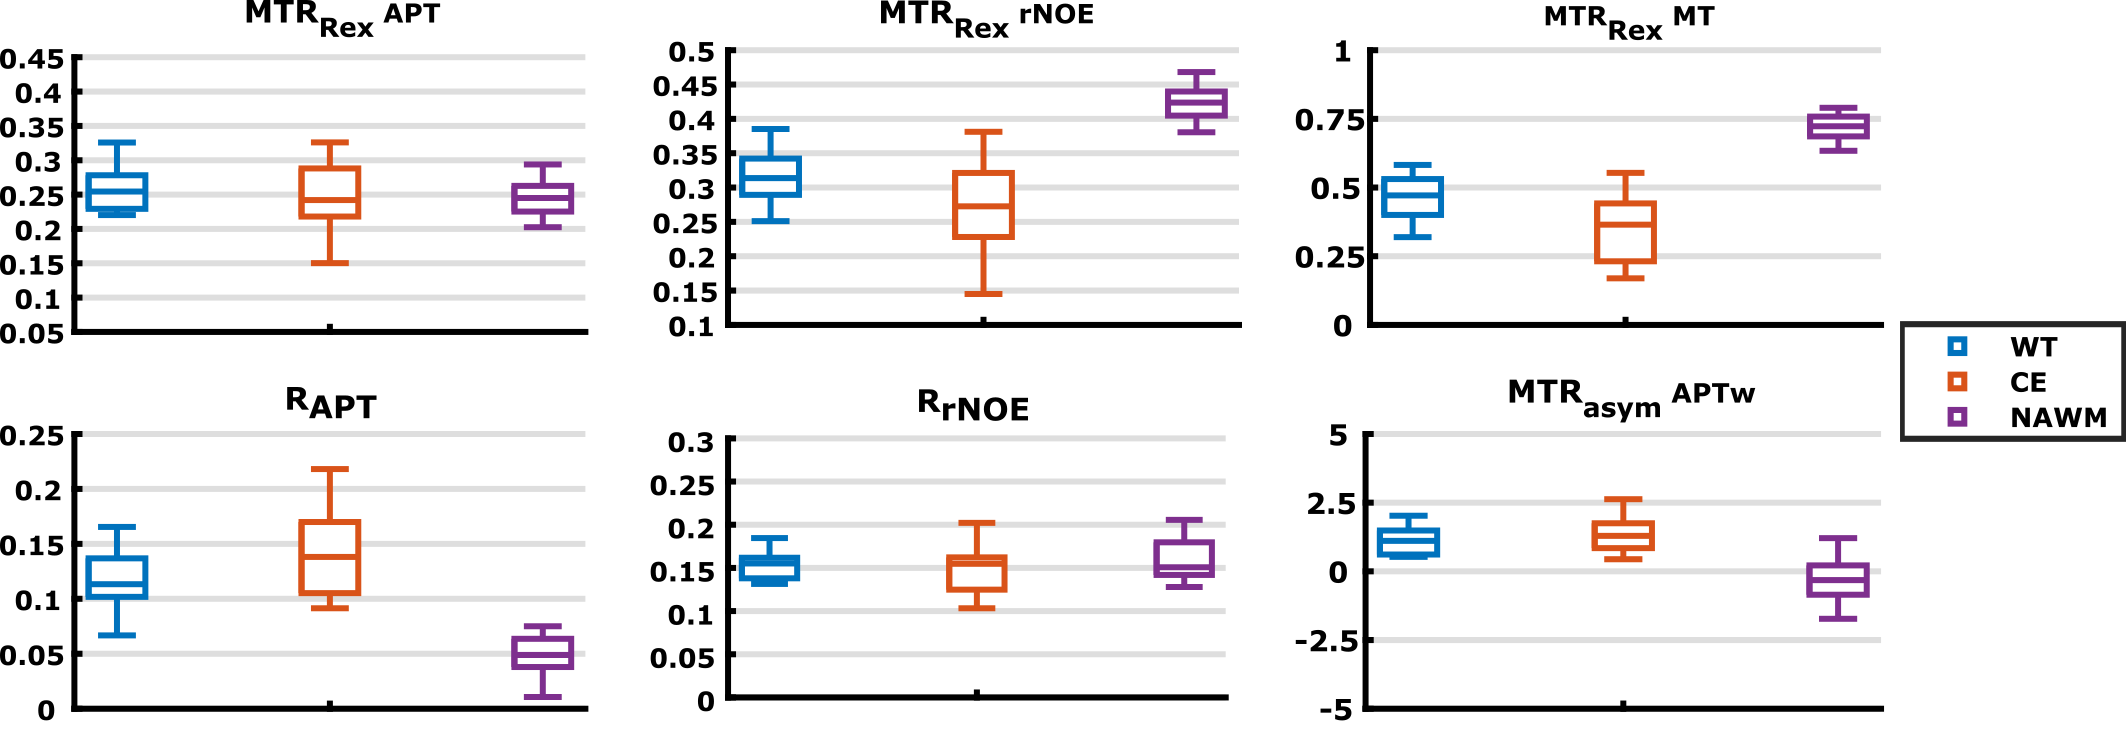
Although the MTRRex APT correlated with the APTw signal within the CE, there are no similarities in contrast behavior (Figure 4) when comparing the patients, mean signal value in the CE and WT to NAWM. The RAPT, on the other hand, has a similar contrast behavior to the APTw (Figure 4) with an increased CE and WT signal in comparison to NAWM. In contrast, the MTRRex rNOE and MT, as expected, showed a lower signal in CE and WT. Finally, the MTRRex APT and RrNOE did not show any significant differences.
Discussion
This work demonstrates that APTw imaging correlates with the relaxation-compensated APT contrast in the CE region and, thus, that the APT signal seems to be the dominating signal contribution in this region. Interestingly, the RAPT signal showed an increased contrast in the CE and WT region as does the APTw signal. However, the Lorentzian fit-based contrasts could not depict the same increase of the mean signal inside the CE region. This was also the case for an alternative fit model published by Mehrabian et al.2 (data not shown). Thus, the relaxation-compensated approaches yielded different results even though they are both based on the inverse metric and visual correlations are apparent. Furthermore, a hypointense rNOE and MT contrast can be observed in the tumor region of the glioblastoma patients, as expected from the literature4.Conclusion
This study is an important step towards gathering more information about the underlying mechanisms that make up the frequently used APTw contrast and showed that the relaxation-compensated APT contrasts are a moderate representative of the APTw signal in the CE of glioma patients. In addition, an increased contrast in the CE region compared to the NAWM was found for the RAPT metric, in coherence with studies at 7T and making this contrast interesting for future relaxation-compensated CEST-MRI studies at 3T.Acknowledgements
We gratefully thank the German Research Foundation (DFG project number: 445704496) for the financial support. Additionally, we thank the medical-technical radiology assistants from the DKFZ for their help in conducting the examinations.References
1. Zhou j. et al. Differentiation between glioma and radiation necrosis using molecular magnetic resonance imaging of endogenous proteins and peptides. Nat Med. 2011;17:130-134
2.Mehrabian H. et al. Differentiation between radiation necrosis and tumor progression using chemical exchange saturation transfer. Clin Cancer Res. 2017;23:3667-3675
3.Zaiss M, et al. Inverse Z‐spectrum analysis for spillover‐, MT‐, and T1‐corrected steady‐state pulsed CEST‐MRI application to pH‐weighted MRI of acute stroke. NMR Biomed. 2014;27:240-252
4.Goerke S, et al. Relaxation-compensated APT and rNOE CEST-MRI of human brain tumors at 3 T. Magn Reson Med. 2019;82:622-632
5.Schuenke P, et al. Simultaneous mapping of water shift and B1 (WASABI)—application to field‐inhomogeneity correction of CEST MRI data. Magn Reson Med. 2017;77:571-580
6.Breitling J, et al. Adaptive denoising for chemical exchange saturation transfer MR imaging. NMR Biomed. 2019;32:e4133
7.Windschuh J, et al. Correction of B1-inhomogeneities for relaxation-compensated CEST imaging at 7 T. NMR Biomed. 2015;28:529-537
8.Huang J, et al. Relayed nuclear Overhauser enhancement imaging with magnetization transfer contrast suppression at 3 T. Magn Reson Med. 2020;00:1–14
9.Zhu H, et al. A Fast 3D chemical exchange saturation transfer (CEST) imaging of the human brain. Magn Reson Med. 2010;64:638-644
Figures