2803
Presaturation pulse shape enables shifting the pH sensitivity of guanidyl CEST-MRI for absolute pH mapping at 9.4 T1Division of Medical Physics in Radiology, German Cancer Research Center (DKFZ), Heidelberg, Germany, 2Faculty of Physics and Astronomy, University of Heidelberg, Heidelberg, Germany, 3Faculty of Medicine, University of Heidelberg, Heidelberg, Germany
Synopsis
In this study, we present a method for absolute pH mapping using the guanidyl CEST signal. The method is an extension of a previous approach that allowed compensating for various concomitant effects other than pH, but additionally required measuring the amide signal. By optimizing the pulse shape of the pulsed presaturation the pH sensitivity of the guanidyl signal could now be shifted to the physiologically relevant range around pH 7.1. The shift of sensitivity was verified experimentally in a multi-pH creatine phantom at 9.4T. Thus, CEST-based pH mapping with exceptional specificity is now also possible using only the guanidyl signal.
Introduction
Intracellular pH (pHi) is a valuable biomarker for assessment of cancer, as pHi is known to be increased in tumors.1 Recently we demonstrated, that non-invasive mapping of pHi in tumors is feasible by a combination of the amide (Δω=3.5ppm) and guanidyl (Δω=2.0ppm) CEST signal at 9.4T.2 In this method, concomitant effects, such as concentration changes and spillover dilution, were compensated using a ratiometric approach3–5 in combination with the relaxation-compensated inverse metric MTRRex.6–8However, with this approach, stable pH mapping in the physiological range of pH 7 to 7.5 was only feasible using a combination of the amide and guanidyl signal. Therefore, the aim of this study was to further develop the method, so that only the guanidyl signal is needed for reliable pH mapping. This was achieved by using a pulsed presaturation introducing a new parameter – the pulse shape – which enables shifting the pH sensitivity of the guanidyl signal to the physiological pH range. As a model system for the guanidyl signal, creatine model solutions were used. Using only the guanidyl signal makes the entire method more robust and, moreover, the pulsed presaturation enables the translation of the method to whole-body MR scanners and, thus, prospective application in humans.
Methods
The previous method for absolute pH mapping2 is based on the assumption of a base-catalyzed exchange rate$$$~k_{ex}(pH)=k_{c}\cdot{10^{pH}}$$$, with the exchange rate characterizing constant kc. Thus, pH mapping is possible via$$$~pH=log_{10}\big(\frac{k_{ex}}{k_{c}}\big)~$$$by measuring kex and calibration of kc. For a pulsed presaturation with Gaussian-shaped pulses, MTRRex is:9$$MTR_{Rex}^{pulsed}=\frac{1}{Z_{lab}}-\frac{1}{Z_{ref}}=DC\cdot{c_{1}}\cdot{\frac{f_{s}k_{ex}}{R_{1w}}}\cdot{\frac{(\gamma{B_{1}^{2}})}{(\gamma{B_{1}^{2}})+k_{ex}(k_{ex}+R_{2s})\cdot{c_{2}^{2}}}}\quad\quad\quad\quad[Eq~1]$$ with the transversal relaxation rate R2s of the CEST pool, the duty cycle DC, and the form factors c1 and c2 representing the shape of the pulses. For continuous-wave (cw) presaturation, DC=c1=c2=1. In this study, c2 was calculated10 via$$$~c_{2}=\frac{(\int_{0}^{t_{p}}B_{1}(t)dt)^{2}}{t_{p}\int_{0}^{t_{p}}B_{1}^{2}(t)dt}~$$$and MTRRex of the creatine guanidyl signal via Zlab=Z(2ppm) and Zref=Z(-2ppm).
Application of a ratiometric approach at two different B1$$$~CEST_{ratio}^{pulsed}=\frac{MTR_{Rex}^{pulsed}(B_{1,high})}{MTR_{Rex}^{pulsed}(B_{1,low})}~$$$and using R2s=100Hz enables measurement of kex.2 Importantly, from this theory the parameter c2 (i.e. the pulse shape) enables shifting the pH sensitivity of the CESTratio to higher pH. To translate the measured kex to pH, kc needs to be calibrated. The calibration of kc is determined experimentally by finding the maximum of MTRRex(pH) (Eq1), which is a symmetric function around position$$$~pH_{max}=log_{10}\big(\frac{\gamma{B_{1}}}{k_{c}c_{2}}\big)$$$, enabling a stable fitting procedure.11
Creatine model solutions at different pH (6.0 to 8.2) were investigated. All measurements were performed on a 9.4T small-animal MR scanner (Bruker BioSpec) and stabilized at 37.0±0.1°C. For CEST-MRI a custom-built 2D FISP image readout (0.5×0.5x2mm3) with cw or pulsed (c2 between 0.36 and 0.70) presaturation with mean B1=0.6,1.0,1.4µT of duration 12s (DC=1) was applied. Data were corrected for B0 and B1 inhomogeneities12 using a WASABI scan13.
Results and Discussion
No relevant broadening of the guanidyl peak was observed for Z-spectra as a function of c2 (Figure 1B). Therefore, c2 introduces a new possibility of shifting the pH sensitivity to higher pH without interfering peak broadening. In contrast, shifting the pH sensitivity by increasing B1,high is impracticable for in vivo applications due to excessive peak broadening and the impeded reliable extraction of the guanidyl signal from other superimposing signals in the in vivo Z-spectrum.The pH dependency of MTRRex(pH) showed the expected symmetric shape in coherence with theory (Eq1, Figure 2). For pulsed presaturations, a shift towards higher pH was observed for decreasing c2 (i.e. sharper pulses, Figure 1C). Experimental determination of pHmax enabled calculating a mean kc(c2) of 89±3µHz (Figure 3A) corresponding to kex=1120Hz at pH 7.1, in good agreement with literature.14,15 A slight trend was observed for kc(c2), which, though, was smaller than the B1 dispersion of kc for each c2 (errors in Figure 3A). Accordingly, for each c2 the corresponding kc was used for calculation of pH. In addition, the CESTratio(c2) showed a shift towards higher pH (Figure 3B), thus verifying the ability to shift the pH sensitivity (i.e. the position of the steepest slope of CESTratio(pH)) by tuning the pulse shape. Importantly, the range of highest pH sensitivity could be shifted up to the physiologically relevant range of pH 7 to 7.5 using c2=0.42.
With the optimal c2 in hand, pH maps were calculated for cw and c2=0.42 (Figure 4A,B). An excellent correlation of titrated pH (pHtitrated) and pH measured by CEST-MRI (pHCEST) was observed for cw and pulsed presaturation in the pH range of 6.5–7.5 (cw: r=0.9922,p<0.001 and c2=0.42: r=0.9953,p<0.001) (Figure 4C,D). In contrast to cw, the significantly smaller fluctuations in pH values (std in Figure 4C,D) for the optimized pulses demonstrate the improved pH sensitivity above pH 7 (Figure 4E).
Conclusion
In this study, the pulse shape of the presaturation was identified as a new parameter to shift the pH sensitivity of the guanidyl signal to the physiological pH range. Applicability of the presented method was demonstrated in creatine model solutions at 9.4T, showing reliable calculation of guanidyl-based pH maps in the range of pH 6.5 to 7.5. Consequently, by eliminating the need for the amide signal, this makes the previous pH mapping method more robust. Moreover, the pulsed presaturation enables the translation of the pH mapping method to whole-body MR scanners and, thus, prospective application in humans.Acknowledgements
We gratefully thank the German Research Foundation (DFG; GO 2172/1-1) for financial support.Conflict of Interest:
The German Cancer Research Center (DKFZ) maintains a research collaboration agreement with Bruker BioSpin MRI GmbH. Bruker did not have any influence on the direction or contents of this manuscript.
The authors declare that they have no competing interests.
References
1. Webb BA, Chimenti M, Jacobson MP, et al. Dysregulated pH: a perfect storm for cancer progression. Nat Rev Cancer. 2011;11:671–677.
2. Boyd PS, Breitling J, Laier S, et al. Mapping of intracellular pH in vivo using amide and guanidyl CEST-MRI at 9.4 T. Proc 29th Annu Meet Int Soc Magn Reson Med.;Poster #1463.
3. Longo DL, Sun PZ, Consolino L, et al. A general MRI-CEST ratiometric approach for pH imaging: demonstration of in vivo pH mapping with iobitridol. J Am Chem Soc. 2014;136:14333–14336.
4. Rerich E, Zaiss M, Korzowski A, et al. Relaxation-compensated CEST-MRI at 7 T for mapping of creatine content and pH – preliminary application in human muscle tissue in vivo. NMR Biomed. 2015;28:1402–1412.
5. Sun PZ, Xiao G, Zhou IY, et al. A method for accurate pH mapping with chemical exchange saturation transfer (CEST) MRI. Contrast Media Mol Imaging. 2016;11:195–202.
6. Zaiss M, Xu J, Goerke S, et al. Inverse Z-spectrum analysis for spillover-, MT-, and T1-corrected steady-state pulsed CEST-MRI – application to pH-weighted MRI of acute stroke. NMR Biomed. 2014;27:240–252.
7. Zaiss M, Bachert P. Chemical exchange saturation transfer (CEST) and MR Z-spectroscopy in vivo: a review of theoretical approaches and methods. Phys Med Biol. 2013;58:R221–R269.
8. Zaiss M, Bachert P. Exchange-dependent relaxation in the rotating frame for slow and intermediate exchange – modeling off-resonant spin-lock and chemical exchange saturation transfer. NMR Biomed. 2013;26:507–518.
9. Meissner J-E, Goerke S, Rerich E, et al. Quantitative pulsed CEST-MRI using Ω-plots. NMR Biomed. 2015;28:1196–1208.
10. Lankford CL, Louie EA, Zu Z, et al. A hybrid numeric-analytic solution for pulsed CEST. NMR Biomed. 2021;e4610.
11. Goerke S, Windschuh J, Zaiss M, et al. Elegant method to quantify Chemical Exchange Processes for pH CEST Imaging. Proc 25th Annu Meet Int Soc Magn Reson Med.;Program# 1979.
12. Windschuh J, Zaiss M, Meissner J-E, et al. Correction of B1-inhomogeneities for relaxation-compensated CEST imaging at 7 T. NMR Biomed. 2015;28:529–537.
13. Schuenke P, Windschuh J, Roeloffs V, et al. Simultaneous Mapping of Water Shift and B1 (WASABI)—Application to Field-Inhomogeneity Correction of CEST MRI Data. Magn Reson Med. 2017;77:571–580.
14. Haris M, Nanga RPR, Singh A, et al. Exchange rates of creatine kinase metabolites: feasibility of imaging creatine by chemical exchange saturation transfer MRI. NMR Biomed. 2012;25:1305–1309.
15. Goerke S, Zaiss M, Bachert P. Characterization of creatine guanidinium proton exchange by water-exchange (WEX) spectroscopy for absolute-pH CEST imaging in vitro. NMR Biomed. 2014;27:507–518.
Figures
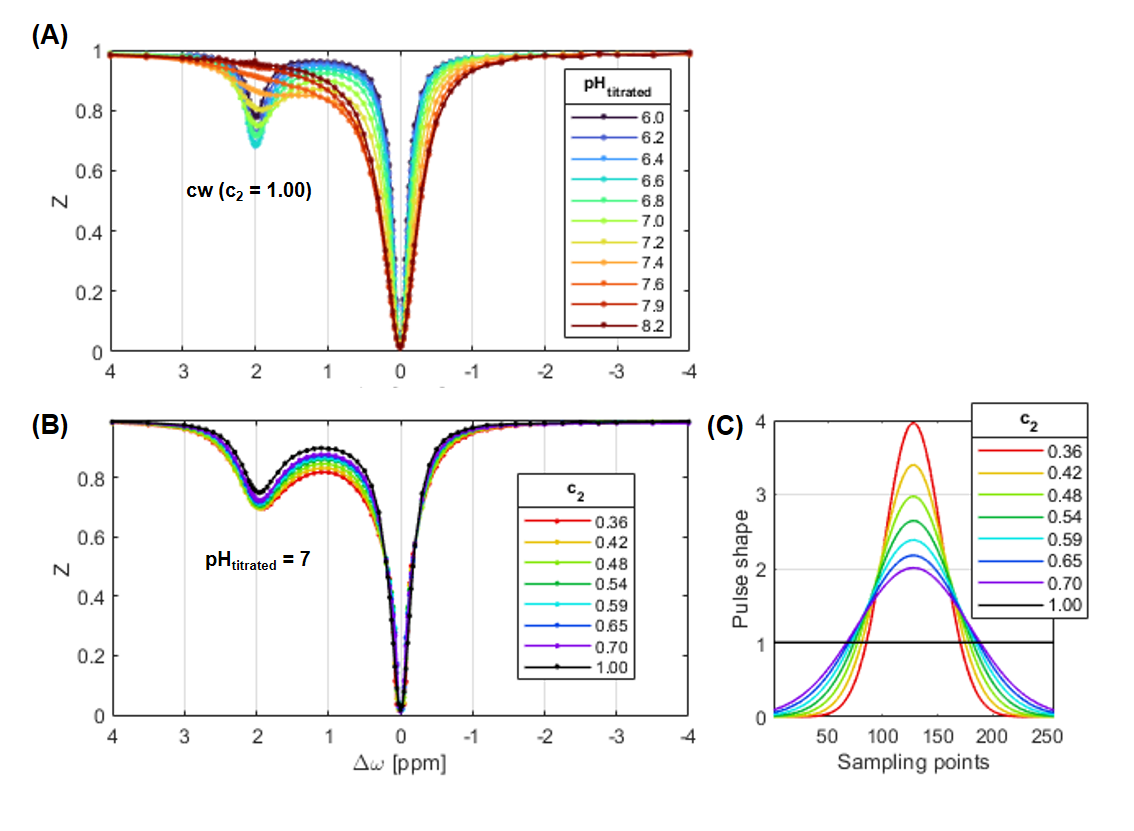
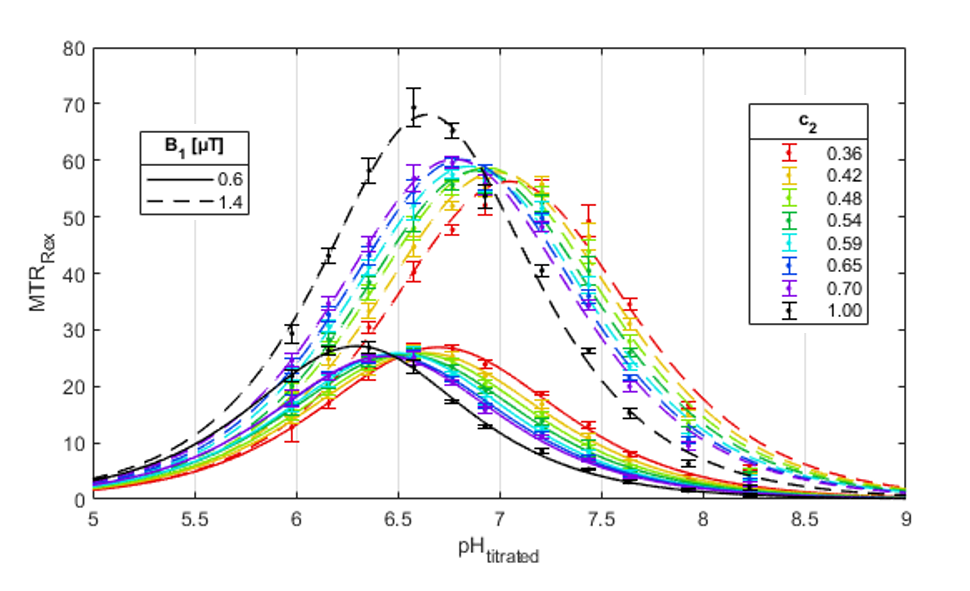
Figure 2: Effect of pulse shape (i.e. c2) on MTRRex of creatine model solutions as a function of pH. The pH dependency of MTRRex showed the expected symmetric shape in coherence with theory (Eq1). Interestingly, the maximum of MTRRex at position pHmax not only shifts towards higher pH for higher B1 (cf. black lines) but also by using a pulsed presaturation (colored lines). The observed shift was increasing for decreasing c2 (i.e. sharper pulses, Figure 1C).

Figure 3: Effect of pulse shape (i.e. c2) on the exchange rate determining constant kc (A) and the CESTratio (B) in creatine model solutions. A: For kc, which is calculated via pHmax (Figure 2), a slight trend was observed with c2. B: The CESTratio (B1,low = 0.6 μT, B1,high = 1.4 μT) as a function of c2 showed a shift towards higher pH values for decreasing c2. Therefore, c2 introduces a new possibility to shift the pH sensitivity (i.e. the slope of the CESTratio(pH)) above a pH of 7 without interfering peak broadening (Figure 1B) that would result from an increased B1.
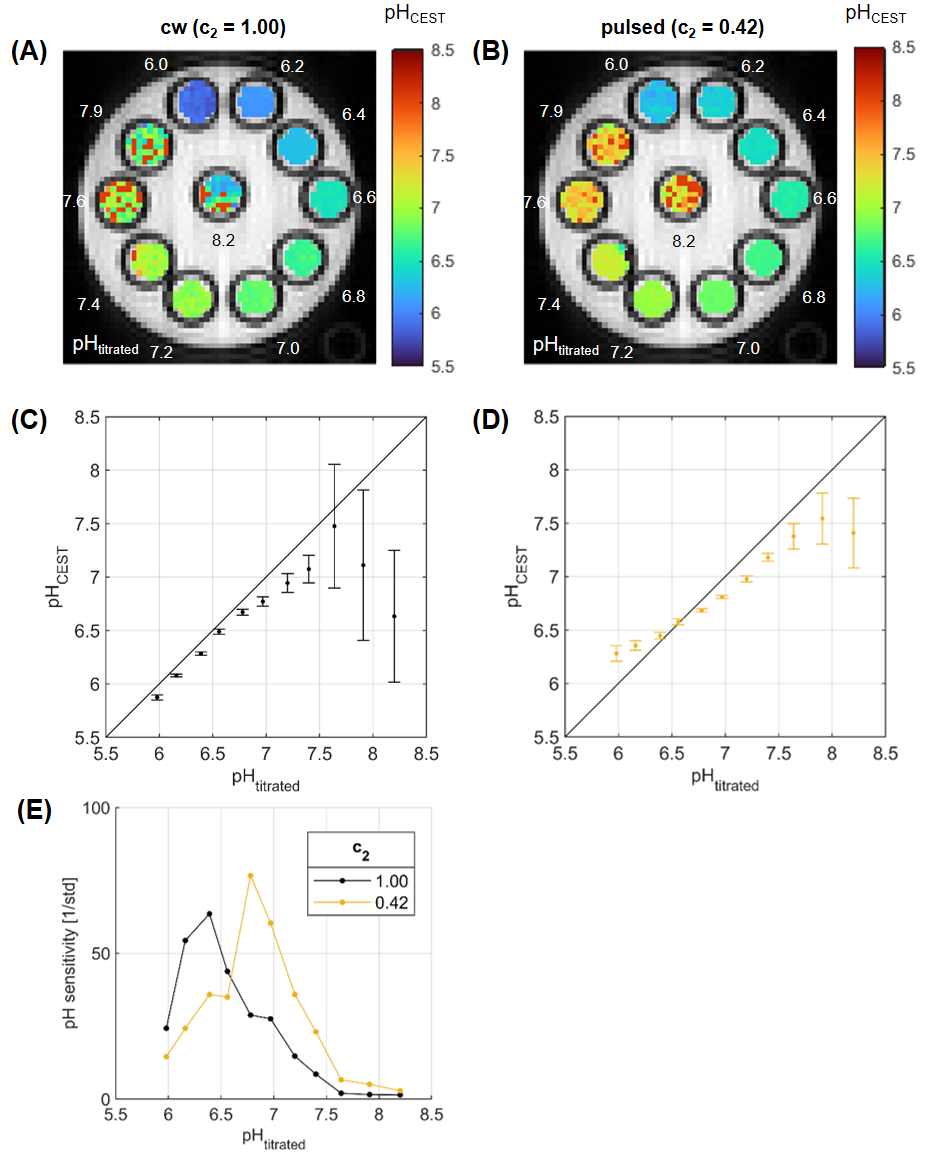
Figure 4: Correlation of titrated pH (pHtitrated) and pH measured by CEST-MRI (pHCEST) for cw (A,C) and c2 = 0.42 (B,D) in creatine model solutions. C,D: A very good correlation was observed for the cw (r = 0.9922) and pulsed case (r = 0.9953) in the pH range of 6.5 to 7.5. However, the pulsed presaturation has significantly smaller fluctuations in pH values (i.e. std) in the range above pH 7. E: Illustration of the improved pH sensitivity in the physiologically relevant range of the optimized pulses compared to cw by means of 1/std of the values shown in C,D.