2802
Improving clinical 3T Amide Proton Transfer weighted contrast in Brain Tumors by using a novel spatial denoising method1Institute of Biostructures and Bioimaging (IBB), National Research Council of Italy (CNR), Torino, Italy, 2Department of Research & Innovation, Olea Medical, La Ciotat, France, 3Lysholm Department of Neuroradiology, University College of London Hospitals NHS Foundation Trust, London, United Kingdom, 4Institute of Neurology UCL, London, United Kingdom, 5Department of Neuroradiology, University Clinic Erlangen, Friedrich-Alexander Universität Erlangen-Nürnberg (FAU), Erlangen, Germany
Synopsis
Amide Proton Transfer weighted (APTw) imaging is a promising MR molecular technique for characterizing brain tumors on clinical 3T scanners. However, improving the APT weighted contrast is crucial to translate this approach to clinical practice. In this work we investigated a novel spatial denoising filter in synthetic and clinical APTw data of brain tumor patients.
Introduction
Amide Proton Transfer weighted (APTw) imaging is an emerging Chemical Exchange Saturation Transfer (CEST)-MRI technique that can provide molecular information (from mobile peptides and proteins) potentially useful in the context of multiparametric MRI for brain tumor characterization1. At clinical fields the quality of CEST-MRI images remains a challenge due to low Signal-to-Noise Ratio (SNR). Therefore, denoising methods are very helpful as preprocessing step to reduce noise and improve image contrast, hence diagnostic assessments. In this study we propose a novel denoising method for APTw imaging named “Nonlocal Mean Coherence Enhancing Diffusion” (NLmCED) filter that is a combination between the original method of Non Local Mean (NLM) and Anisotropic Diffusion (AD)2 and was already successfully applied in preclinical CEST studies3. Herein, NLmCED was applied in both simulated and clinical 3T APTw brain tumor data and its performance was compared to that of several other spatial denoising methods.Methods
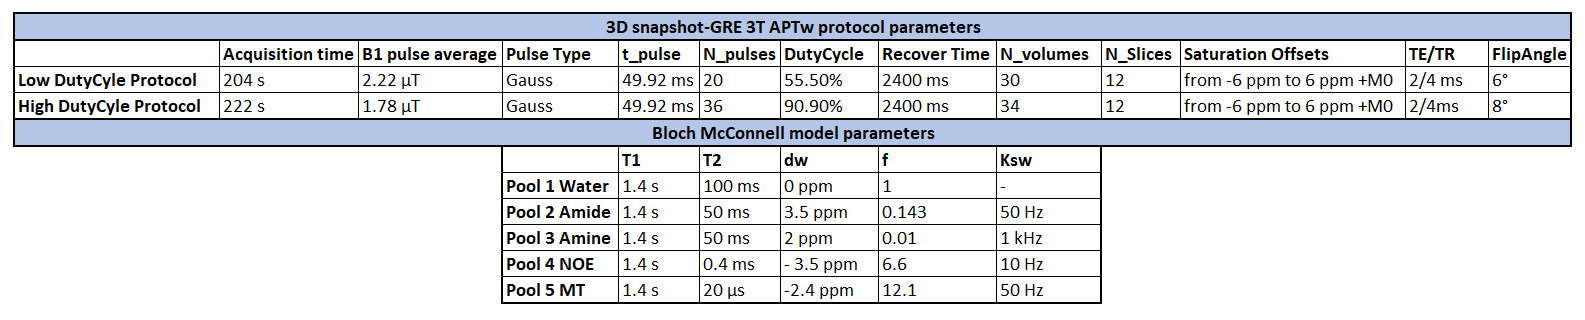
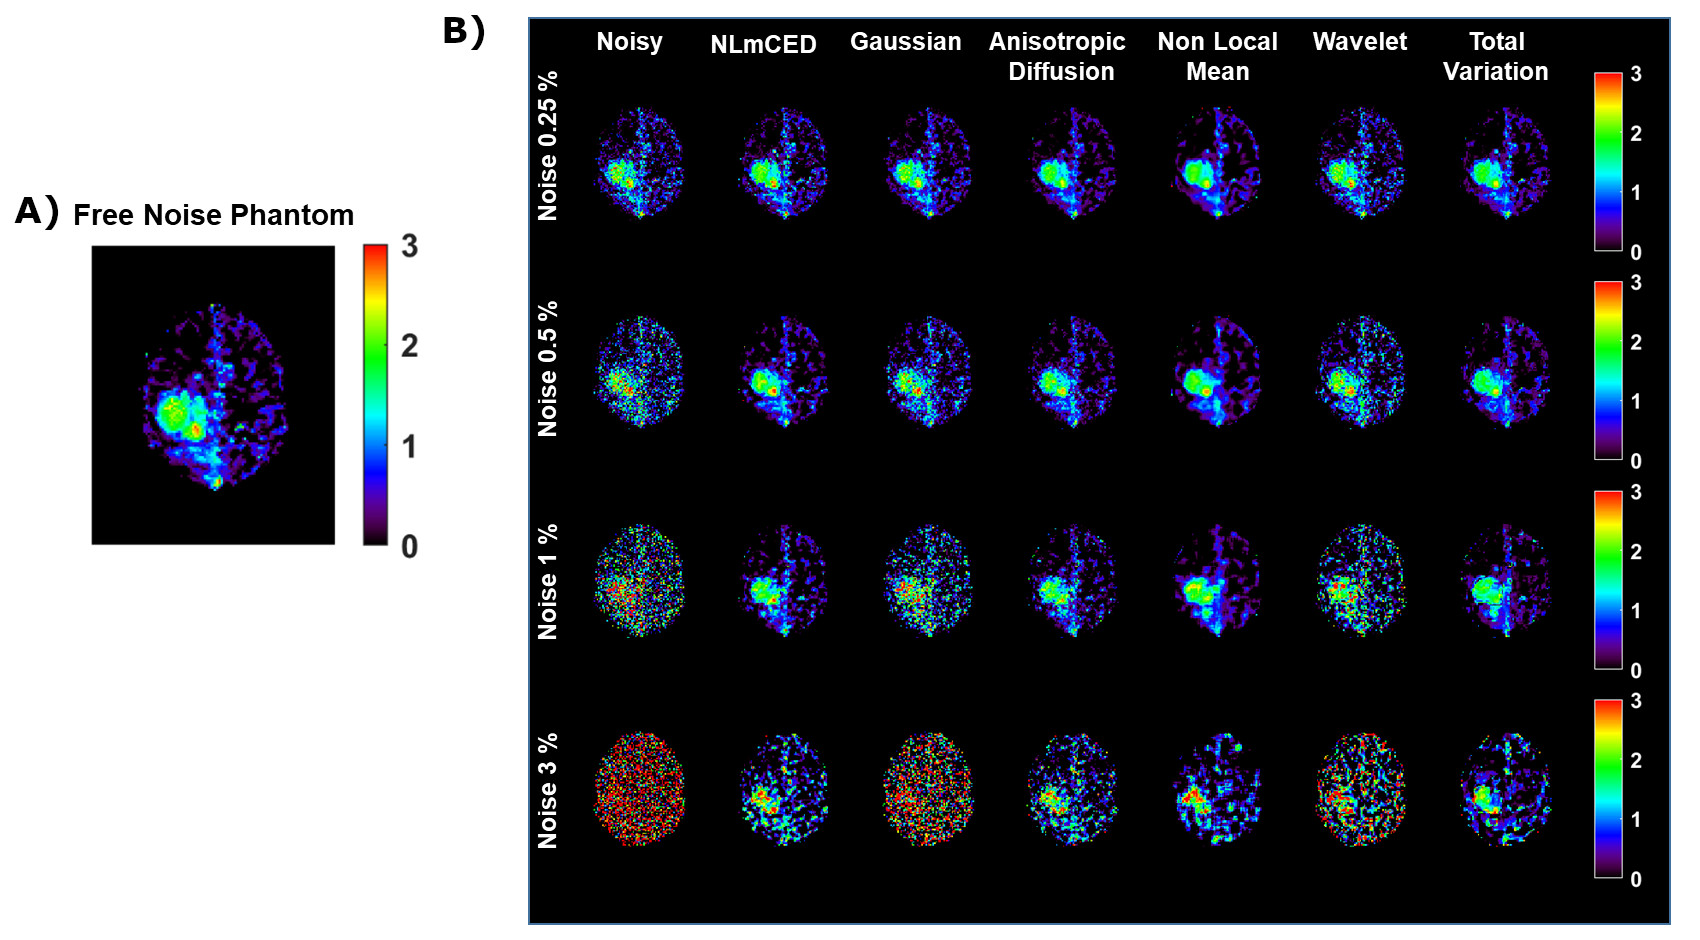
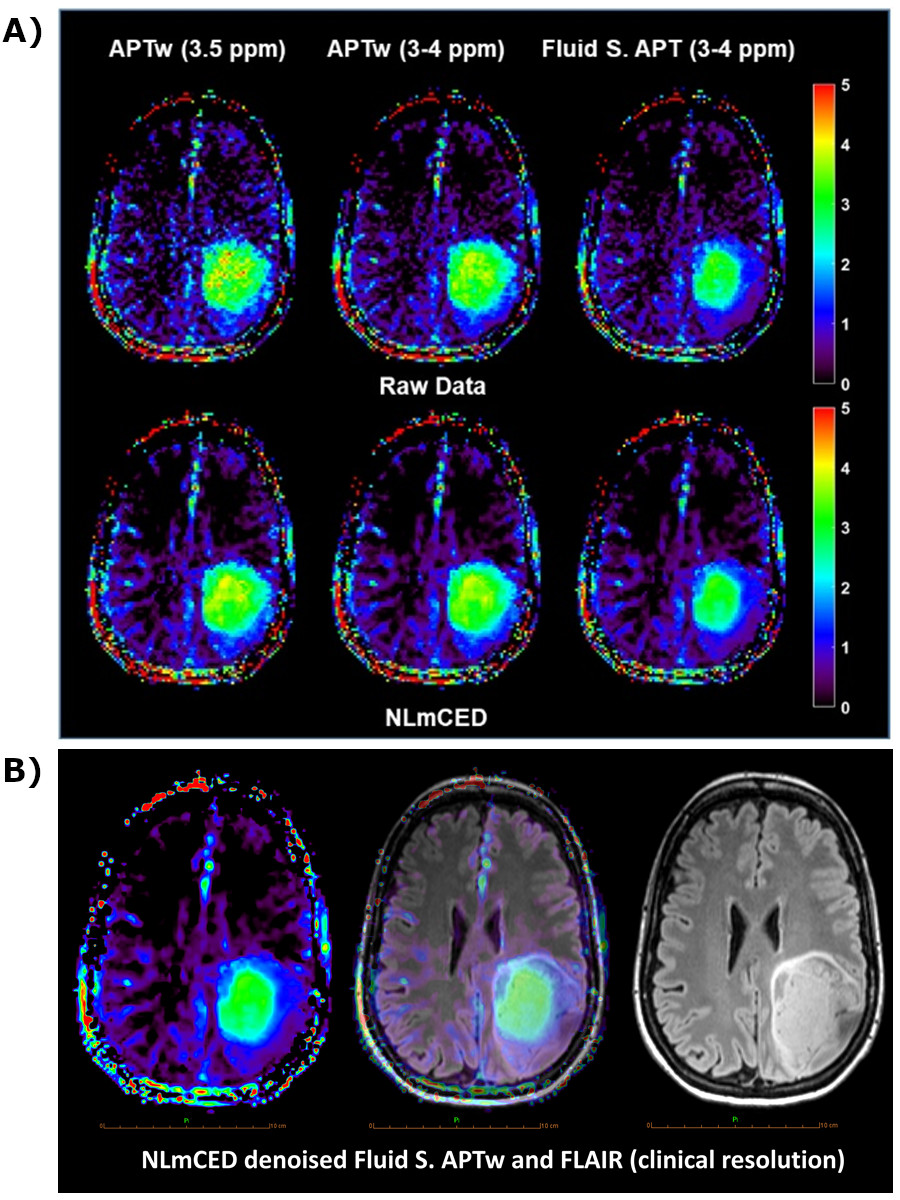
A simulated ground-truth dataset was generated starting from clinical APTw data of a brain tumor patient acquired on a 3T MRI scanner (Prisma, Siemens Healthineers, Germany), using a 3D snapshot-GRE4 with protocol parameter details listed in Figure 1. The APTw Z-Spectra were corrected using B0 map processed from WASAB1 sequence5 in Olea Sphere 3.0 (Olea Medical, La Ciotat, France). The Z-Spectra were fitted with the Bloch-McConnel equations modified to include the exchange terms with a five pools model (parameters listed in Figure 1) including Water, Amide (3.5 ppm), Amine (2 ppm), NOE (-3.5 ppm) and MT (-2.4 ppm) pools6,7, using MATLAB. The simulated brain phantom (ground truth) was corrupted by several percentage levels of Rician noise (0.25%, 0.5%, 1% and 3% of each pixel intensity) in the spatial domain. Several spatial filters (Gaussian, Wavelet8,9, Total Variation10 (TV), AD11, NLM12 and NLmCED) with standard and optimized settings were applied on the noisy simulated phantoms as well as in four patient raw clinical data. Two patients were acquired with a low duty cycle (50%), other two with a high duty cycle (90%), to encompass not equal settings between different imaging centers (protocol details in Figure 1). Quantitative metrics (PSNR, SSIM and MSE) were calculated on the APTw contrast map (computed using MTRasym metric13 at the amide frequency offset of 3.5 ppm from water) in the simulated Brain phantom, to evaluate the performance of the several denoising methods. For the clinical data, additional APTw contrast metrics such as asymmetry-average in a specific range (3 to 4 ppm) and fluid-suppressed contrast (Fluid S. APTw)14 were applied on the Z-Spectra after denoising using the NLmCED method to assess differences in visual detection of the tumor boundaries accordingly to the visualized CEST contrast.Results
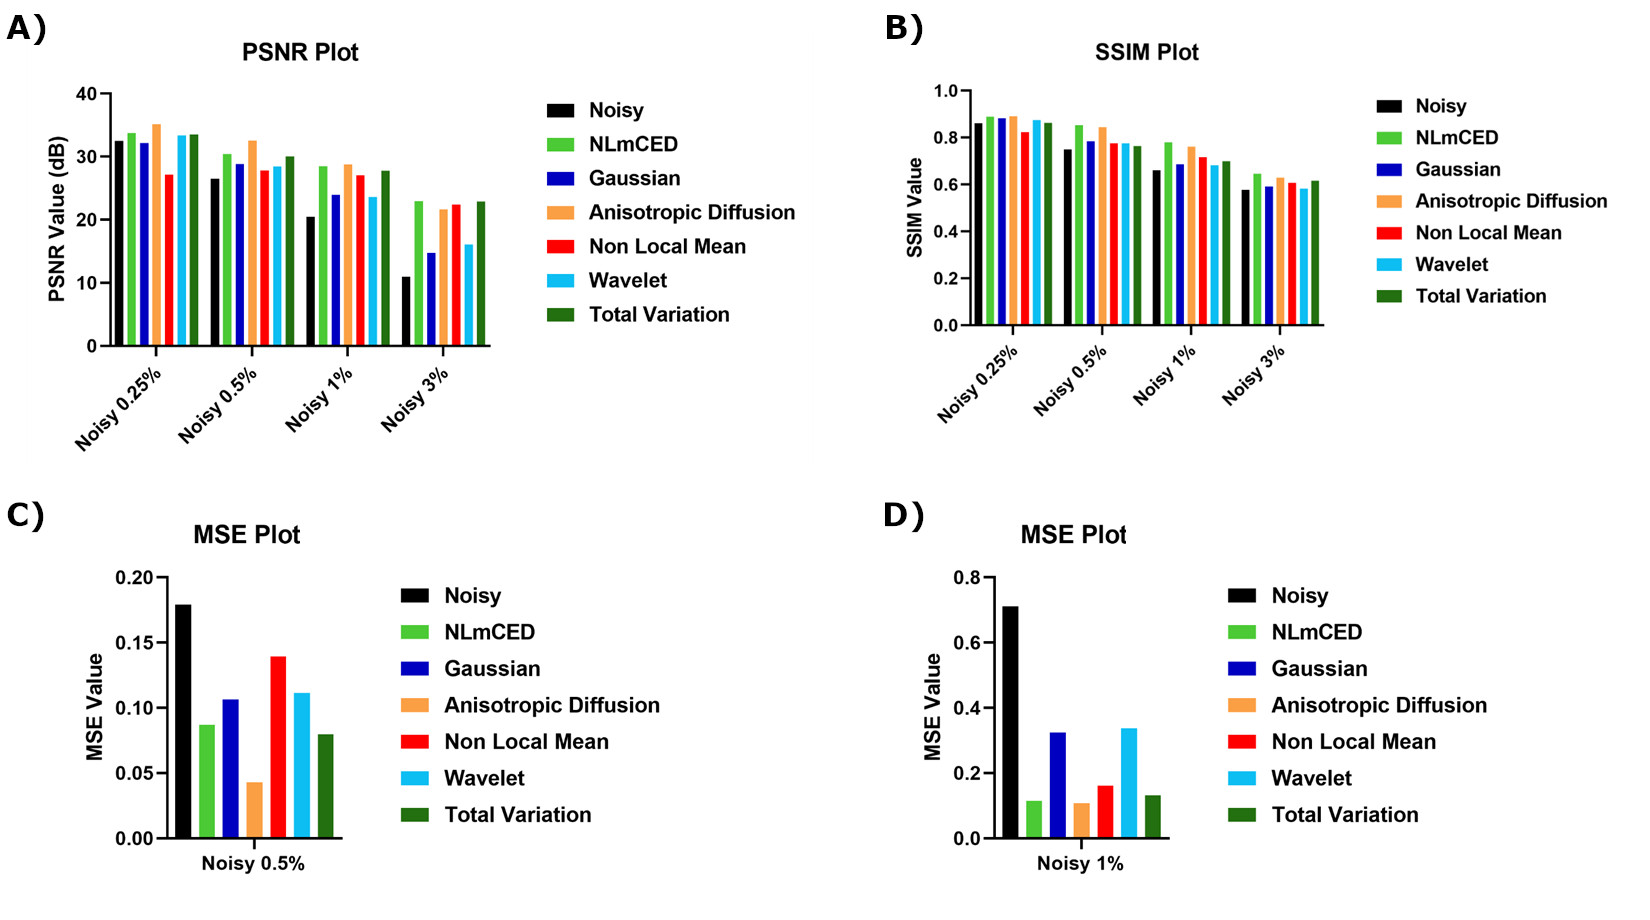
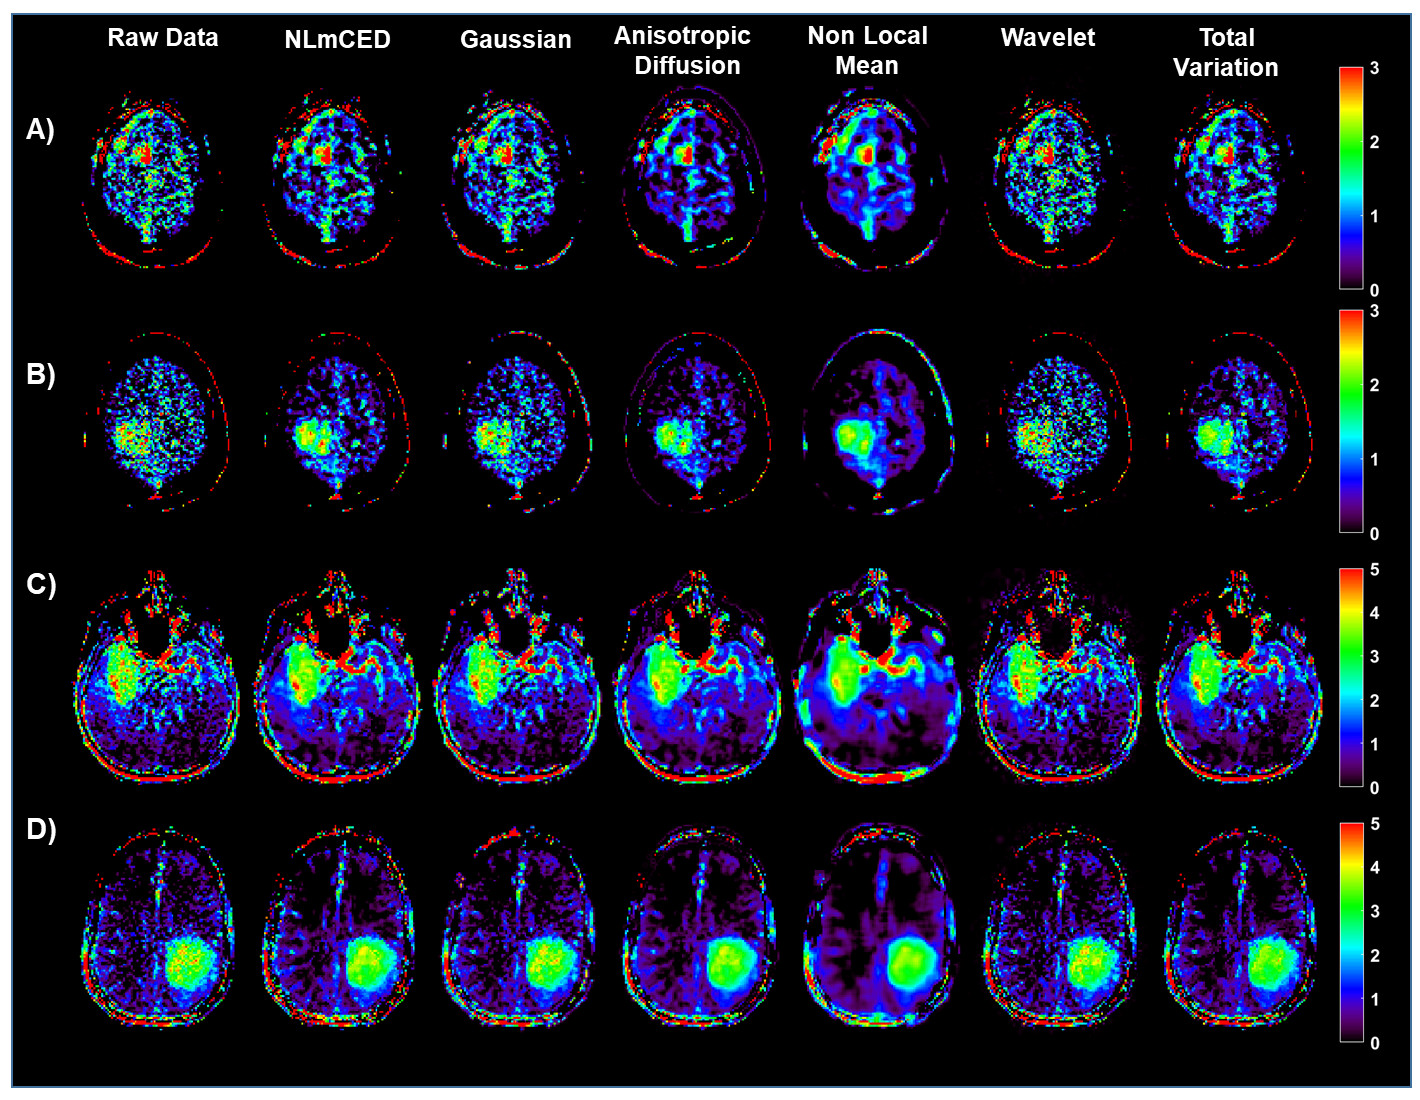
For the simulated data, only some of the APTw maps generated from the applied denoising methods were notably improved (Figure 2). Visually, Gaussian and wavelet filters were the least efficient denoising methods, whereas the NLmCED and AD filters provided more accurate homogeneous APTw contrast in tumor ROIs while preserving edges with slight improvement for the NLmCED method by keeping more informative region (red pixel in Figure 2) in the tumor ROI of the APTw maps. Quantitatively, all the denoising methods provided higher values for PSNR and SSIM index (Figure 3 A-B) and lower value for MSE metric (Figure 3 C-D), compared to the noisy data at different noise levels with the better performance of NLmCED and AD methods. For the clinical data, good results were obtained after applying the different spatial filters (Figure 4) for the four patients, but visually only the NLmCED, AD and TV methods succeed to remove noise and to maintain all the different significant information in the Tumor ROI. Instead, Gaussian and Wavelet filters kept random contrast variation in the images and the NLM filter succeed to remove noise but over smoothed the tumor edges. In addition, Figure 5 shows that noise was reduced by NLmCED filter in comparison to the raw APTw maps calculated with different metrics, preserving contours and accurate homogenate area in the tumor ROI. This fact seems to suggest that NLmCED led to an improved SNR of the Z-Spectrum itself, regardless of which contrast metric is applied next to compute APTw maps. Last raw of Figure 5, shows the NLmCED Fluid S. APTw map displayed at clinical resolution, co-registered with the FLAIR map of the same patient, highlighting an area with a potential high peptide content.Discussion and Conclusion
The obtained results show the benefit of using the proposed spatial denoising method for APTw imaging. NLmCED filter, looking for similarity pixel and structural information in the image, was the most performing method for reducing noise, without altering the spatial characteristics of the Z-Spectra. In order to find the optimal noise reduction processes for NLmCED method an accurate investigation tuning should be performed on more APTw clinical maps. As future work, it will be interesting to make a full comparison between NLmCED spatial filter and temporal denoising methods such as Principal Component Analysis (PCA) based filters, already used for CEST MR data denoising15 at 3T. A synergy between NLmCED spatial filter and PCA temporal filter can be also considered for APTw data denoising.Acknowledgements
The research leading to these results has received funding from AIRC MFAG 2017 ‐ ID. 20153 project – P.I. Longo Dario Livio.
This project has received funding from the European Union’s Horizon 2020 research and innovation programme under grant agreement No 667510 and the Department of Health’s NIHR-funded Biomedical Research Centre at University College London. SB and LM are supported by the National Institute of Health Research Biomedical Research Council, UCL Hospitals NHS Trust
References
1. Sotirios B, Demetriou E, Topriceanu CC, Zakrzewska Z. The role of APT imaging in gliomas grading: a systematic review and meta-analysis. European Journal of Radiology. 2020 Oct 16:109353.
2. Romdhane F, Benzarti F and Amiri H. A new method for three-dimensional magnetic resonance images denoising. Int. J. Comput. Vis. Robotics 8 (2018): 1-17.
3. Romdhane F, Villano D, Irrera P, Consolino L, Longo DL. Evaluation of a similarity anisotropic diffusion denoising approach for improving in vivo CEST-MRI tumor pH imaging. Magn Reson Med. 2021;00:1–18.
4. Deshmane A, Zaiss M, Lindig T, Herz K, Schuppert M, Gandhi C, Bender B, Ernemann U, Scheffler K. 3D gradient echo snapshot CEST MRI with low power saturation for human studies at 3T. Magnetic resonance in medicine. 2019 Apr;81(4):2412-23.
5. Schuenke P, Windschuh J, Roeloffs V, Ladd ME, Bachert P, Zaiss M. Simultaneous mapping of water shift and B1 (WASABI)—application to field‐inhomogeneity correction of CEST MRI data. Magnetic resonance in medicine. 2017 Feb;77(2):571-80.
6. Khlebnikov V, Windschuh J, Siero JCW, et al. On the transmit field inhomogeneity correction of relaxation‐compensated amide and NOE CEST effects at 7 T. NMR in Biomedicine. 2017; 30: e3687.
7. Zhang L, Zhao Y, Chen Y, Bie C, Liang Y, He X, Song X. Voxel-wise Optimization of Pseudo Voigt Profile (VOPVP) for Z-spectra fitting in chemical exchange saturation transfer (CEST) MRI. Quant Imaging Med Surg 2019;9(10):1714-1730.
8. Donoho, D. L. Progress in Wavelet Analysis and WVD: A Ten Minute Tour. Progress in Wavelet Analysis and Applications (Y. Meyer, and S. Roques, eds.). Gif-sur-Yvette: Editions Frontières, 1993.
9. Donoho, D. L. De-noising by Soft-Thresholding. IEEE Transactions on Information Theory, Vol. 42, Number 3, pp. 613–627, 1995.
10. Louchet C, Moisan L. Total Variation as a local filter. SIAM Journal on Imaging Sciences, Society for Industrial and Applied Mathematics, 2011, 4 (2), pp.651-694.
11. Perona P and Malik J. Scale-Space and Edge Detection Using Anisotropic Diffusion. IEEE Trans. Pattern Anal. Mach. Intell.12, 7 (July 1990), 629-639.
12. Buades A, Coll B, Morel JM. A review of image denoising algorithms, with a new one. Multiscale Model Sim. 2005;4:490-530.
13. Zhou J, Payen JF, Wilson DA, Traystman RJ, Van Zijl PC. Using the amide proton signals of intracellular proteins and peptides to detect pH effects in MRI. Nature medicine. 2003 Aug;9(8):1085-90.
14. Casagranda S, Mancini L, Gautier G, Peter P, Lopez B, et al.. Fluid suppression in CEST imaging affects predominantly IDH-mutant 1p/19q retained gliomas with T2- FLAIR mismatch. ISMRM 29th Annual Meeting, Aug 2020.
15. Breitling J, Deshmane A, Goerke S, Korzowski A, Herz K, Ladd ME, Scheffler K, Bachert P, Zaiss M. Adaptive denoising for chemical exchange saturation transfer MR imaging. NMR in Biomedicine. 2019 Nov;32(11):e4133.
Figures