2801
A preliminary investigation into the contribution of Amines to the CEST contrast at 2 ppm and 3 ppm in high-grade gliomas at 7T1Department of Radiology, Leiden University Medical Center, Leiden, Netherlands, 2Department of Neurology, Leiden University Medical Center, Leiden, Netherlands, 3Department of Neurology, Haaglanden Medical Center, The Hague, Netherlands
Synopsis
CEST allows to non-invasively image metabolites and proteins, and the role of APT and NOE CEST in gliomas has been widely investigated. On the other hand, the contribution of amines to the CEST signal at 2 and 3 ppm, and its relationship to creatine and glutamate concentrations, remain unclear. We evaluated the amine CEST contrast in tumor and contralateral white matter in three glioma patients, and compared it to the MRS data. Overall we found a decrease in amine CEST alongside a decrease in total creatine and glutamate in the tumor compared to the contralateral white matter.
Introduction
Chemical exchange saturation transfer (CEST) is a non-invasive MRI technique which can provide contrast originating from endogenous metabolites and proteins1. The usefulness of CEST imaging, specifically amide proton transfer (APT) and nuclear overhauser effect (NOE)2,3 has been widely explored in glioma patients. More recently, the role of amines, such as glutamate-weighted CEST has been explored in relation to metabolic changes in diffuse gliomas and epilepsy at 7T4. Moreover, the contribution of creatine, another metabolite with amine protons (at 2 ppm), has also been explored in patients with glioma on pre-clinical glioma models5,6. Despite the evidence that amines at both 2 and 3 ppm provide relevant information on gliomas, no study has yet directly compared them and investigate the metabolic origin of the signal from these pools using MR Spectroscopy (MRS). In this preliminary work, we assessed the amine CEST contrast at 2 and 3 ppm in three glioma patients and compared the CEST signal with the current gold standard of metabolite imaging, MRS.Methods
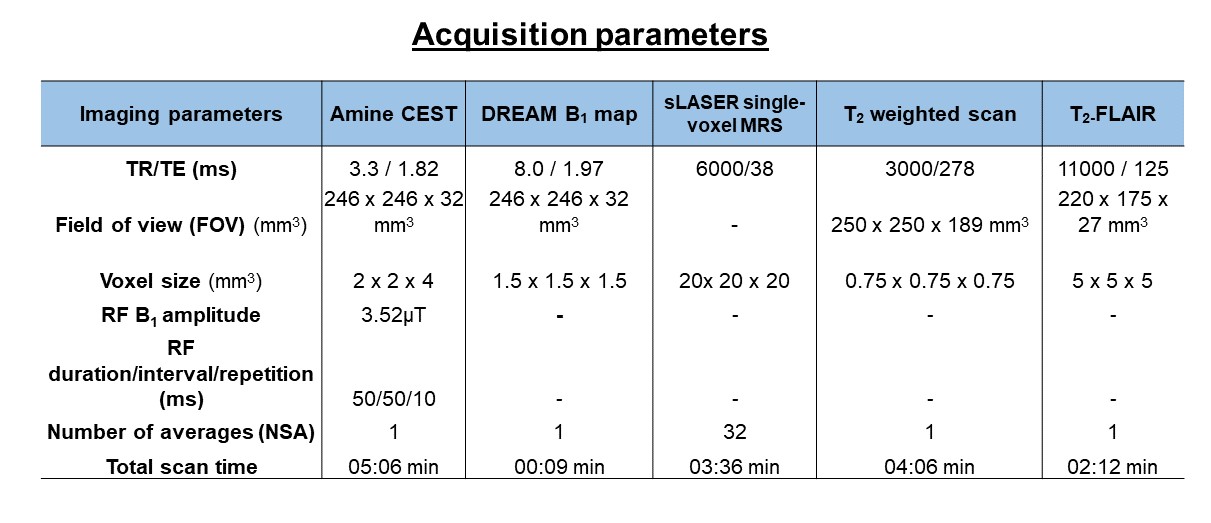
We prospectively included three glioblastoma WHO grade IV patients (2 Males, 1 Female, Mean age: 57+9). CEST, MRS and T2-weighted scans were acquired on a 7T MRI scanner. The anatomical T2-FLAIR was acquired as part of the clinical workflow at 3T. T2-weighted images were used to plan CEST and MRS scans. Slices of interest for CEST and volumes of interest (VOIs) for MRS included the largest tumor lesion, excluding necrotic tissue. MRS data were also collected from a VOI positioned in contralateral white matter (CLWM). For quantitative comparisons of CEST contrast and MRS data, the MRS VOIs in the tumor and CLWM were used as a mask on the CEST maps. Image acquisition details can be found in Table 1.CEST post-processing: CEST images were corrected for B0 inhomogeneities by interpolation followed by shifting the Z-spectra based on the minimum Z; and for B1 inhomogeneities, using a linear correction per voxel by using the B1 maps. The CEST Z-spectra and magnetization transfer ratio (MTR) asymmetry were calculated per voxel, for amines at 2 and 3 ppm: $$MTRasym = [Z(-x ppm) - Z(+x ppm)] / Z(-x ppm)$$
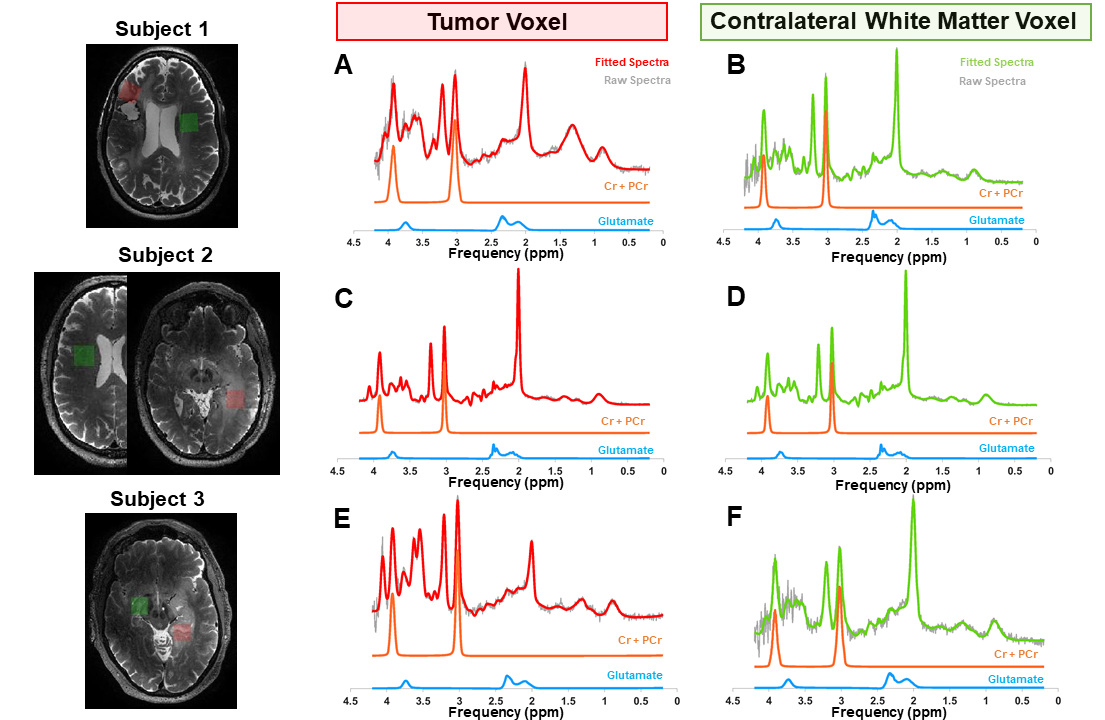
MRS post-processing: Water-suppressed MRS spectra were corrected for eddy-currents using a custom-built MATLAB routine and fitted with 7,8 A basis-set was generated using FID-A toolbox9. Concentration and cramer-rao lower bounds (CRLBs) for total creatine (Cr+PCr) and glutamate were obtained from LCModel output. In Figure 1, the fitted spectra from the tumor lesion and CLWM of each patient are shown in red and green, respectively, as well as the corresponding VOI.
Results
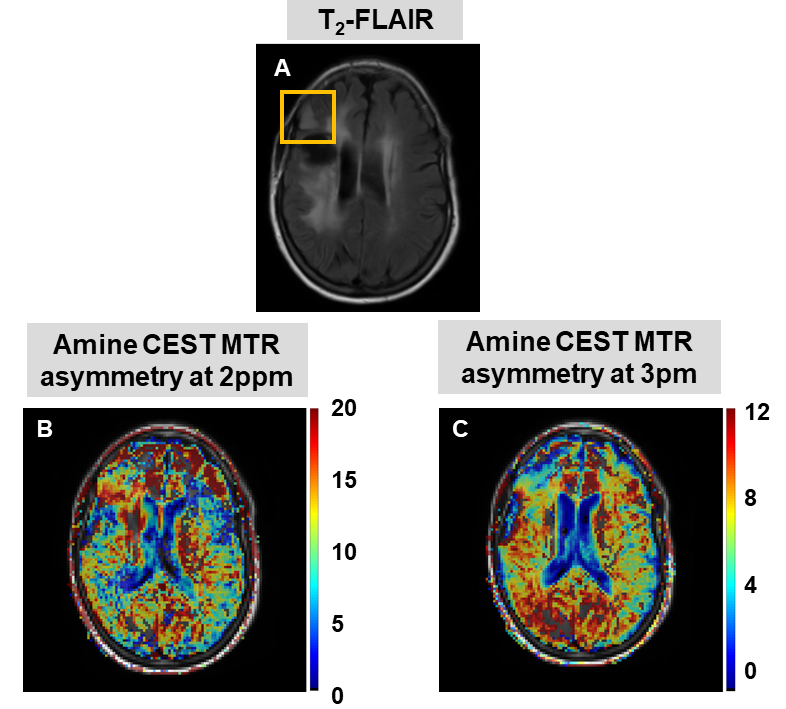
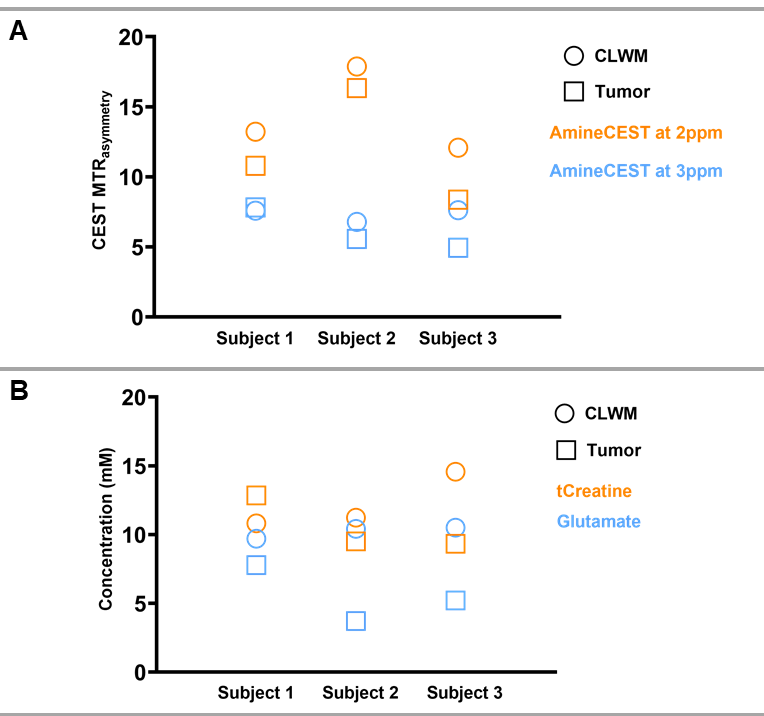
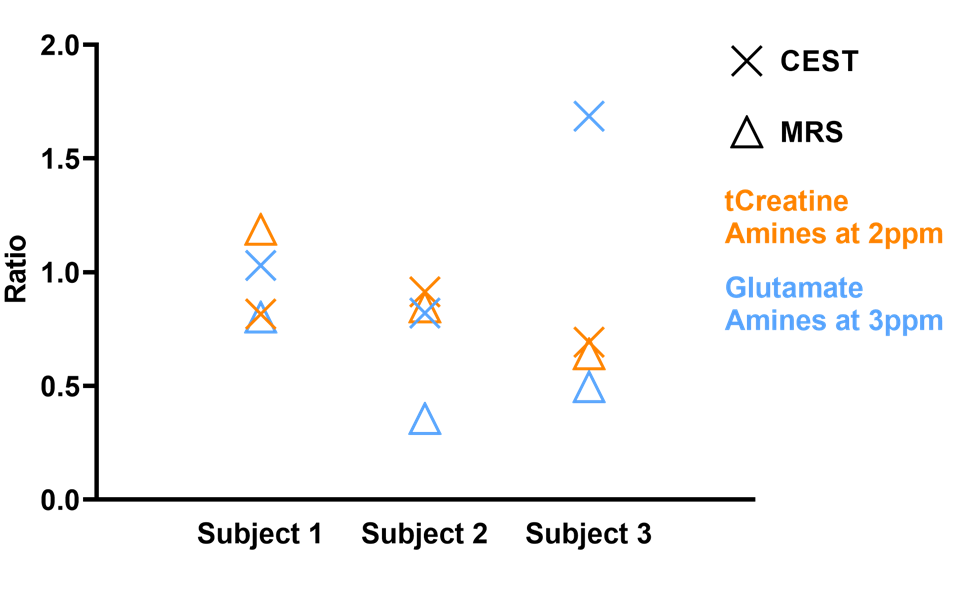
Figure 2 shows the CEST results of one patient, where the MTR asymmetry maps for amines at 2 and 3 ppm have been overlaid on the T2-FLAIR. In Figure 3A, we display the MTR asymmetry values for each patient. MTR asymmetry values at 2 ppm (orange squares - Subject 1: 10.79; Subject 2: 16.34; Subject 3: 8.36) are lower for tumors compared to CLWM (orange circles – Subject 1: 13.22; Subject 2: 17.88; Subject: 12.08). In Figure 3B, the concentration of total creatine and glutamate are shown for both the tumor lesion and CLWM. It can also be seen that the tCr concentration is lower in the tumor (orange squares – Subject 1: 12.85; Subject 2: 9.51; Subject 3: 9.33) when compared to CLWM (orange circles – Subject 1: 10.82; Subject 2: 11.24; Subject 3: 14.57) except for Subject 1. Figure 4 shows the ratios between tumor and CLWM, for CEST and MRS, per subject. In orange, tCr and amines at 2 ppm have similar ratios. Conversely, glutamate and amines at 3 ppm (blue triangle and blue cross, respectively) are further apart with bigger differences in ratio values.Discussion and conclusion
This work aimed at assessing the amine CEST contrast at 2 and 3 ppm in high-grade glioma (HGG) tumors compared to CLWM and their relationship to metabolite concentration measured by MRS at 7T. Contrarily to a recent study4, our results show a decrease in MTR Asymmetry at 2 and 3 ppm in tumors compared to CLWM. Neal et al. investigated the CEST contrast of glutamate (at 3ppm) in glioma patients (WHO grade II-III) with epilepsy, supporting the role of glutamate in the biology of diffuse gliomas4. Differently from this study, our patient population consisted of only WHO grade IV patients. This could explain why we did not see a higher CEST-signal from tumors compared to CLWM. In line with our results, a recent study showed lower CEST signal at 2 ppm in HGG patients, and concluded that amine CEST at 2 ppm could be useful for glioma stratification together with molecular markers6. Moreover, Cai et al. have previously shown a lower CEST signal at 2ppm in a pre-clinical model of brain tumors and its correlation to creatine distribution5. Similarly, our results based upon MRS also suggest that creatine is the main contributor to the CEST contrast at 2 ppm. In conclusion, our results suggest that the amine pool at 2 ppm relates to creatine distribution and can be used as a more prominent marker for HGG. Work in progress includes collecting data from a larger group of patients to confirm our preliminary results.Acknowledgements
Funding by: Medical Delta Cancer 3.0, NWO grant #16862References
1. Wu B, Warnock G, Zaiss M, et al. An overview of CEST MRI for non-MR physicists. EJNMMI Phys. 2016;3(1). doi:10.1186/s40658-016-0155-2
2. Zaiss M, Windschuh J, Paech D, et al. Relaxation-compensated CEST-MRI of the human brain at 7T: Unbiased insight into NOE and amide signal changes in human glioblastoma. Neuroimage. 2015;112:180-188. doi:10.1016/j.neuroimage.2015.02.040
3. Wen Z, Hu S, Huang F, et al. MR imaging of high-grade brain tumors using endogenous protein and peptide-based contrast. Neuroimage. 2010;51(2):616-622. doi:10.1016/j.neuroimage.2010.02.050
4. Neal A, Moffat BA, Stein JM, et al. Glutamate weighted imaging contrast in gliomas with 7 Tesla magnetic resonance imaging. NeuroImage Clin. 2019;22(June 2018):101694. doi:10.1016/j.nicl.2019.101694
5. Cai K, Singh A, Poptani H, et al. CEST signal at 2ppm (CEST at 2ppm) from Z-spectral fitting correlates with creatine distribution in brain tumor. NMR Biomed. 2015;28(1):1-8. doi:10.1002/nbm.3216
6. Su C, Xu S, Lin D, et al. Multi-parametric Z-spectral MRI may have a good performance for glioma stratification in clinical patients. Eur Radiol. Published online 2021. doi:10.1007/s00330-021-08175-3
7. Provencher SW. Estimation of metabolite concentrations from localized in vivo proton NMR spectra. Magn Reson Med. 1993;30(6):672-679. doi:10.1002/mrm.1910300604
8. Klose U. In vivo proton spectroscopy in presence of eddy currents. Magn Reson Med. 1990;14(1):26-30. doi:10.1002/mrm.1910140104
9. Simpson R, Devenyi GA, Jezzard P, Hennessy TJ, Near J. Advanced processing and simulation of MRS data using the FID appliance (FID-A)—An open source, MATLAB-based toolkit. Magn Reson Med. 2017;77(1):23-33. doi:10.1002/mrm.26091
Figures