2800
In vivo metabolic CEST changes in brain tumors in a model of metastatic breast cancer1Radiology and Imaging Sciences, Clinical Center, National Institutes of Health, Bethesda, MD, United States, 2Molecular imaging laboratory, Department of Radiology, Howard University College of Medicine, Washington DC, DC, United States
Synopsis
Metabolic changes may occur earlier and/or may help distinguish different type of tumors. We investigated the metabolic changes using CEST MRI and characterized induced metastatic breast cancer in the brain of 10 nude rats. In vivo CEST MRI were performed at 9.4T on 3 slices with 31 frequency offsets to cover the full Z-spectra. A total of 12 tumors were analyzed for CEST signal changes. Different tumor types (solid tumor vs necrosis) showed different metabolites uptakes. Tumors located within the dentate gyrus showed significant increased values compared to the tumors in brainstem, cortex and hippocampus.
Background
Metastatic breast cancer is known to have a high prevalence of brain metastases with poor patient1. Brain metastasis are very heterogenous (solid tumor vs co-opted vessel, leaky vs closed bood-brain barrier) and macro-metastases are only detected in the late stage using anatomical MRI2. However, metabolic changes may occur earlier and/or may help distinguish different type of tumors. Glucose and glutamate are one of the most used nutrients by tumor cells and has been successfully imaged using the relatively recent new technique chemical exchange saturation transfer (CEST)3. In this study, we investigate the metabolic changes using CEST MRI and characterize hematogenous induced metastatic breast cancer in the brain over time.Method
A total of 10 nude rats were injected intracardiacally (IC) with 3x10⁶ MDA-MB231 brain seeking breast cancer cells2. CEST MRI was performed at Bruker 9.4T at weeks four and five post cancer cell injection on 3 slices using a continuous-wave saturation pulse (B1 sat=2 µT, 2s) with 31 frequency offsets to acquire full Z-spectra between ± 6 ppm, followed by T2-w RARE (TR/TE= 6138/6 ms, RARE factor =6, NEX=1) of anatomical images. Slice thickness was 0.8 mm with in-plane resolution of 0.35 mm2. An IV bolus of D-glucose was injected to the nude rats before acquiring the CEST dataset. Z spectra was corrected for B0 inhomogeneity using WASSR4. CEST maps for 4 metabolites of interest were obtained by integrating the area under the curve from the MTRasym curves5,6: 0.8-1.6ppm (hydroxyl), 1.8-2.2 ppm (creatine), 2.8-3.2 ppm (glutamate), 3.3-3.7 ppm (amide). Each CEST map was normalized to the whole brain intensity to get the tumor signal changes to the contralateral normal-appearing brain. For analysis, ROIs of a total of 12 tumors were defined based on RARE T2-w. Hematoxilin and Eosin (H&E) was performed on selected tumors. Statistical analysis was conducted by Rstudio (version 1.3.1093).Results
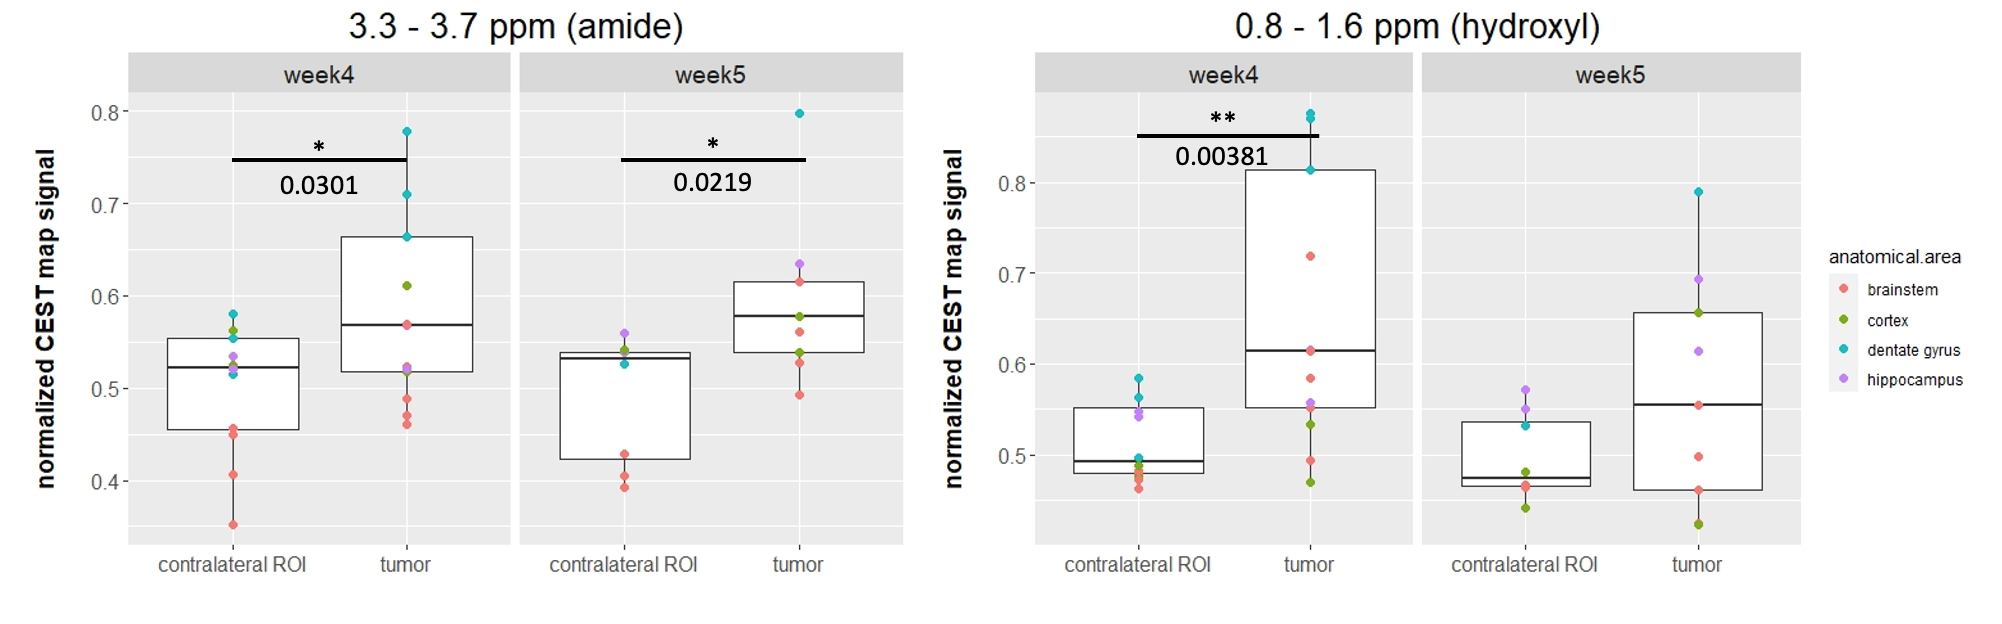
Nude rats developed metastatic brain tumors on the selected MRI slices between weeks four and five post IC injection and corresponded to the appearance of CEST signals (Figure 1). A representative Z spectra and the MTRasym show a distinction between the tumor and the contralateral tissue. Other tumors are showed on figure 2. A tumor located in the brainstem does not show changes at 0.8-1.6 ppm while possible changes are seen at 3.3-3.7 ppm. A tumor in the cortex however shows strong CEST signal at various frequencies. There was a significant difference in CEST signal change at 0.8-1.6 ppm (p=0.00381) on week 4 but not on week 5. Significant differences are seen at 3.3 - 3.7 ppm corresponding to amides (p=0.0301 at week 4 and p=0.0219 at week 5). The results demonstrate a statistically significant interaction between the CEST signal changes and the anatomical locations (p<0.01 for hydroxyl at week4 and p<0.05 for amide). Tumors located within the dentate gyrus showed significant increased values compared to the tumors in brainstem, cortex and hippocampus (difference up to 21% with cortex for the hydroxyl) which the results were consistent across several frequency offsets and timepoints (week 4 for hydroxyl and week 4 and 5 for amide).Discussion
The investigation of breast cancer brain metastases was evaluated with CEST for metabolic changes. Brain metastases demonstrated differences in metabolites levels which was associated with appearance on T2w images. Tumors with areas of necrosis had little or no CEST metabolite contrast compared to contralateral normal appearing brain (CNAB). However, solid metastases and breast cancer that appeared to co-opt vessels on histology did have similar appearance on CEST contrast for amides, glutamate, creatine, and hydroxyl compared to CNAB. These results indicate that hematogenous induced breast cancer brain metastasis CEST contrast will vary depending on location and degree of tumor formation (i.e., solid vs co-opted vessels) providing the ability of monitoring the heterogeneity and potential response to treatment. Further research will involve the optimization of CEST protocol to see differences in glucose presence across tumors.Acknowledgements
No acknowledgement found.References
1. Palmieri D, Chambers AF, Felding-Habermann B, Huang S, Steeg PS. The biology of metastasis to a sanctuary site. Clin Cancer Res. 2007 Mar 15;13(6):1656-62.
2. Song HT, Jordan EK, Lewis BK, Liu W, Ganjei J, Klaunberg B, Despres D, Palmieri D, Frank JA. Rat model of metastatic breast cancer monitored by MRI at 3 tesla and bioluminescence imaging with histological correlation. J Transl Med. 2009 Oct 20;7:88.
3. Goldenberg JM, Pagel MD. Assessments of tumor metabolism with CEST MRI. NMR Biomed. 2019 Oct;32(10):e3943.
4. Kim M, Gillen J, Landman BA, Zhou J, van Zijl PC. Water saturation shift referencing (WASSR) for chemical exchange saturation transfer (CEST) experiments. Magn Reson Med. 2009 Jun;61(6):1441-50.
5. Kogan F, Hariharan H, Reddy R. Chemical Exchange Saturation Transfer (CEST) Imaging: Description of Technique and Potential Clinical Applications. Curr Radiol Rep. 2013 Jun 1;1(2):102-114.
6. van Zijl PC, Yadav NN. Chemical exchange saturation transfer (CEST): what is in a name and what isn't? Magn Reson Med. 2011 Apr;65(4):927-48.
Figures
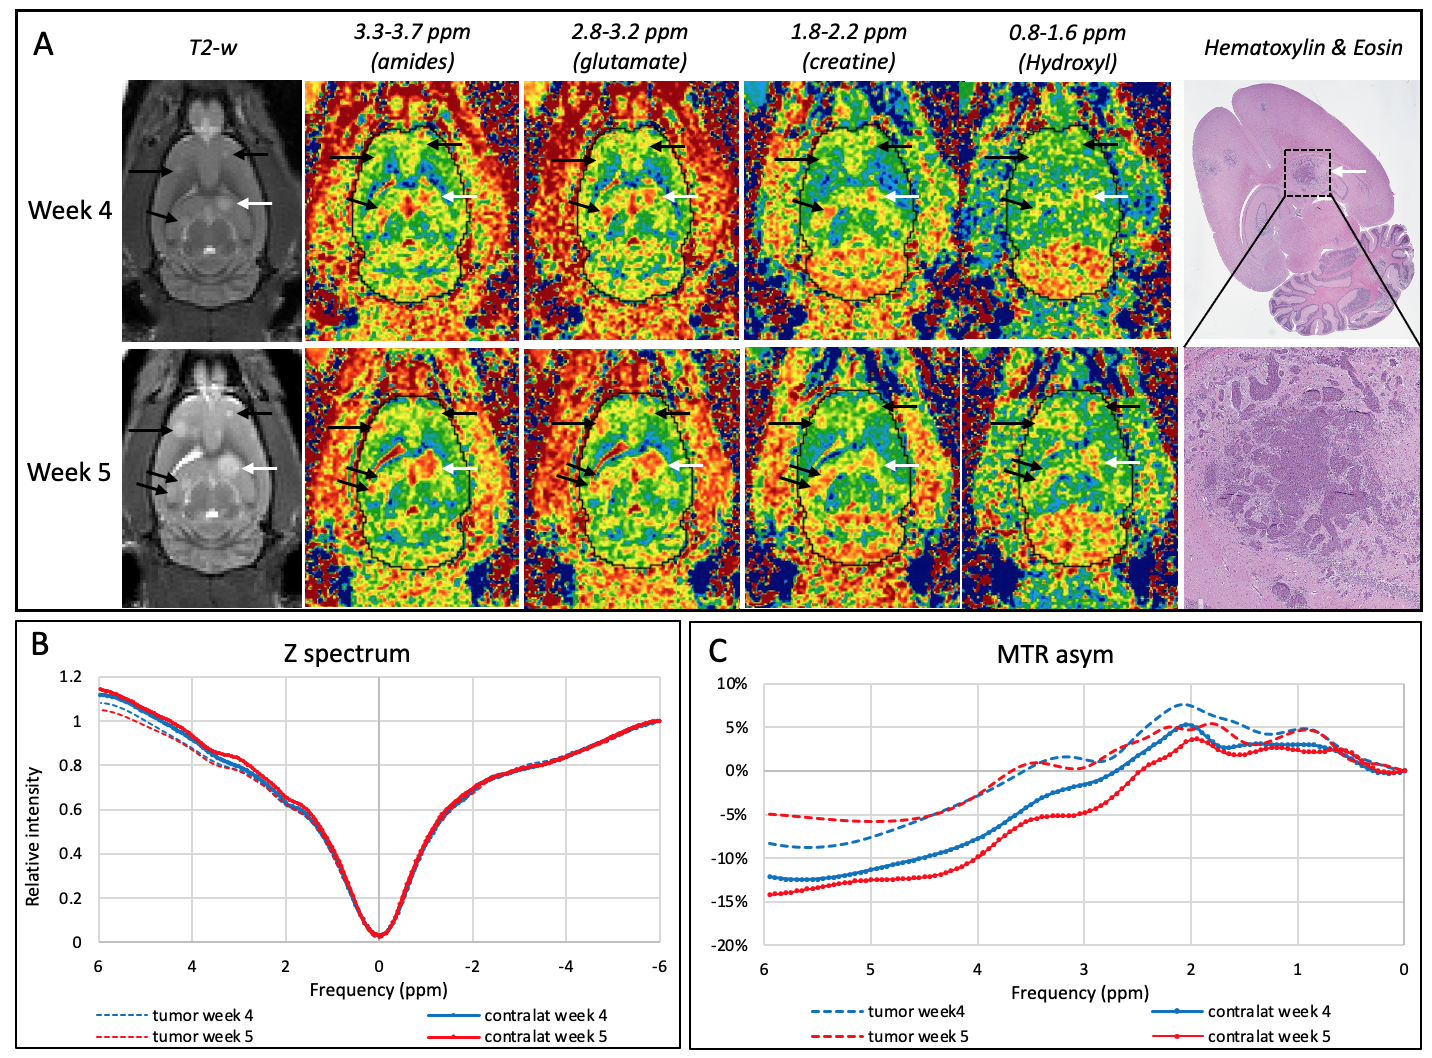
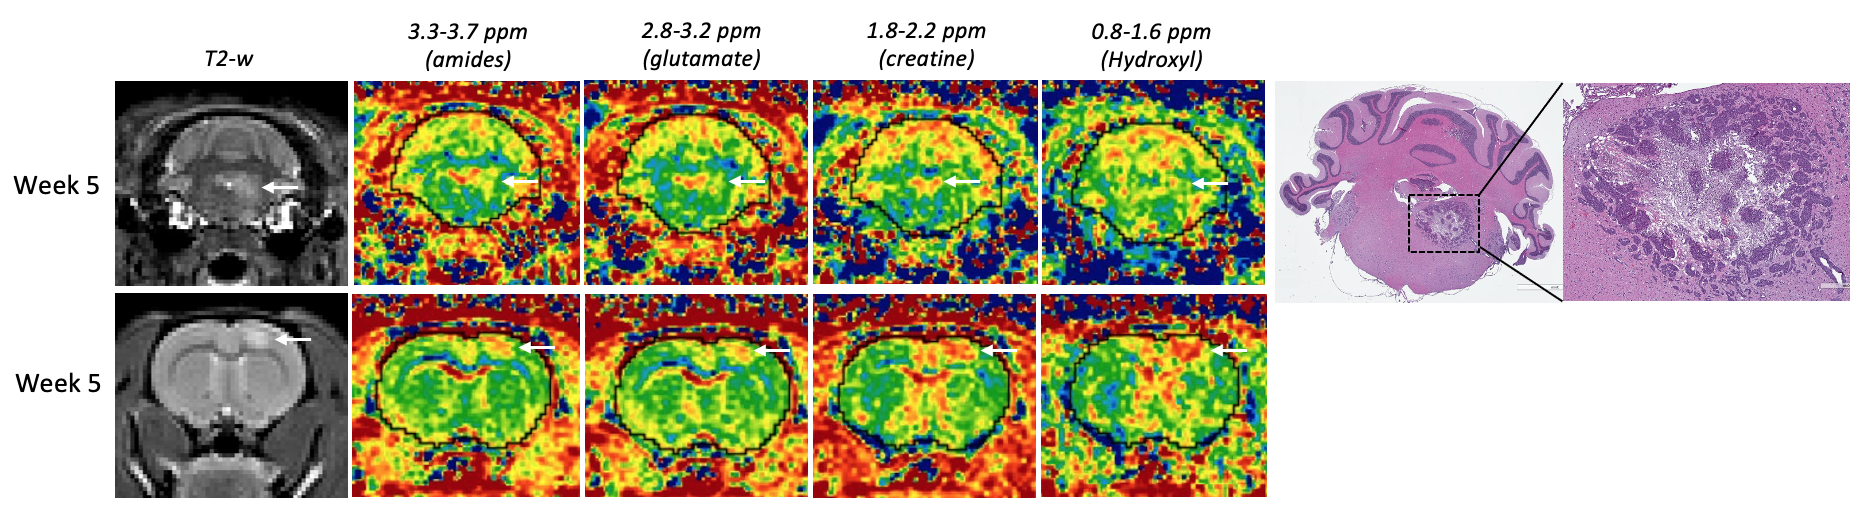
In vivo CEST MRI of nude rat brains at week 5 post cancer cell injection with their corresponding T2-weighted and H&E staining.