2799
Molecular imaging of breast cancer by chemical exchange saturation transfer (CEST) MRI of glucosamine: first human experience
Michal Rivlin1, Debbie Anaby2,3, Noam Nissan2,3, Moritz Zaiss4, Anagha Deshmane5, Miri Sklair-Levy3,6, and Gil Navon1
1School of Chemistry, Tel-Aviv University, Tel-Aviv, Israel, 2Department of Diagnostic Imaging, Sheba Medical Center, Ramat-Gan, Israel, 3The Sackler School of Medicine, Tel-Aviv University, Tel-Aviv, Israel, 4Department of Neuroradiology, University Clinic Erlangen, Friedrich-Alexander Universität Erlangen-Nürnberg (FAU), Erlangen, Germany, 5Department of Biomedical Magnetic Resonance, University of Tübingen, Tübingen, Germany, 6Meirav High Risk Clinic, Department of Diagnostic Imaging, Sheba Medical Center, Ramat-Gan, Israel
1School of Chemistry, Tel-Aviv University, Tel-Aviv, Israel, 2Department of Diagnostic Imaging, Sheba Medical Center, Ramat-Gan, Israel, 3The Sackler School of Medicine, Tel-Aviv University, Tel-Aviv, Israel, 4Department of Neuroradiology, University Clinic Erlangen, Friedrich-Alexander Universität Erlangen-Nürnberg (FAU), Erlangen, Germany, 5Department of Biomedical Magnetic Resonance, University of Tübingen, Tübingen, Germany, 6Meirav High Risk Clinic, Department of Diagnostic Imaging, Sheba Medical Center, Ramat-Gan, Israel
Synopsis
In preclinical experiments in implanted breast cancer tumors in mice, glucosamine (GlcN) exhibited enhanced chemical exchange saturation transfer (CEST) MRI signals. Moving toward clinical application, considering the excellent safety profile of GlcN, we examined the feasibility of using the GlcN CEST method to detect human breast cancer on a 3T clinical scanner. Here we report significant CEST MRI signals resulting from the exchangeable protons of GlcN hydroxyls, amine/amide residues as well as nuclear Overhauser enhancement (NOE). Thus, CEST MRI using GlcN has the potential to detect tumors and report their activity, without the use of a gadolinium contrast agent.
INTRODUCTION
The chemical exchange saturation transfer (CEST) MRI technique is evolving as an attractive molecular imaging approach with the ability to provide valuable metabolic information. The efficacy of glucosamine (GlcN) as an agent for CEST MR molecular imaging of tumors was recently demonstrated in several animals' tumor models1,2. The potential of a clinical application of CEST MRI with GlcN is strengthened by its lack of toxicity as can be indicated from its wide use as a food supplement3. Here, the translation of the GlcN CEST MRI method to a clinical MRI set-up was examined, in order to evaluate the feasibility of obtaining a new class of contrast agent for breast cancer MR imaging that enables the tumor to be distinguished from the surrounding tissue and to compare it to the conventional MRI method.METHODS
Twelve patients with newly-diagnosed breast tumors (median age, 53 years) were recruited in this prospective IRB-approved study. Informed consent was obtained from all patients. GlcN CEST-MRI scans were conducted at a 3T clinical scanner (PRISMA, Siemens, Germany) using a bilateral diagnostic breast coil (16 channels, Siemens, Germany) after a minimum of a 6 hour fast. The patients were scanned with the CEST MRI protocol before and two hours after drinking a solution of 7.5 g of GlcN sulfate (Arthryl, Rafa, Jerusalem, Israel) in 150 ml water. Optimal slice positioning of the CEST sequence (with 8 slices) was supported by high-resolution T2W images acquired at the beginning of the examination. Pre-saturation of the CEST sequence consisted of 5 Gaussian-shaped RF pulses (pulse length tp=100ms, inter-pulse delay=61ms, 2s between measurements, B1=2.5μT, recover time=5s) at 17-24 frequency offsets sampled in the range of ±6ppm. Fully relaxed images were acquired for normalization. CEST sequence was followed by a spiral-reordered 3D single-slice GRE read-out (TE=2.2ms; TR=5.0ms; FA=10o; FoV, 280; matrix, 264×320; slice thickness=2.5mm; bandwidth=660Hz/Px, fat suppression-on). To improve B0 homogeneity, unilateral shimming was performed. CEST signal intensities were quantified in the tumor and in the surrounding tissue after the correction of B0 field inhomogeneity. Data interpretation was done by magnetization transfer asymmetry ratio (MTRasym) and a multi-Gaussian fitting4. The routine breast MR protocol also included T1W- dynamic contrast-enhanced (DCE) imaging with the injection of gadolinium contrast agent following the CEST scans.RESULTS
Analysis of signal intensities from ROIs in the tumors and the surrounding breast tissue revealed higher CEST values in the tumor tissue (MTRasym effect of 8.1±4.1%, N=12, P<0.05 with the incremental increase due to the GlcN administration of 3.4±0.8%, N=12, P<0.05), which correlated well with tumor areas as demonstrated by DCE MRI (Figs.1,2). The Z-spectra of breast tumors had distinct GlcN CEST peaks corresponding to the presence of hydrogen exchange between free water and hydroxyl, amide/amine, and relayed nuclear Overhauser enhancement (NOE) from aliphatic groups, all yielded larger CEST integrals in the tumor tissue after GlcN uptake by an averaged factor of 2.2±1.2 (P<0.01),1.4±0.4 (P=0.2) and 1.6±0.6 (P=0.05), respectively (Fig.3).DISCUSSION
To our knowledge, this is the first time to investigate the detection of human breast cancer with the GlcN CEST MRI method at a clinical set-up. This study reveals the feasibility of the technique to differentiate between breast cancer and normal-appearing breast tissue. Both the asymmetry analysis and the multi-pool Gaussian fitting may assist in detecting dynamic changes of the CEST signal upon administration of GlcN in breast cancer. The contrast may arise from GlcN or its metabolic products accumulation in the tumor, as was previously shown for a murine model1,2. The enhanced CEST effect can also be explained by tissue acidosis associated with lactate buildup2. The NOE effect indicates that the CEST arises from intracellular GlcN and its metabolites.CONCLUSION
The results of this initial feasibility study indicate the potential of GlcN CEST MRI to diagnose breast cancer in a clinical setting.Acknowledgements
No acknowledgment foundReferences
1. Rivlin, M, et al. Glucosamine and N-acetyl glucosamine as new CEST MRI agents for molecular imaging of tumors. Scientific Reports Nature 2016; 6 (32648) doi:10.1038/srep32648 2. Rivlin M, et al. Molecular imaging of cancer by glucosamine chemical exchange saturation transfer MRI: A preclinical study. NMR in Biomedicine. 2021;34(2):e4431. 3. Anderson, JW et al. Glucosamine effects in humans: a review of effects on glucose metabolism, side effects, safety considerations, and efficacy. Food Chem Toxicol 2005;43(2):187-201. 4. Zaiss M, et al. Quantitative separation of CEST effect from magnetization transfer and spillover effects by Lorentzian-line-fit analysis of z-spectra. J Magn Reson. 2011;211(2):149-155.Figures
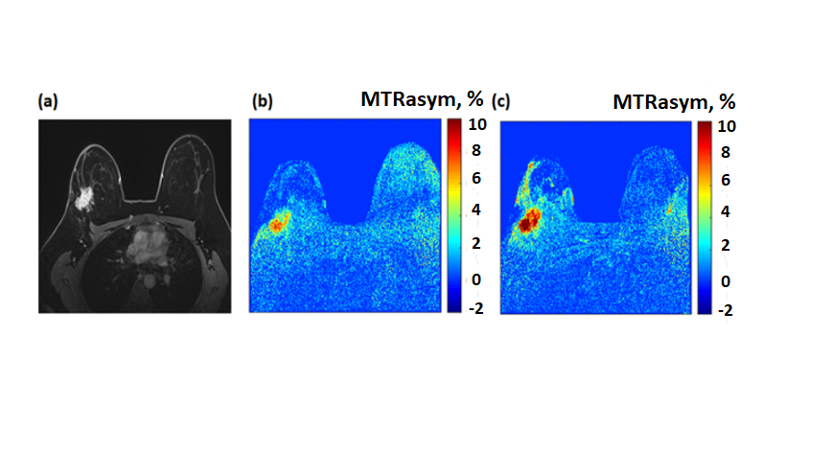
Figure 1: (a-c)
A 34-year-old female patient with grade II-III invasive ductal carcinoma in the
right breast (a) Gadolinium T1W image, (b) and (c) are CEST
MTRasym maps calculated at a frequency offset of 2 ppm before and after oral
administration of GlcN, respectively.
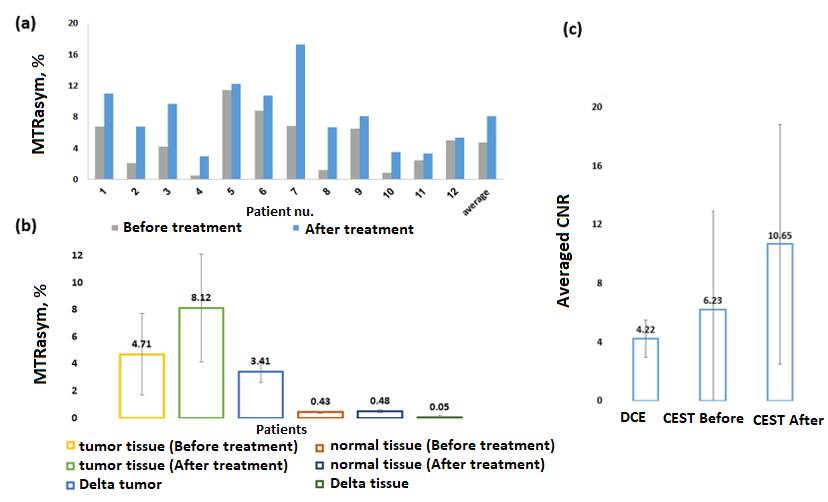
Figure 2: Plots
of the MTRasym at a frequency of 2 ppm as obtained for tumor tissue measured in
the patients (n=12) (a) before and after oral administration of GlcN and (b)
the average results compared with normal breast tissue and (c) the averaged CNR
results as obtained by the T1W-DCE, and CEST imaging methods.
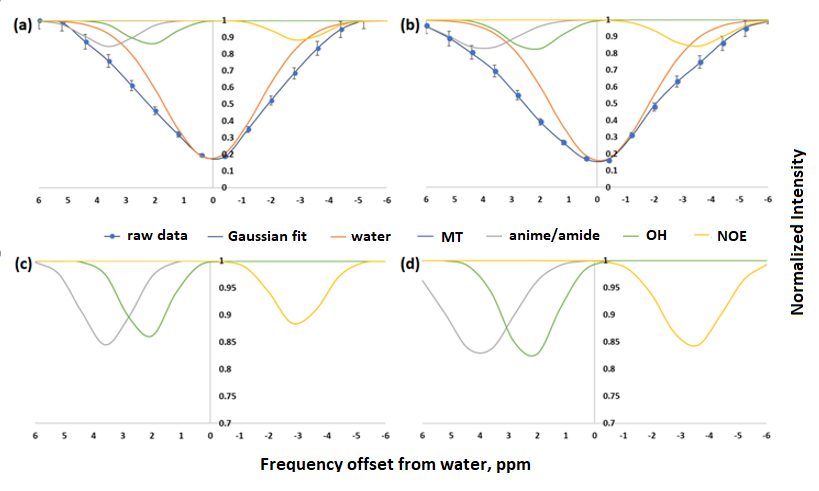
Figure 3: Z-spectra
of breast tumor obtained for a 50-year-old female patient with grade III IDC,
DCIS in the left breast (a) before and (b) after GlcN administration and the
corresponding Multi‐pool Gaussian fitting, shows the contribution from
different pools. (c) and (d) are the fitted different pools, separated from the
raw Z spectra, respectively.
DOI: https://doi.org/10.58530/2022/2799