2798
Within‐subject reliability of proton density estimation using quantitative magnetic resonance imaging1Cleveland Clinic Lou Ruvo Center for Brain Health, Las Vegas, NV, United States
Synopsis
New advances in quantitative MRI (qMRI) techniques provide basic MRI properties such as proton density (PD) that can act as a direct surrogate of the tissue integrity in the voxel. PD may help demonstrate differences on an individual level in patients with multiple sclerosis. In this study, we wanted to compare the within-subject reproducibility of qMRI-based PD measures. Variability in the estimated PD was low and fell within the limits for reliability. These results suggest that in-vivo estimates of PD using qMRI are reproducible within the subject in the same scanner and could play a vital role in clinical studies.
Introduction
Multiple sclerosis (MS) is an auto-immune disorder of the central nervous system characterized by inflammatory demyelinating lesions and axonal degeneration [1, 2]. It is a heterogeneous disease with variable clinical presentations, disease course, and disability levels, making prognostication difficult [3]. There is a need in MS care to be able to identify biomarkers of disease progression, both at the group level and individual level. Current advances in quantitative magnetic resonance imaging (qMRI) techniques provide basic MRI properties such as proton density (PD) that can act as a direct surrogate of the tissue integrity in the voxel [4]. While PD may help demonstrate differences on an individual level in patients with MS, there are still some questions surrounding the repeatability and reproducibility of these measures. Therefore, in this study, we wanted to compare the within-subject repeatability of qMRI-based PD measures.Methods
Quantitative MRI data were obtained from the same healthy control participant (32 y.o. male) over 5 different sessions within 5 weeks on a 3T Siemens Skyra scanner. The participant was positioned in the head-first supine position and a 32-channel coil was used to collect the data. Quantitative T1 and PD imaging we obtained in each scan session using the following qMRI sequences: 2D SE-IR EPI sequence at 4 different inversion times (TI=50ms, 400ms, 1200ms, 2400ms), TR=3s, resolution 1.9mmx1.9mmx4mm, TE=47ms and parallel imaging factor 2 and a FLASH sequence with 4 different flip angles (FA=4deg, 10deg, 20deg, 30deg), TR=14ms and resolution 1mm [4]. PD was estimated using version 2 of the mrQ toolbox [4]. PD values were extracted from the whole brain grey matter (GM), 246 GM regions based on the Brainnetome atlas [5], whole-brain white matter (WM), and twenty major WM tracts [6]. The within-subject reproducibility in the PD measures was assessed using the coefficient of variation (CoV). The CoV was calculated as the ratio of the standard deviation of PD values across the scans and the mean value of PD across the scans.Results
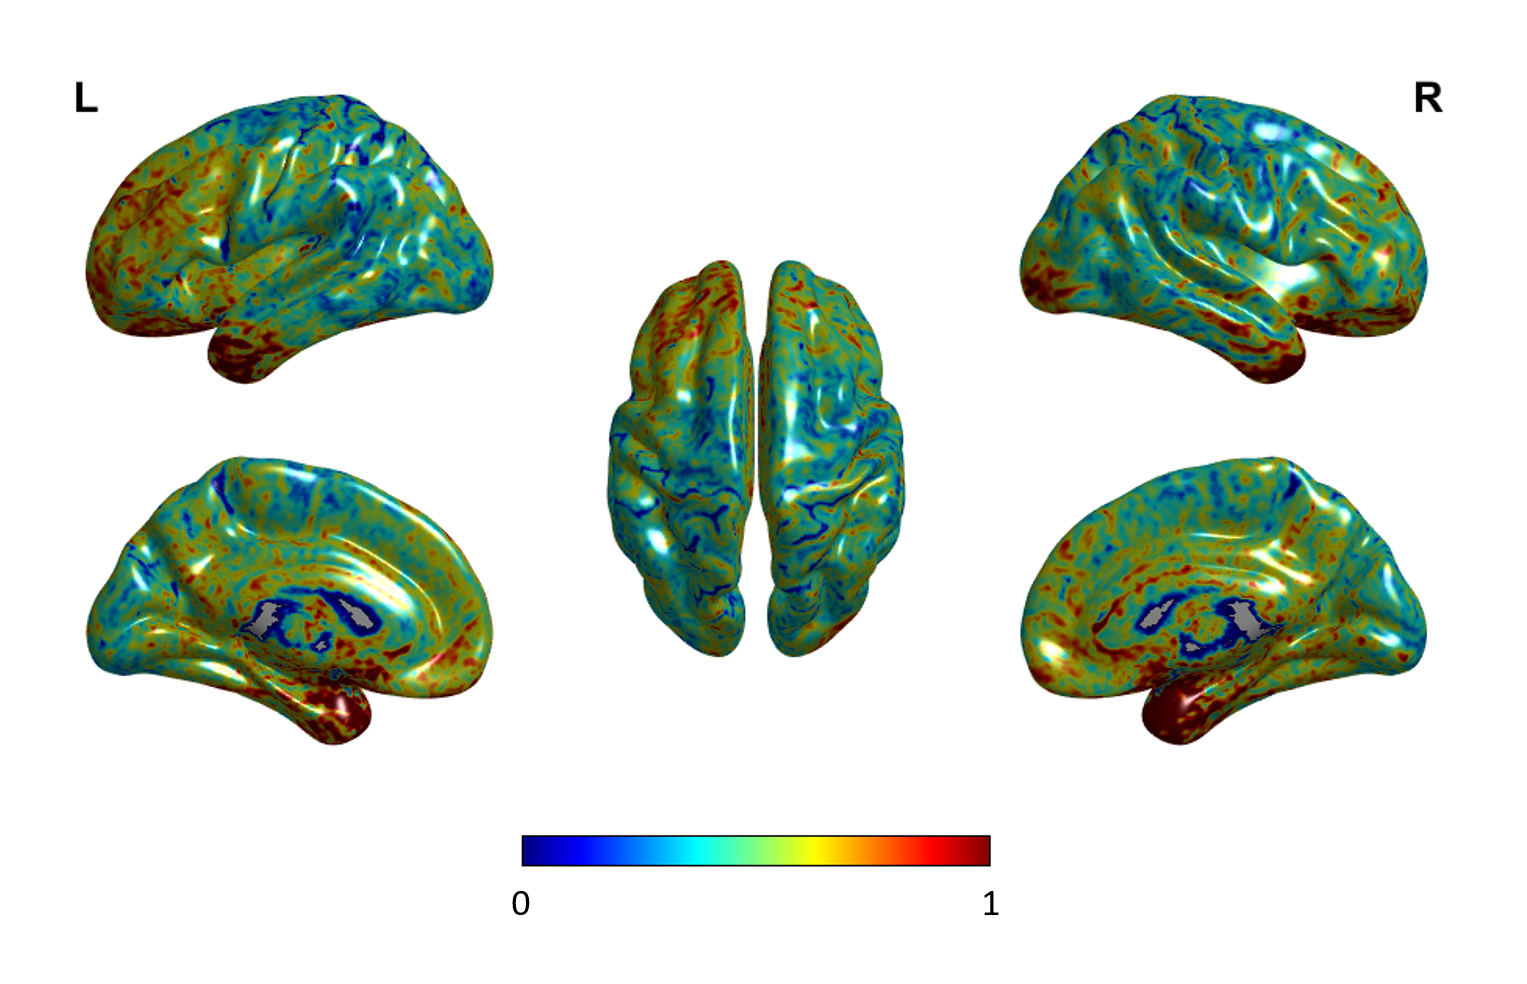
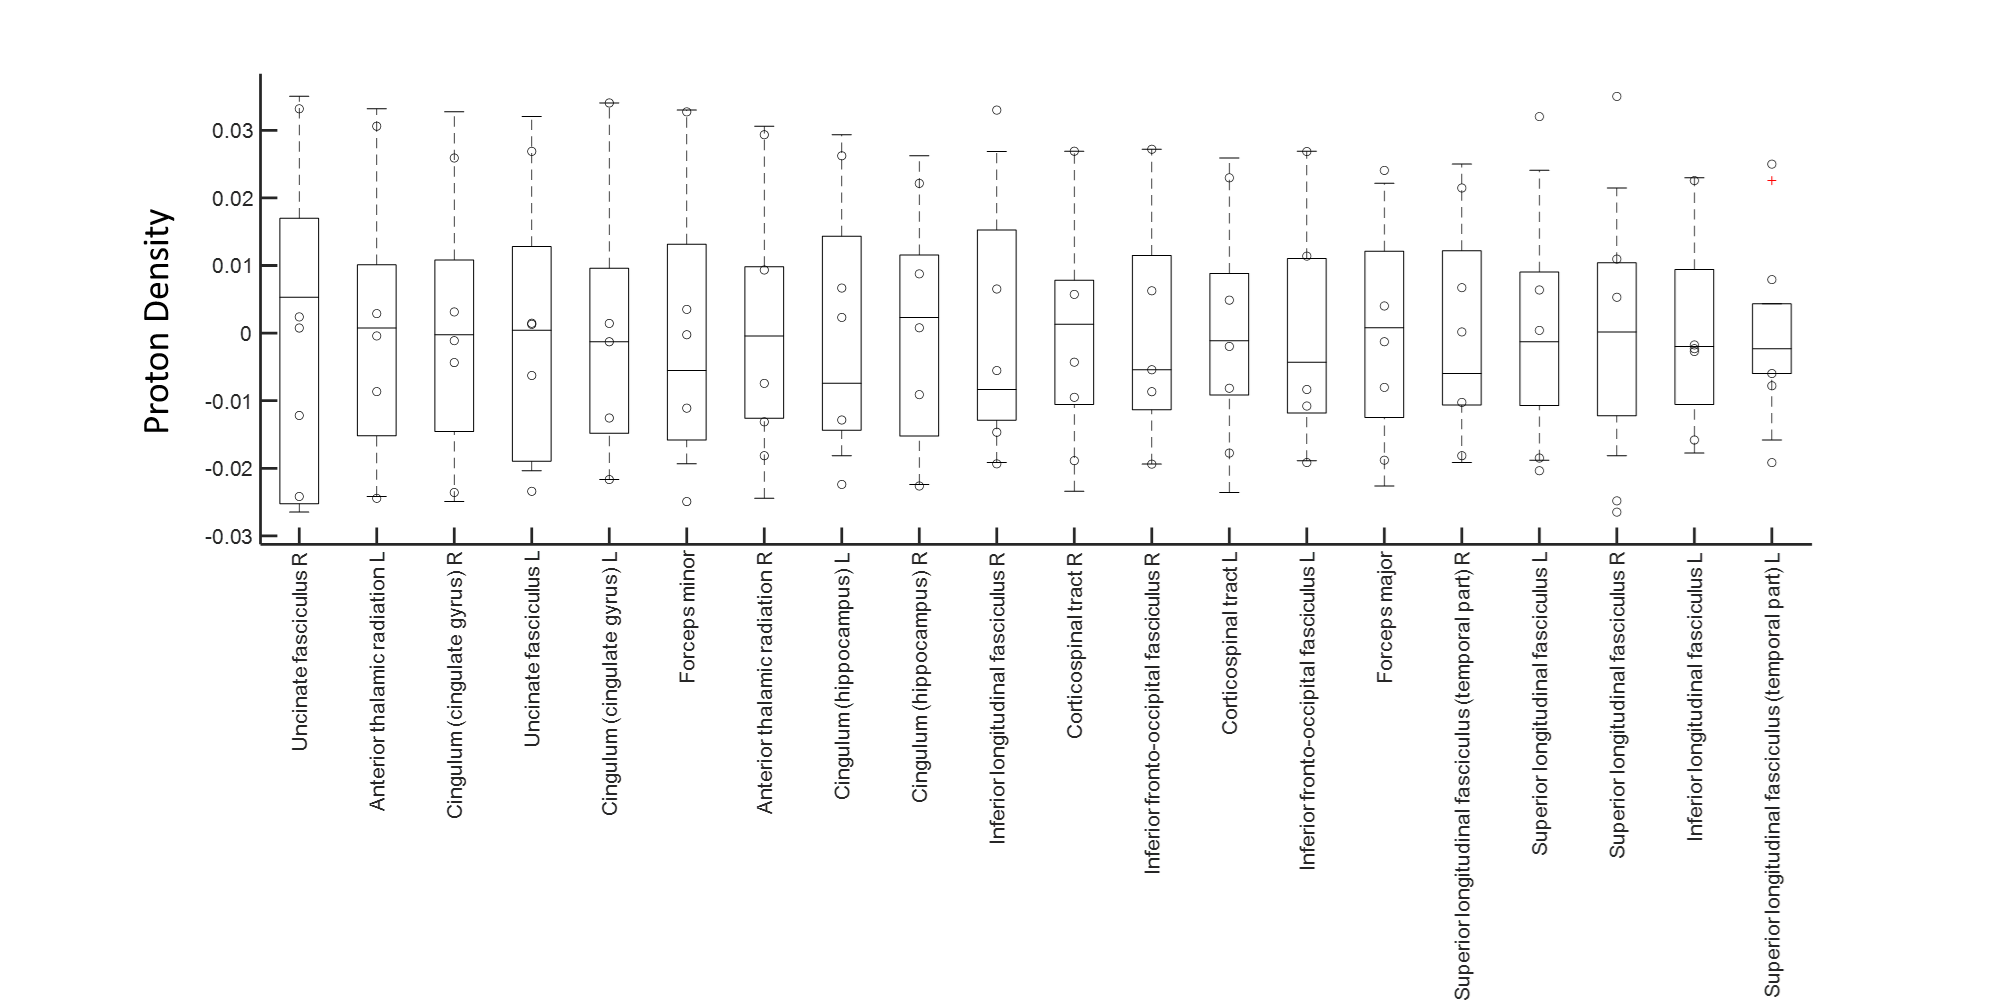
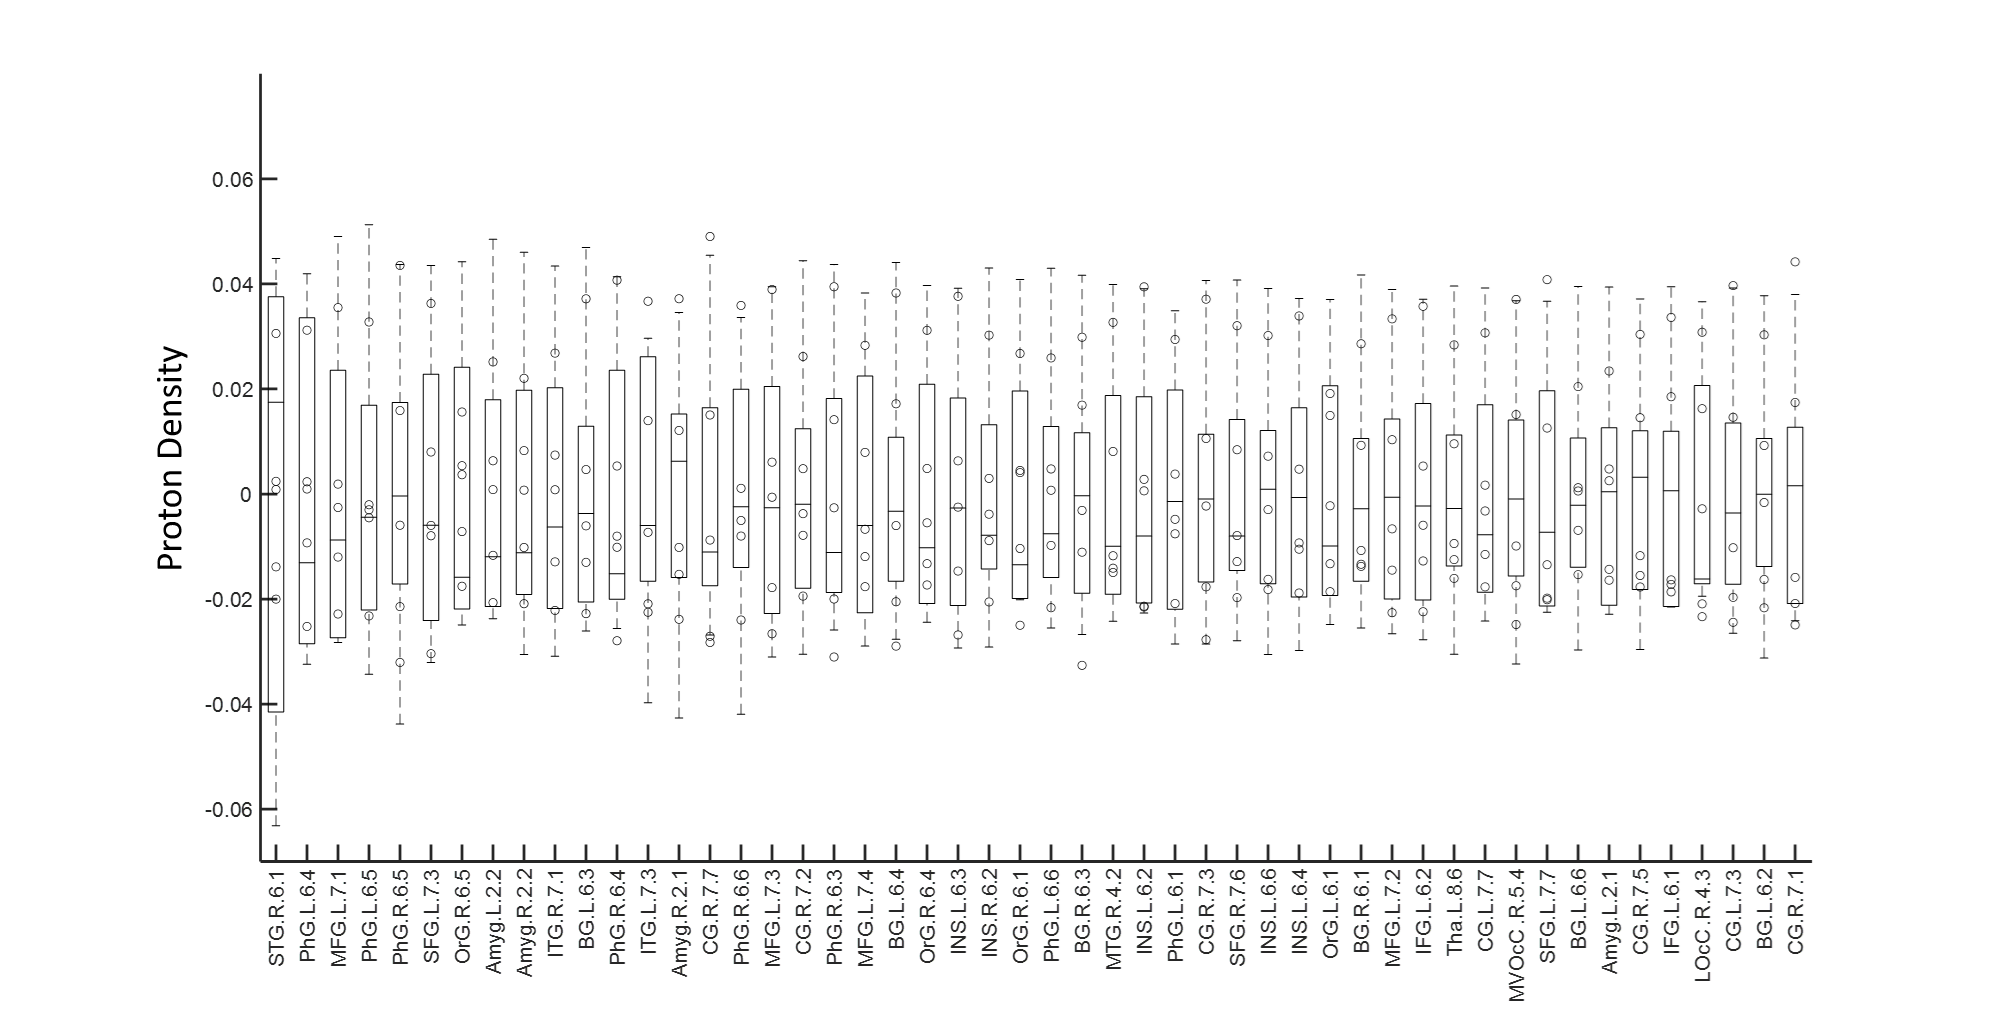
Figure 1 shows the CoV of PD estimation over the entire brain. As can be observed, the majority of the variance is seen in the frontal and temporal regions. However, the CoV for both the whole GM and WM are 0.025 and 0.027 respectively, and fall within the limits of reliability (CoV<0.5). Figure 2 shows the variation in the PD values in the different WM tracts. The variability in the estimated proton density values for the twenty major WM tracts was low with a minimum and maximum CoV of 0.018 and 0.035, respectively. Figure 3 shows the 50 GM regions with the highest variation in the estimated PD values. The GM regions also showed very low variability with a minimum and maximum CoV of 0.0029 and 0.056.Discussion
These results suggest that quantitative proton density mapping using qMRI is reproducible within the same subject and could play a vital role in clinical studies. While there is some variability seen in the cortical regions and the sub-cortical, the majority of the regions still fall within the limits of reliability. Further exploration is warranted to better understand repeatability and reproducibility across different scanners, estimation of PD using different methods [7], understanding correlations between PD and advanced dMRI metrics, test-retest variability across these correlations, and estimation of PD in a patient population.Acknowledgements
This study is supported by the National Institutes of Health (grant 1R01EB014284, R01NS117547, P20GM109025, and P20AG068053), a private grant from the Peter and Angela Dal Pezzo funds, a private grant from Lynn and William Weidner, a private grant from Stacie and Chuck Matthewson and the Keep Memory Alive-Young Investigator Award (Keep Memory Alive Foundation).References
[1] Trapp BD, Nave K-A. Multiple sclerosis: an immune or neurodegenerative disorder? Annu Rev Neurosci 2008; 31: 247–69.
[2] Goldenberg MM. Multiple Sclerosis Review. Pharm Ther 2012; 37: 175–84.
[3] Bsteh G, Ehling R, Lutterotti A, et al. Long Term Clinical Prognostic Factors in Relapsing-Remitting Multiple Sclerosis: Insights from a 10-Year Observational Study. PLoS One. 2016;11(7):e0158978. Published 2016 Jul 8. doi:10.1371/journal.pone.0158978
[4] Mezer A, Yeatman JD, et al. Quantifying the local tissue volume and composition in individual brains with magnetic resonance imaging. Nat Med. 2013 Nov 3; 19(12):1667–72.
[5] Fan L, Li H, Zhuo J, Zhang Y, Wang J, Chen L, Yang Z, Chu C, Xie S, Laird AR, Fox PT, Eickhoff SB, Yu C, Jiang T. The Human Brainnetome Atlas: A New Brain Atlas Based on Connectional Architecture. Cereb Cortex. 2016 Aug;26(8):3508-26. doi: 10.1093/cercor/bhw157. Epub 2016 May 26. PMID: 27230218; PMCID: PMC4961028.
[6] Wakana, S., Caprihan, A., et al. 2007. Reproducibility of Quantitative Tractography Methods Applied to Cerebral White Matter. Neuroimage 36, 630–644.
[7] Cordes D, Yang Z, Zhuang X, Sreenivasan K, Mishra V, Hua LH. A new algebraic method for quantitative proton density mapping using multi-channel coil data. Med Image Anal. 2017 Aug;40:154-171. doi: 10.1016/j.media.2017.06.007. Epub 2017 Jun 23. PMID: 28668358; PMCID: PMC5568742.
Figures